Protection of Structures against Hazards 16-17 October 2014, Tianjin, China
______________________________
†
Blastech Ltd., The BioIncubator, 40 Leavygreave Road, Sheffield, S3 7RD, UK
‡
Defence Science and Technology Laboratory (DSTL), Porton Down, Salisbury, Wiltshire, SP4 0JQ, UK.
TESTING APPARATUS FOR THE SPATIAL AND TEMPORAL
PRESSURE MEASUREMENTS FROM NEAR-FIELD FREE AIR
EXPLOSIONS
S. E. Rigby
*, A. Tyas
*†, S. D. Clarke
*, S. D. Fay
*†, J. A. Warren
*†, I. Elgy
‡& M. Gant
‡*
University of Sheffield, Department of Civil & Structural Engineering, Sir Frederick
Mappin Building, Mappin Street, Sheffield, S1 3JD, UK
e-mail: <sam.rigby@shef.ac.uk>
webpage: www.cmd.shef.ac.uk
Keywords: Blast, Dispersion Correction, Experiment, Hopkinson Pressure Bar, Near-Field
Abstract
. Accurate quantification of the loading on a structure resulting from
the impingement of a blast wave following a high explosive detonation is crucial if
analysts are to be able to determine the viability of protective structures. This is of
particular importance in the case of near-field explosive detonations, where the
magnitude of the loading is extremely high, and highly spatially non -uniform over
the face of the target. This loading can result in localised failure of structural
targets due to brisance or rear-face spalling (predominantly load magnitude
related phenomena) or shear failure due to spatially non-uniform impulse take-up
of the target (predominantly impulse related phenomenon). However, no clear
and simple guidance exists on how to define the magnitude and spatial variation
of very near-field blast loading. Whilst it is possible to use numerical modelling
approaches to simulate the detonation, air-shock propagation and shock-structure
interaction, little definitive, well controlled experimental data exists to validate
such models.
1 INTRODUCTION
When a mass of explosive material detonates it releases a vast amount of energy into the surrounding air. The compressible nature of air causes it to ‘shock up’ as it is displaced away from the source, forming a blast wave – a near-discontinuous increase in pressure, density and energy[1]
. This blast wave can impart stresses that may exceed material strength by several orders of magnitude, thus it is vital for the analyst to be able to accurately quantify the blast load in order to determine the viability of protective structures.
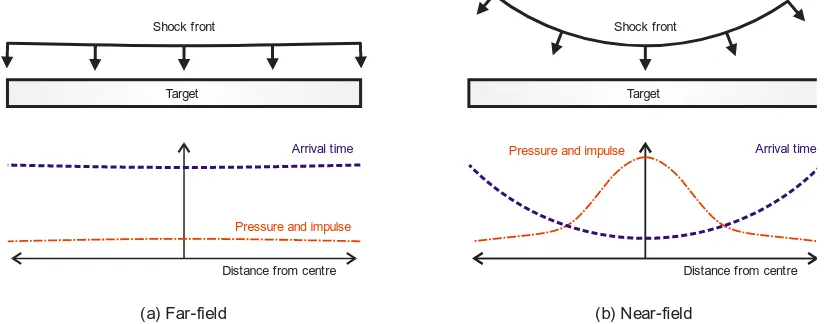
If the explosive is located a large distance from the target, the blast wave will arrive relatively uniformly across the loaded face and impart an effectively spatially uniform, temporally decaying pressure, as in Figure 1(a). Providing there are no obstructions between the target and explosive, and that the reflecting surface is orthogonal to the direction of travel of the blast wave with effectively infinite lateral dimensions, then the semi-empirical blast predictions of Kingery and Bulmash[2] can be used to characterise the form of the blast load. These semi-empirical relationships are incorporated into the UFC-3-340-02 design manual[3], the ConWep computer code[4] and the *LOAD_BLAST[5] module of LS-DYNA, and have been shown to match closely controlled experimental tests with remarkable accuracy[6–8].
[image:2.595.93.506.371.533.2]However, if the blast is located close to the target, the interaction between blast wave and structure and hence the imparted load is more complex – near-field loads are typically characterised by extremely high magnitude, highly spatial and temporally non-uniform loads, as in Figure 1(b). This loading can result in localised failure of structural targets due to brisance or rear-face spalling (predominantly load magnitude related phenomena) or shear failure due to spatially non-uniform impulse take-up of the target (predominantly impulse related phenomenon). It has been reported that the Kingery and Bulmash (KB) semi-empirical relationships are less accurate in the near-field[9] and no clear and simple guidance exists on how to define the magnitude and spatial variation of very near-field blast loading.
Figure 1: Blast interaction diagram and loading parameters associated with ( a) far-field and (b) near-field blast loading
Whilst it is possible to use numerical modelling approaches to simulate the detonation, air-shock propagation and shock-structure interaction, little definitive, well controlled experimental data exists to validate such models. Owing to the extremely onerous conditions near to the source of the explosion, close-in experimental blast parameter measurements are typically conducted by measuring the residual momentum – and hence inferring the imparted impulse – of a small, rigid metal plug embedded within a larger target surface[10,11]. The impulse plug method has been shown to reduce test-to-test scatter and gives an indication of the imparted load at discrete points on the target. What the method does not offer, however, is sufficient temporal resolution of the applied blast pressure, which is a necessary requirement in order to discern the mechanism of near-field loading scenarios and to provide data for stringent validation of numerical modelling approaches.
This paper presents the results from experiments conducted as part of a detailed test series of spatial and temporal measurements from near-field free air explosions. The methodology and results described herein will provide useful insights into the mechanism of loading for extremely close detonations, and will provide data to both validate numerical modelling and offer more complete guidance for predicting the blast load a target will be subjected to. The results are presented along with associated Arbitary Langrangian Eulerian (ALE) modelling using the LS-DYNA explicit numerical code.
Pressure and impulse
Distance from centre
Shock front Shock front
Distance from centre
(a) Far-field (b) Near-field
Target Target
Arrival time
Pressure and impulse
2 EXPERIMENTAL METHOD
2.1 Rig design
[image:3.595.164.410.232.522.2]An experimental methodology has been developed to capture data from extremely aggressive blast events, such as shallow buried land mines and near-field bare explosive charges[12]. This necessitated the fabrication of a purpose-built testing rig. The testing rig consists of two steel fibre and bar reinforced concrete frames spaced 1 m apart, with each frame comprising two 500 mm square columns with a 750 mm deep, 500 mm wide concrete beam spanning between the two columns. A 50 mm thick steel ‘acceptor’ plate was cast into the underside of each of the beams to allow a 1400 mm diameter, 100 mm thick mild steel target plate to span underneath. A central 10.5 mm hole was drilled through the thickness of the target plate with subsequent holes at 25 mm spacing (centre to centre) parallel and perpendicular to the span of the concrete beams. The test rig is shown schematically in Figure 2.
Figure 2: Schematic of the test frame
10 mm diameter, 3.25 m long mild steel Hopkinson Pressure Bars (HPBs) were inserted through the bar holes and suspended from a receiver frame placed atop the main reaction frame such that their ends sat flush with the target face. Perimeter-mounted strain gauges were located 250 mm from the loaded face of the bars – an axial stress pulse propagating along the length of the bar will cause a change in strain at the perimeter as it propagates over the gauge, hence the strain gauges can be used to measure the temporal variation of blast pressure at discrete points on the target face. Up to 20 bars can be used in any given test, located within a 100 mm radius circle. An in-house interpolation routine enables a detailed description of the spatial variation of blast to be inferred from the array of pressure-time readings[12], which vastly improves the usability of the results when compared to previous trials involving a similar experimental approach[13,14]. Strain data was recorded using a 14-Bit Digital Oscilloscope at a sample rate of 1.56 MHz, triggered via a voltage drop in a breakwire embedded in the charge periphery to synchronise the recordings with the detonation. A small sacrificial timber sling was hung underneath the target plate for each test to hold the charge in position. The detonator was placed into the bottom of the charge through a hole in the timber sling, as a preliminary study showed that this arrangement is preferential over a top-inserted detonation because of the risk of the signal cable or breakwire coming into contact with the face of one of the bars and contaminating the data[12].
Reinforced concrete frame
Target plate Steel ‘acceptor’ plate
Hopkinson pressure bar array Bar assembly receiver
Centre of explosive Stand-off
Elevation
2.2 Example results
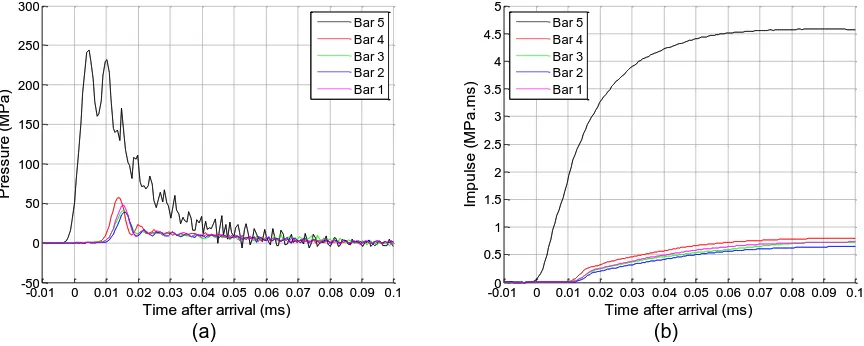
Figure 3 shows the recorded pressure-time and impulse-time histories arising from the detonation of a 100 g spherical PE4 charge located at a normal distance of 75 mm from the target face. For this test, a single HPB was located directly in line with the centre of the charge (Bar 5) with four bars (Bars 1-4) located at 100 m distance away from the central bar (giving a slant distance of 125 mm and an angle of incidence of 53°). The impulse was given by numerically integrating the pressure signals with respect to time. The time datum has been shifted such that corresponds to the arrival time of the stress pulse at the gauge location in Bar 5.
3 NUMERICAL MODELLING
3.1 Model setup and far-field validation
Numerical analyses were conducted using the LS-DYNA explicit finite element (FE) software[15]. In this study, the explosive and surrounding air were modelled using axi-symmetric multi-material ALE elements. The explosive was modelled using the Jones-Wilkins-Lee (JWL) equation of state[16] and *MAT_HIGH_EXPLOSIVE_BURN material model (Table 1). The air was modelled using a linear polynomial equation of state and *MAT_NULL material model.
The numerical model was validated against the experimental measurements of far-field reflected pressure acting on a rigid, semi-infinite target[17]. This validation was conducted before the main numerical study to give confidence that the physics are well captured in a relatively simple scenario before the more complex issues associated with near-field loading were addressed, and also because better quality experimental results are available in the far-field.
A 250 g hemispherical PE4 charge was detonated 4 m away from and normal to a pressure gauge located just above ground level embedded in the exterior of a reinforced concrete bunker wall. The
(a) (b)
Figure 3: (a) Experimental pressure-time histories and (b) experimental impulse-time histories
PE4
*MAT_HIGH_EXPLOSIVE_BURN
1601 8193 2.80E10
*EOS_JWL
609.77E9 12.95E9 4.50 1.40 0.25 9.0E9
Air
*MAT_NULL
1.225
*EOS_LINEAR_POLYNOMIAL
0.0 0.0 0.0 0.0 0.4 0.4 0.0 253.4E3
Table 1: Material model and equation of state parameters for air and PE4 (SI units) -0.01 0 0.01 0.02 0.03 0.04 0.05 0.06 0.07 0.08 0.09 0.1
-50 0 50 100 150 200 250 300
P
re
s
s
u
re
(
M
P
a
)
Time after arrival (ms)
-0.01 0 0.01 0.02 0.03 0.04 0.05 0.06 0.07 0.08 0.09 0.1 -50
0 50 100 150 200 250 300
P
re
s
s
u
re
(
M
P
a
)
Time after arrival (ms)
Bar 5 Bar 4 Bar 3 Bar 2 Bar 1
-0.010 0 0.01 0.02 0.03 0.04 0.05 0.06 0.07 0.08 0.09 0.1 0.5
1 1.5 2 2.5 3 3.5 4 4.5 5
Im
p
u
ls
e
(
M
P
a
.m
s
)
Time after arrival (ms)
-0.010 0 0.01 0.02 0.03 0.04 0.05 0.06 0.07 0.08 0.09 0.1 0.5
1 1.5 2 2.5 3 3.5 4 4.5 5
Im
p
u
ls
e
(
M
P
a
.m
s
)
Time after arrival (ms) Bar 5
[image:4.595.80.512.185.358.2]charge was detonated on a flat, level, rigid ground slab and was assumed to behave as a hemispherical surface burst. The detonation and initial blast wave propagation was modelled using a radially symmetric mesh, which was then mapped on to a regular grid mesh 7.1 ms after detonation (immediately prior to reaching the target) to allow the rigid structure to be modelled as nodal-point constraints whilst minimising the second order advection error associated with transporting material diagonally across elements[18].
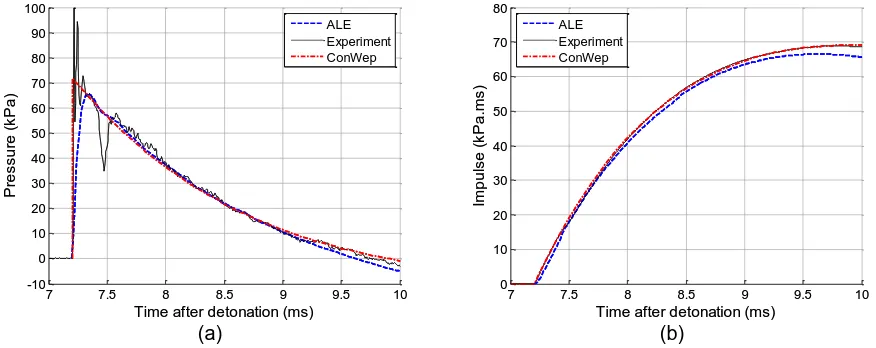
Figure 4 shows experimental and numerical pressure-time and impulse time histories, along with ConWep[4] semi-empirical predictions for comparison. The numerical model is in excellent agreement with both the experimentally measured and predicted blast load.
3.2 Numerical results
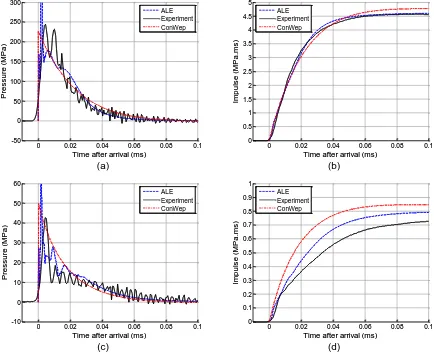
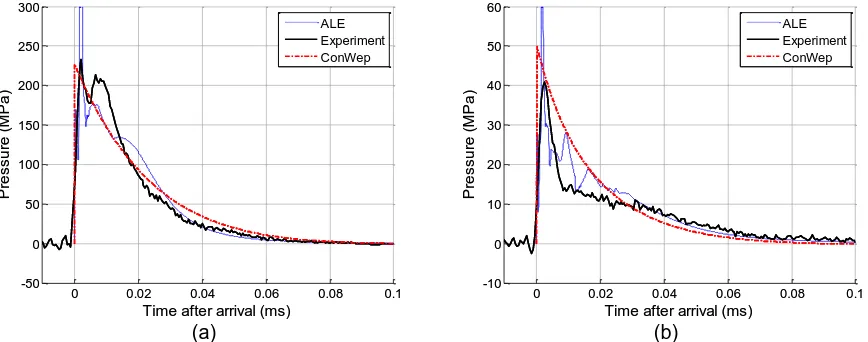
A numerical analysis was conducted again using axi-symmetric multi-material ALE elements. A 100 g spherical PE4 charge was detonated 75 mm from the target face, as per the example experimental results, with the initial detonation and propagation represented by a radial mesh comprising 506,800 elements with a maximum element side length of 0.3 mm. At 11 μs after detonation, information from this analysis was remapped on to a 0.25 m x 0.075 m grid mesh, comprising 833,500 square elements with a 0.15 mm side length, and the blast wave was allowed to interact with the target simulated using a rigid boundary. Figure 5 shows the numerical, experimental and ConWep pressure-time and specific impulse-time histories for the normal (in line with the charge) and oblique (100 mm along the target face) HPB locations. Henceforth, oblique experimental results are only shown for Bar 2 for clearer presentation.
4 DISCUSSION & INTERPRETATION OF RESULTS
Generally the impulse is in very good agreement between numerical, experimental and ConWep results for both normal and oblique traces, with ConWep predicting a slightly higher impulse in both cases. What is clear, however, is that the form of the near-field blast load may not be as simple as the exponential ‘Friedlander’ decay assumed by ConWep which has been shown to be accurate for far-field loading.
In the ALE model, a secondary shock arrives almost immediately after the primary shock front, resulting in peak reflected pressures in excess of 300 MPa. This is caused by reflection of the shock wave off the boundary between the expanding detonating products and the shocked air and is consistent with behaviour observed by Edwards et al.[13] This effect may, however, be exaggerated in the numerical model as a result of simplification of the turbulent mixing and Rayleigh-Taylor instabilities which are known to cause non-spherical expansion of the detonation products[19]. It is hypothesised by the current authors that mixing at the explosive/air interface will result in lower magnitude and longer duration reflected shock fronts caused by a gradual change in impedance between the two products.
Another salient feature of the normally reflected ALE load, which again is not represented in the ConWep predictions, is the temporary plateau in pressure (between 0.00 and 0.01 ms), followed by a gradual leaking of pressure along the face of the target (0.02 ms onwards). This is the result of
[image:5.595.77.515.191.365.2](a) (b)
Figure 4: Numerical, experimental and empirical (a) pressure-time and (b) specific impulse-time histories for far-field loading
7 7.5 8 8.5 9 9.5 10
-10 0 10 20 30 40 50 60 70 80 90 100
Time after detonation (ms)
P
re
s
s
u
re
(
k
P
a
)
ALE Experiment ConWep
7 7.5 8 8.5 9 9.5 10
-10 0 10 20 30 40 50 60 70 80 90 100
Time after detonation (ms)
P
re
s
s
u
re
(
k
P
a
)
7 7.5 8 8.5 9 9.5 10
0 10 20 30 40 50 60 70 80
Time after detonation (ms)
Im
p
u
ls
e
(
k
P
a
.m
s
)
ALE Experiment ConWep
7 7.5 8 8.5 9 9.5 10
0 10 20 30 40 50 60 70 80
Time after detonation (ms)
Im
p
u
ls
e
(
k
P
a
.m
s
shocked air being trapped between the target and the detonating products before it is allowed to vent laterally. Despite the experimental results offering valuable information in terms of total impulse imparted to the target, it is difficult to discern any of these features from the experimental data.
As a stress pulse propagates along a cylindrical bar, Pochammer-Chree dispersion causes higher frequency components of the signal to travel at lower velocities than lower frequency components. The result of this is, for a signal recorded at some distance along the bar, certain frequencies will have fallen out of sync. This can be seen clearly by the oscillatory nature of the experimentally recorded pressure signals. Frequency domain phase-shift methods have been shown to be limited to a bandwidth of 1250/ Hz, where is the bar radius in mm[20]. For blast loads, the instantaneous rise to peak pressure contains a significant high frequency content, hence existing methods of dispersion correction may not be appropriate for this study.
Instead, a new method is introduced, based on backward dispersion of the signal using an FE model. Consider an idealised stress pulse containing only two frequency components. If this signal were recorded at some distance along the bar, the time by which the two signals will be out of sync will be proportional to the distance the pulse had travelled and the relative phase velocities of the two frequency components. If the signal was then propagated backwards along an identical HPB (i.e. reversing of the time datum of the recorded signal), then the frequency components would fall back in sync after travelling exactly the same distance that they had originally travelled (i.e. the distance from the face of the bar to the strain gauge).
With reference to Figure 6, the new FE backward dispersion method proposed in this article is implemented in the following way:
a) Take the experimental pressure-time history recorded at a distance away from the face of the HPB
b) Reverse the time datum of the signal
(a) (b)
[image:6.595.79.513.94.448.2](c) (d)
Figure 5: Numerical, experimental and ConWep pressure-time and specific impulse-time histories for near-field loading. (a) Normal pressure, (b) normal impulse, (c) oblique pressure, (d) oblique impulse
0 0.02 0.04 0.06 0.08 0.1
-50 0 50 100 150 200 250 300
Time after arrival (ms)
P re s s u re ( M P a ) ALE Experiment ConWep
0 0.02 0.04 0.06 0.08 0.1
-50 0 50 100 150 200 250 300
Time after arrival (ms)
P re s s u re ( M P a )
0 0.02 0.04 0.06 0.08 0.1
0 0.5 1 1.5 2 2.5 3 3.5 4 4.5 5
Time after arrival (ms)
Im p u ls e ( M P a .m s ) ALE Experiment ConWep
0 0.02 0.04 0.06 0.08 0.1
0 0.5 1 1.5 2 2.5 3 3.5 4 4.5 5
Time after arrival (ms)
Im p u ls e ( M P a .m s )
0 0.02 0.04 0.06 0.08 0.1
-10 0 10 20 30 40 50 60
Time after arrival (ms)
P re s s u re ( M P a ) ALE Experiment ConWep
0 0.02 0.04 0.06 0.08 0.1
-10 0 10 20 30 40 50 60
Time after arrival (ms)
P re s s u re ( M P a )
0 0.02 0.04 0.06 0.08 0.1
0 0.1 0.2 0.3 0.4 0.5 0.6 0.7 0.8 0.9 1
Time after arrival (ms)
Im p u ls e ( M P a .m s ) ALE Experiment ConWep
0 0.02 0.04 0.06 0.08 0.1
0 0.1 0.2 0.3 0.4 0.5 0.6 0.7 0.8 0.9 1
Time after arrival (ms)
c) Apply this as a force-time history to the end of an FE model of a HPB
d) Record the numerical pressure-time history recorded at a distance away from the face of the HPB (it is preferential to record nodal velocities, , and calculate the magnitude of stress, , from the expression , where and are the HPB density and elastic wavespeed respectively)
e) Reverse the time datum of the signal to get the FE backward dispersion corrected signal.
Figure 7 shows numerical, ConWep and FE backward dispersed experimental pressure-time histories for the normal and oblique HPB locations. The HPBs were modelled with density, Young’s modulus and Poisson’s ratio of 7850 kg/m1/3
, 210 GPa, and 0.3 respectively.
It is immediately clear that this method has effectively removed a large proportion of the oscillations in the experimental data, allowing for more accurate characterisation of peak pressures and impulses. From the dispersion corrected normally reflected data it appears as though features such as the double shock front (0.00 to 0.01 ms) and subsequent pressure venting (0.01 ms onwards) are in fact genuine features which are captured by the experimental setup. For both normal and oblique shots, it appears as though the experimental pressure-time histories are in better agreement with the form and magnitude of the ALE results ahead of the ConWep predictions. This gives confidence that the experimental approach is sufficient to (a) investigate the form of the near-field blast pressure load and (b) provide data for validation of numerical modelling approaches.
5 SUMMARY
[image:7.595.79.529.71.265.2]Accurate quantification of the loading on a structure resulting from the impingement of a blast wave following a high explosive detonation is crucial if analysts are to be able to determine the viability of protective structures. This paper presents an experimental methodology that has been developed to gather experimental data for research into near-field blast loading and to provide data for validation of numerical modelling approaches. The experimental rig comprises an array of Hopkinson Pressure Bars fitted through holes in a target with the loaded faces of the bars flush with
Figure 6: The process of FE backward dispersion correction
(a) (b)
Figure 7: (a) Normally reflected and (b) oblique pressure-time histories with FE backward dispersion correction applied to experimental results
p
t p
t
p
t p
t
(a) (b) (d) (e)
(c)
y y
0 0.02 0.04 0.06 0.08 0.1
-50 0 50 100 150 200 250 300
Time after arrival (ms)
P
re
s
s
u
re
(
M
P
a
)
ALE Experiment ConWep
0 0.02 0.04 0.06 0.08 0.1
-50 0 50 100 150 200 250 300
Time after arrival (ms)
P
re
s
s
u
re
(
M
P
a
)
0 0.02 0.04 0.06 0.08 0.1
-10 0 10 20 30 40 50 60
Time after arrival (ms)
P
re
s
s
u
re
(
M
P
a
)
ALE Experiment ConWep
0 0.02 0.04 0.06 0.08 0.1
-10 0 10 20 30 40 50 60
Time after arrival (ms)
P
re
s
s
u
re
(
M
P
a
[image:7.595.80.514.346.517.2]the target face. Thus, the bars are exposed to the normally or obliquely reflected shocks from the impingement of the blast wave with the target.
Pressure-time recordings are presented for a 100 g sphere of PE4 detonated at 75 mm normal distance from the rigid target plate. Numerical analyses are conducted using LS-DYNA, and the form of the near-field blast pressure load is discussed. A new method for dispersion correction is introduced, which is based on sending the dispersed pulse backwards through a finite element model of a Hopkinson Pressure Bar. The results show promise, and indicate that the experimental apparatus can accurately capture the salient features of near-field blast loading.
REFERENCES
[1] W. E. Baker. Explosions in air. University of Texas Press, Austin, TX, USA, 1973.
[2] C. N. Kingery and G. Bulmash. Airblast parameters from TNT spherical air burst and hemispherical surface burst. Technical Report ARBRL-TR-02555, U.S Army BRL, Aberdeen Proving Ground, MD, USA, 1984.
[3] US Department of Defence. Structures to resist the effects of accidental explosions. US DoD, Washington DC, USA, UFC-3-340-02, 2008.
[4] D. W. Hyde. Conventional Weapons Program (ConWep). U.S Army Waterways Experimental Station, Vicksburg, MS, USA, 1991.
[5] G. Randers-Pehrson and K.A. Bannister. Airblast loading model for DYNA2D and DYNA3D. Technical Report ARL-TR-1310, U.S Army Research Laboratory, Aberdeen Proving Ground, MD, USA, 1997.
[6] D. D. Rickman and D. W. Murrell. Development of an improved methodology for predicting airblast pressure relief on a directly loaded wall. Journal of Pressure Vessel Technology, 129(1):195–204, 2007.
[7] A. Tyas, J. Warren, T. Bennett, and S. Fay. Prediction of clearing effects in far-field blast loading of finite targets. Shock Waves, 21(2):111–119, 2011.
[8] S. E. Rigby, A. Tyas, T. Bennett, S. D. Clarke, and S. D. Fay. The negative phase of the blast load. International Journal of Protective Structures, 5(1):1–20, 2014.
[9] D. Bogosian, J. Ferritto, and Y. Shi. Measuring uncertainty and conservatism in simplified blast models. In 30th Explosives Safety Seminar, pages 1–26. Atlanta, GA, USA, 2002.
[10] Ewing W. O. Huffington, N. J. Reflected impulse near spherical charges. Technical Report BRL-TR-2678, Ballistic Research Laboratories, MD, USA, 1985.
[11] Veldman R. L. Chen C. C. Lawrence W. Nansteel, M. W. Impulse plug measurements of blast reflected impulse at close range. Propellants, Explosives, Pyrotechnics, 38(1):120–128, 2013. [12] S. D. Clarke, S. D. Fay, J. A. Warren, A. Tyas, S. E Rigby, and I. Elgy. A large scale
experimental approach to the measurement of spatially and temporally localised loading from the detonation of shallow-buried explosives. Submitted for possible publication in Measurement Science and Technology, 2014.
[13] D. H. Edwards, G. O. Thomas, A. Milne, G. Hooper, and D. Tasker. Blast wave measurements close to explosive charges. Shock Waves, 2:237–243, 1992.
[14] S. A. Mullin J. D. Walker B. L. Morris J. E. Drotleff, C. T. Vincent. Research in close-in blast loading from high explosives. Technical Report ARL-CR-308, Army Research Laboratory, MD, USA, 1996.
[15] J. O. Hallquist. LS-DYNA Theory Manual. Livermore Software Technology Corporation, CA, USA, 2006.
[16] E. L. Lee, H. C. Hornig, and J. W. Kury. Adiabatic expansion of high explosive detonation products. Technical Report TID 4500-UCRL 50422, Lawrence Radiation Laboratory, University of California, CA, USA, 1968.
[17] S. E. Rigby, A. Tyas, and T. Bennett. Single-degree-of-freedom response of finite targets subjected to blast loading - the influence of clearing. Engineering Structures, 45:396–404, 2012. [18] S. E. Rigby, A. Tyas, T. Bennett, S. D Fay, S. D Clarke, and J. A Warren. A numerical
investigation of blast loading and clearing on small targets. International Journal of Protective Structures, 5(3):253-274, 2014.
[19] G. S. Doronin D. I. Matsukov A. V. Morozov, E. I. Ermolovich. Configuration of a cloud of detonation products during expansion in air. Combustion, Explosion and Shock Waves, 27(4):500–504, 1992.
