~ 49 ~ WWJMRD 2018; 4(1): 49-56
www.wwjmrd.com International Journal Peer Reviewed Journal Refereed Journal Indexed Journal UGC Approved Journal Impact Factor MJIF: 4.25 e-ISSN: 2454-6615
El-Gindy A.M.
Agriculture Engineering, Ain Shams, Univ.Dokki, Cairo, Egypt
K. F. El-Bagoury
Agriculture Engineering, Ain Shams, Univ.Dokki, Cairo, Egypt
Ebtisam I. Eldardiry Water Relations and Field Irrigation Dept. National Research Centre, El-Buhouth St., Dokki, Cairo, Egypt
M. Abd El Hady
Water Relations and Field Irrigation Dept. National Research Centre, El-Buhouth St., Dokki, Cairo, Egypt
Rania A. Elkersh Water Relations and Field Irrigation Dept. National Research Centre, El-Buhouth St., Dokki, Cairo, Egypt
Correspondence: Ebtisam I. Eldardiry Water Relations and Field Irrigation Dept. National Research Centre, El-Buhouth St., Dokki, Cairo, Egypt
Hydraulic Studies of Drip Irrigation System under
Using Low Quality Water Conditions I- Application
efficiency, Uniformity Coefficient and Coefficient of
Variation of the examined emitters.
El-Gindy A.M., K. F. El-Bagoury, Ebtisam I. Eldardiry, M. Abd El-
Hady, Rania A. Elkersh
Abstract
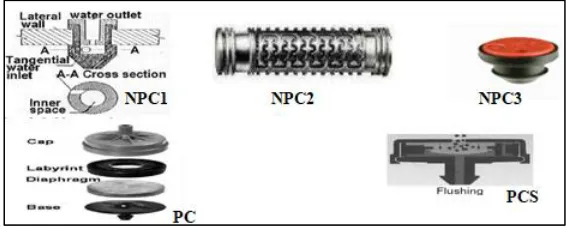
Water characteristics have the majority effect on the hydraulic performance of on-farm irrigation systems and their equipment. Therefore, the aim of this study was to evaluate the hydraulic characterization of surface drip irrigation system and its emitters under saline-water conditions. Hereby, laboratory experiment was carried out at water Relations and Field Irrigation Dept., (NRC) to evaluate hydraulic performance of five emitter types. Lab experiments were conducted to evaluate hydraulic parameters for five emitter types [Non pressure compensating 1emitter (NPC1), Non pressure compensating 2 emitter (NPC2), Non pressure compensating 3 emitter (NPC3), pressure compensating emitter (PC), and Pressure compensating and Self-flushing emitter (PCS)] under water salinity (345, 2000, 4000, 6000; 8000 ppm) and different operation pressure heads (0.8, 1.0, 1.2, 1.4, 1.6, 1.8; 2 bar). Results showed that using NPC1, NPC2 and NPC3 under water salinity 345, 2000 and 4000 ppm were better in uniformity coefficient, manufacture variation, and clogging ratio. It could be concluded that emitter types of NPC1, NPC2, and NPC3 under using water salinity 345, 2000, and 4000 ppm were the best and could be recommended to apply in the field research work. There are no significant differences between PC, PCS, NPC1, NPC2 and NPC3 in this concern so, the emitters NPC1, NPC2, and NPC3 are recommended to use in field experiment.
Keywords: Hydraulic, uniformity coefficient coefficient of variation, emitter type, water salinity
Introduction
of system failure due to clogging of the drippers and filtering difficulties. The clogging of drip emitters is the largest maintenance problem with drip systems (Keller and Bliesner, 1990). It is difficult to detect and expensive to clean or replace clogged emitters. Partial or complete clogging reduces emission uniformity and as a consequence decreases irrigation efficiency (Capra and Scicolone, 2004). Clogging causes the poor distribution of water between the plants. In technical terms, it reduces emission uniformity. Emission uniformity is not a parameter of efficiency, but it is not possible to have high efficiency when emission uniformity is low. In these conditions, to assure that all plants receive their water requirement, the water volumes needed for crop growing increase. Over-irrigation caused deep percolation and consequent disadvantages, due to energy costs, fertilizer leaching, drainage needs and groundwater contamination risk.
Material and Methods
Laboratory experiments were carried out at the department of water relations and field irrigation, National Research Centre (NRC), El-Dokki, Cairo, Egypt. Five saline water degrees having different salinity (EC) (345, 2000, 4000, 6000 and 8000 ppm) (0.52, 3.13, 6.25,9.043 and 12.052 dS m-1) were used. With Five types of emitters [Non pressure
compensating 1emitter (NPC1), Non pressure
compensating 2 emitter (NPC2), Non pressure
compensating 3 emitter (NPC3), pressure compensating
emitter (PC), and Pressure compensating and Self-flushing emitter (PCS)] under different pressure head levels 0.8, 1.0, 1.2, 1.4, 1.6, 1.8 and 2 bar. With discharge rate 4 l/h were used. The experiment was laid out in factorial RCB design with three repetitions. Irrigation water of desired salinity levels were prepared by mixing canal water (EC=345 ppm) with underground water (EC= 4000 ppm) and stored in plastic tank of 1000 liters capacity.
Emitter discharge was measured (volumetrically and triplicated) over a range of seven pressures (0.8, 1.0, 1.2, 1.4, 1.6, 1.8, and 2 bar) to determine the manufacturing variation of each type. A stopwatch was used to measure the flow times. The water volumes were collected in the graduated cylinders andmanually read and recorded.
The experimental layout
The lab study used a laboratory-scale apparatus fitted with two laterals of PE drip tubing, each 15 m in length. Each lateral contains 50 emitters (4 l/h) with a space of 30 cm. five types of emitters were used as shown in Table (1). Water was supplied to the laterals from a Polyethylene, 500L (0.5 m3) supply tank using a 373-watt (0.5hp), high head pump. Additionally, a flow meter was installed to record the total volume of water supplied to the system. The pressure in the laterals was regulated by a two bar regulator installed after the pump. One-liter measuring cylinders with10 mL divisions were used to collect the water from the emitters as shown in Figure (1).
Fig. 1: lab experiment layout.
Table (1): Manufacturer’s parameters of selected drip emitters
Emitter model Emitter
type
Nominal flow rate (L/hr @ Kpa)
Recommended operating pressure (Kpa)
NEIN-ETF NPC1 PS 3.90 @137.9 68.9 – 310.3
GR NPC2 LS 3.79 @167.9 48.3 – 413.7
NEIN ENEIN- PC
PC PS
3.785 @ 172.37 68.95 – 413.7
EDEN NEIN- PC PCS PS 3.785 @ 172.37 68.95 – 413.7
KATIF Rivulis Plastro NPC3 4.00 @ 206.84 68.95 – 413.7
PC: Pressure compensating, NPC: Non pressure compensating, PCS: Pressure compensating and Self-flushing, LS = Line source, PS = Point source.
~ 51 ~
Performance and evaluation of the selected emitters
During the test, water temperature was measured by a digital thermometer with a precision of ± 1.0̊c to account for viscosity changes. Specific emitter flow functions, such as pressure flow relationship and manufacture coefficient, were determined. These tests were conducted at a water temperature of (20 -23) ̊c. for point source and line source devices, the flow rate determination was calculated per outlet.
The pressure influence on emitter flow rate can be presented in two ways, either directly as the average of emitter flow rate or as a percentage of flow rate change that occurred at the actual operating pressure and pressure of 1 bar with the same water temperature, divided by the flow rate at pressure of 1 bar according to (Keller and Karmeli, 1974 ) as follows:
= –X 100 ……… (1)
where
q var: the emitter flow variation
qmax: the maximum emitter flow along the lateral line, l/h, and qmin: the minimum emitter flow along the lateral line, l/h.
Emitters discharge
A numerical method to measure the desirability of pressure, flow characteristics for a given emitter device is based on a flow rate vs. pressure curve (Q-H) fitted to an equation of the following
form: Q=k ……….. (2)
Where: Q is the emitter flow rate, m3/sec; k is the emitter Coefficient, 1/sec; H is the pressure head in the lateral at the location of emitters, m; and x is the exponent characteristics of emitters, unit less.
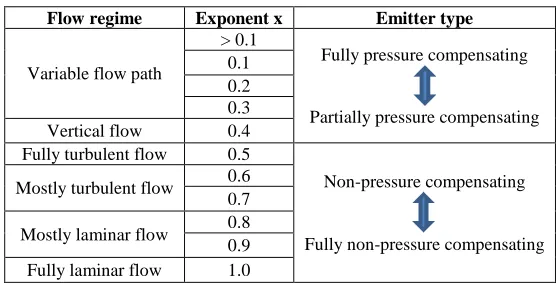
Exponent x is an indication of the flow regime and emitter type. It is an indirect measure of the sensitivity of flow rate to the change in pressure. The value of x typically ranges between 0-1.0, where a lower value indicates a lower sensitivity and a higher value indicates a higher sensitivity. For PC emitters the value should be less than 0.1 and should approach 0. For NPC emitters, it should approach 0.5 (Cuenca, 1989).
Table (2): Emitter exponent values for various emitters (ASAE, 1985)
Flow regime Exponent x Emitter type
Variable flow path
> 0.1
Fully pressure compensating
Partially pressure compensating 0.1
0.2 0.3
Vertical flow 0.4
Fully turbulent flow 0.5
Non-pressure compensating
Fully non-pressure compensating
Mostly turbulent flow 0.6
0.7
Mostly laminar flow 0.8
0.9
Fully laminar flow 1.0
Manufacturing coefficient of variation
The coefficient of variation (CV) is defined as the ratio of standard deviations of the discharges (Madramootto, 1988). In the lateral design, emitter flow variation is used as a design criterion. The emitter flow variation comprises hydraulic variation and due to manufacturing variation among the emitters. The latter depends on the quality control in production. The unit to unit variation in the
emitter flow was expressed by the following relationship:
CV = x 100 ……….. (3)
Where: CV: manufacturing coefficient of variation, S: sample standard deviation, and q:
average emission rate of the sample.
Table 3: Micro-irrigation system uniformity classification based on the coefficient of variation Emitter type
Point-source Line source
Cv range Classification Cv range Classification
< 0.05 Excellent < 0.10 Good
0.05 - 0.07 Average 0.10 – 0.20 Average
0.07 - 0.11 Marginal >0.20 Marginal to Unacceptable
0.11 – 0.15 Poor
>0.15 Unacceptable
ASABE Standards EP405.1, 2008R
The standard deviation of emitter flow rate, Sq, (ASABE, 2008R) can be written as:
S=√ − ∑ = ( − ) ………. (4)
The coefficient of manufacture variable measures the
Distribution Uniformity
The distribution uniformity (DU) of water was computed along a lateral for five emitters under pressures range of 0.8, 1.0, 1.2, and 1.4 bar of pressure head. First, the emission from each emitter was calculated for a particular length of lateral using the methodology stated above. Then the average flow was determined for all emitters. After that, the average flow of the lowest quartile was determined and
for a particular product for various lateral lengths, the distribution uniformity was calculated as:
DU=100 ( ) ……… (5)
Where DU = distribution uniformity, %; qm= the average flow rate of the emitters in the lowest quartile, m3/s; and qa= the average flow rate of all emitters under test, m3/s.
Table 4: Micro-irrigation system uniformity classification based on uniformity coefficient
Uniformity coefficient % UC %
Above 90 Excellent
90-80 Good
80-70 Fair
70-60 Poor
Below 60 Unacceptable
ASAE Standards EP 458(1999)
Variability in the flow rate depends on the pressure regime, the manufacturing variance of the emitter and partial emitter clogging.
Emitters Clogging
To estimate the emitter flow rate cans and a stopwatch was used. Nine emitters from each lateral had been chosen to be evaluated by calculating their clogging ratio at the beginning and at the end of the growing season for two seasons. Three emitters at the beginning, three at middle and three at the end of the lateral were tested for flow rate. Clogging ratio was calculated after (El-Berry et al., 2003)
using the following equations:
E = qu / qn * 100………...……….. (6)
CR = (1 - E) 100... (7)
Where
E = the emitter discharge efficiency (%)
qu = emitter discharge, at the end of the growing season (L/h)
qn = emitter discharge, at the beginning of the growing season (L/h)
CR = the emitter clogging ratio (%)
Statistical analysis:
The data were subjected to the analysis of variance (ANOVA) appropriate to the randomized complete block design applied after testing the homogeneity of error variances according to the procedure out- lined by
Dospekhov (1984). The significant differences (LSD) between treatments were compared with the critical difference at 5% probability level.
Results and Discussion Calibration of emitters
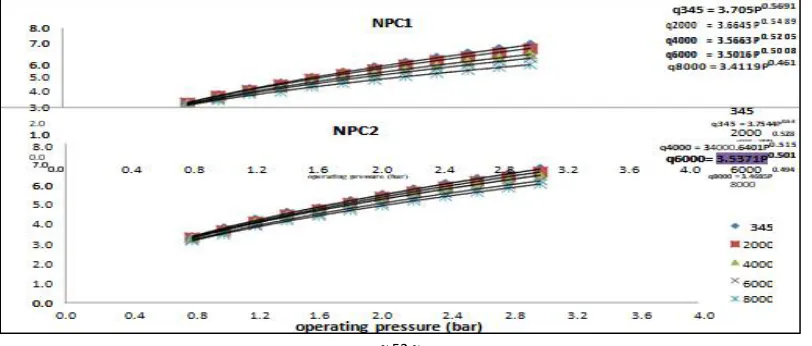
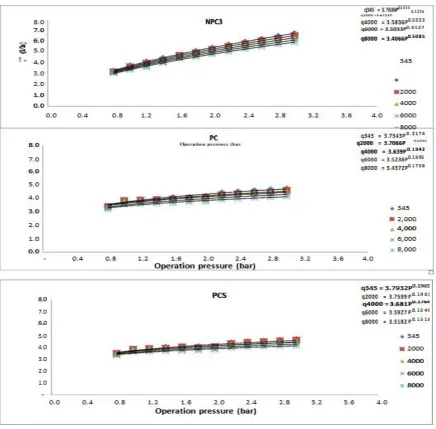
It is known that, in a drip irrigation system, there is a positive relationship between the operating pressure and the emitter flow rate. This relationship may be affected by some changes in the physical properties of water; one of these changes increases the proportion of salt, which exists in low-quality water. Figure (3) illustrates the relation between the emitter flow rates with water salinity and/or operation pressure.
~ 53 ~
Fig. 3: Effect of water salinity on emitters flow rate.
With respect to the water salinity and its effect on the flow rate of the examined emitters, Figure (3) illustrated that PCS and PC were the worthy ones that dramatically decreases their flow rate with increasing water salinity. From the other side, NPC1and NPC3 were the most suitable and moderately affected by water salinity followed by NPC2. The maximum and minimum numbers of the flow rate of the tested emitters were obtained after canal water and 8000 ppm saline water.
From the above mentioned, it is clear to point out that emitter named NPC1followed by NPC2 and lastly NPC3 were not affected strongly by increasing water salinity. Our data was in agreement with those obtained by Almajeed and Alabas (2013), who stated that the main problem is the drop in pressures and discharges distribution in the network resulting from the amount of pressure losses between the head of the lateral as compared with that in the end of the lateral, which affects the discharge distribution of emitters and uniformity.
Manufacturing coefficient of variation for testing emitter types:
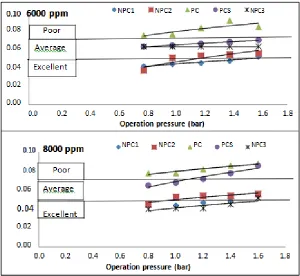
Regarding to the coefficient of variation (CV) as affected by emitter's type and operating pressure, Figure (4) demonstrated that the rank of emitter types can be written
in the following ascending order:
Fig.4: a: Effect of emitter type on the coefficient of variation (CV) under different pressure head.
~ 55 ~
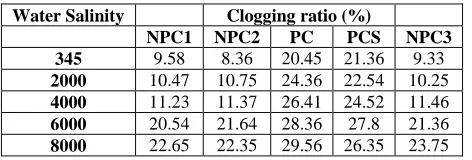
Effect of water salinity on emitter's clogging
In order to study the clogging behavior of emitters of the same discharge rates as influenced by different irrigation water salinity levels on clogging percentage, clogging ratio for emitters are presented in table (5). Clogging of emitters was found to increase with an increase in salinity of the water. In the present study, water used for irrigation was having EC values ranging from 345 to 8000 ppm. In higher EC water, the content of cations viz.Ca and Mg and anions viz. SO4, CO3, and HCO3 were more than the waters with lower salinity. When Ca, Mg and Na combine with SO4, CO3 or HCO3 then some of these combinations form insoluble or sparingly soluble salts cause’s drippers clogging. The composition of deposited salts in lateral also supports this finding. As discussed earlier that there was a positive relationship between uniformity coefficient and clogging percentage. Use of higher salinity water resulted in higher clogging percentage which ultimately leads to
poor uniformity coefficient. Dripper clogging affected distribution uniformity and the system performance which had a direct relationship with water quality and the coefficient of final variation increased with the dripper clogging. The highest clogging ratio was at PC and PCS emitters, so they weren't recommended to use in field experiments. These results were in line with those obtained by Ribera et al., (2004) and Quanli Zong et al., (2015). They stated that the clogging of drip emitters is the largest maintenance problem with drip irrigation systems whilst Capra and Scicolone (2004) reported that water quality is a major concern in the management of trickle irrigation systems. Emitters plugged by physical, chemical, or biological contaminants may create significant problems in everyday maintenance. Therefore, effective and reliable filtration is mandatory for successful operation of trickle irrigation systems (Haman and Zazueta, 2017).
Table 5: The effect of different emitter types and saline water on clogging percent
Water Salinity Clogging ratio (%)
NPC1 NPC2 PC PCS NPC3
345 9.58 8.36 20.45 21.36 9.33
2000 10.47 10.75 24.36 22.54 10.25 4000 11.23 11.37 26.41 24.52 11.46 6000 20.54 21.64 28.36 27.8 21.36 8000 22.65 22.35 29.56 26.35 23.75
References
1. Almajeed M. A. and A. Alabas 2013. Evaluation the Hydraulic Performance of Drip Irrigation System with Multi Cases Global Journal of Researches in Engineering General Engineering 13 (2) Version 1.0 Year 2013
2. Amosson, S.H., L.New, L.Almas, F.Bertz, and T. Marek, 2002. Economics of irrigation systems. Publication B-6113, Texas Cooperation Extension, The Texas A&M Univ. Sys., 20 Pages.
3. ASABE. ASABE Standards. 50th Ed. 2008R. EP 405.
Design and installation of micro irrigation systems. St. Joseph, Mich,: ASABE.
4. ASAE (1985). Design, installation and performance evaluation of trickle irrigation system.
5. Sent Josph, 37th Edition, ASAE Publications, EP 405.1.
6. ASAE Standards EP 458(1999). Field evaluation of micro irrigation systems. St Joseph, Michigan, pages 918-924.
7. Bozkurt S. and B. Ozekici, 2006. The effect of fertigation managements on clogging of inline emitters. J. Appl. Sci., 6(15):3026-3034.
8. Capra, A. and B. Scicolone, 2004. Emitter and filter tests for wastewater reuse by drip irrigation. Agric. Water Manage. 68: 135-149.
9. Cuenca, R.H. 1989. Irrigation System Design: An Engineering Approach, Englewood
10. Cliffs, N.J. Prentice-Hall: 317-350.
11. Dehghanisanij H., T. Yamamoto, M. Agassi, M. Inoue and H Anyoji 2004. Interaction of Soil Water Content and Soil Solute Salinity under Drip Irrigation in Dune Field. American Society of Agricultural and Biological Engineers,
St. Joseph, Michigan www.asabe.org. (doi:
10.13031/2013.16195)
12. Dospekhov, B.A., Field experimentation. Statistical procedures. Mir Publishers, Moscow.(1984).
13. Haman D. Z. and F. S. Zazueta, 2017. Screen Filters in Trickle Irrigation Systems, Publication #AE61 (http://edis.ifas.ufl.edu/wi009) this document is AE61, one of a series of the Department of Agricultural and
Biological Engineering, UF/IFAS Extension.
Reviewed August 2017.
14. Keller, J and D. Karmeli, (1975). Trickle irrigation design. 1ST. Ed., Rain Bird Co, Glentoria, CA 133pp. 15. Keller, J. and R.D. Bliesner, 1990. Sprinkle and
Trickle Irrigation. Chapman & Hall, 115 Fifth Avenue, New York, NY 10003, USA.
16. Madramotto, C.A.(1988) Effect of pressure changes characteristics on the discharge characteristics of pressure compensating emitters. J.Agri. Engg. Res. 40: 159-164. Mansour, H.A., Abdel-Hady, M.,Eldardiry, E.I., Bralts, V.F. (2015 b). Performance of automatic control different localized irrigation systems and lateral lengths for Emitters clogging and maize (Zea mays L.) growth and yield. International Journal of GEOMATE, 9(2) (Sl. No. 18), pp. 1545-1552.
17. Mansour, H.A.,Abdallah, E.F.,Gaballah,
M.S.,Gyuricza, C. (2015 a). Impact of bubbler discharge and irrigation water quantity on 1-hydraulic performance evaluation and maize biomass yield. International Journal of GEOMATE, Vol. 9, No. 2 (Sl. No. 18), pp. 1538-1544
18. Mansour, H.A.,Abdel-Hady, M., Bralts, V.F.(2016). Performance Automation Controller of Drip Irrigation System and Saline Water for Wheat Yield and Water Productivity in Egypt. Journal of Irrigation and Drainage Engineering, American Societiy of Civil engineering (ASCE), USA. In press.
20. Ribera T.A.P., J.E.S. Paterniani, R.P. Airoldi, Silva da S. and da M.J.M., (2004).The water quality effect in the clogging of emittersand the performance of filters utilized inthe trickle irrigation, Irrigat., 9(2), 136-149, 21. Sanij, H.D., Torabi M. and Mirlatifi M.,Singh H.P.,
Kaushish S.P., KumarAshwani, Murthy T.S. and Samuel Jose C. (2001). Effect of water quality and irrigation management on emitter clogging in Southeast of Iran, Micro irrigation: 1st Ed., 537-545. 22. Solomon, K. H. (1983). "Irrigation unifonnity and
yield theory," PhD thesis, Utah State Univ., Logan, Utah.