Internal imaging of saturated
granular free-surface flows
Nicoletta SanvitalePhD
Department of Civil, Environmental and Architectural Engineering, University of Padova, Italy
Elisabeth T. BowmanPhD, CEng, MICE
Department of Civil and Natural Resources Engineering, University of Canterbury, Christchurch, New Zealand
This paper presents a novel method to investigate the internal behaviour of saturated granular free-surface flows in the context of high-speed movement. Such an approach aims to study the motion of the solids and fluid within the flow in small-scale model flume tests with a view to better understanding debris flows mechanics. Through the employment of a particular solid, liquid and fluorescent dye and the application of an optical technique that relies on precise matching of refractive indices, the arrangement and re-arrangement of the grains within the fluid can be determined by way of planar laser-induced fluorescence. The adopted methodologies, together with the physical and optical properties of the selected fluid and solid phases, are described. The results of a series of experiments performed in a small laboratory flume are presented. The results show the effectiveness of this technique and the reliability of an artificial glass–oil mixture in reproducing the key features of flows composed of natural materials.
Notation
CK-C empirical coefficient CU coefficient of uniformity CZ coefficient of curvature D10 effective grain size D50 mean grain size
D60 particle size for which 60% of the particles
are finer
D90 particle size for which 90% of the particles
are finer
e void ratio
k saturated hydraulic conductivity
SF shape factor
S0 specific surface
c unit weight of the permeant
m dynamic viscosity
1. Introduction
In nature, granular flows include numerous and complex phenomena that can arise as gentle processes such as sediment transport in rivers and dune formation or as rapid and catastrophic events such as rock avalanches. Among these mass movements, debris flows, high-speed gravity-driven landslides consisting of soil, rock and water (Hungr et al., 2001), represent one of the most hazardous due to their unpredictable nature, high mobility and destructive power (Iverson, 1997; Jakob and Hungr, 2005). Understanding the dynamics of debris flows has become a critical concern to engineers, owing to a worldwide increase in human settlement of mountainous regions.
The dynamics of concentrated particle–fluid systems, such as that of debris flows, involve various momentum exchange processes that operate simultaneously. The relative importance of inertial granular collisions, sliding friction between grains, viscous shear and solid–fluid interaction depends on several factors as particle size distribution, solid concentration and shear rate (Campbell, 1990, 2006; Iverson, 1997; Savage and Jeffrey, 1981). Both experimental observation (e.g., Bagnold, 1954; Savage, 1979) and numerical simulation (e.g., Campbell and Brennen, 1985; Savage and Hutter, 1989) of granular flows have been used to widen the understanding of such a phenomenon. More specifically, debris flows have been described using analytical (Egashiraet al., 2001; Iverson and Denlinger, 2001; Iverson et al., 2010; Pitman and Le, 2005; Takahashi, 1991) and numerical models (Denlinger and Iverson, 2001; Pitmanet al., 2003) which need to be calibrated and validated against physical models and/or field observa-tions. In situ measurements are hard to achieve owing to the unpredictable occurrence of catastrophic events and the dangers related to field conditions. Therefore, physical model testing, which allows close control over material properties and boundary conditions, is a useful tool to obtain fundamental observations upon which to base physical rules and to validate mechanistic models.
1994; Okada and Ochiai, 2008; Papaet al., 2004; Parsonset al., 2001; Rombi et al., 2006; Takahashi, 2007; Tognacca and Minor, 2000; Zhou et al., 2009). In such experiments, it is possible to observe the flow only at its margins, usually the top and sides, owing to their high opacity. Experimental evidence shows that the dynamics of the inner part of the flow can be different from that inferred by the external boundary measurements (Armaniniet al., 2005; Schaeferet al., 2010).
In the last few decades several advanced non-invasive methods such as X-ray computed tomography and magnetic resonance imaging (MRI) have been used to view inside, inter alia, highly concentrated granular flows in a rotating drum, vibrated granular beds and hoppers (Baxter et al., 1989; Bonn et al., 2008; Coussotet al., 2003; Michalowski, 1984; Slominskiet al., 2007). However, these techniques require expensive apparatus and complex experimental procedures which preclude their routine use. Another approach involves optical methods which relies on the use of transparent materials by a careful refractive index matching (RIM) of the solid and fluid phase. In geotechnical research, a medium made of crushed glass and a refractive index-matched fluid has been used by Allersma (1982) to study the stress distribution in plane strain problems, and by Konagai et al. (1992) for monitoring soil embankment deformation by way of laser tomography. In recent years the development of imaging techniques such as particle image velocimetry (PIV), particle tracking velocimetry and laser induced fluorescence (LIF), that are suited to the investigation of concentrated particle systems, have renewed interest in the RIM technique. This approach has many advantages over MRI and X-ray techniques since it is reasonably economic, versatile and user-friendly. Wiederseiner et al. (2011) has recently presented a detailed review of this technique with details and procedures that can be found in the technical literature.
The current paper presents a novel approach to investigate the internal mechanics of saturated granular flows, in a free surface condition and in a context of high-speed movement, based on a non-intrusive optical technique using ‘transparent debris’. This method, combining the refractive index matching of transparent solid and fluid (Budwig, 1994) with a planar laser induced fluorescence (PLIF) technique (Fontenot and Vigil, 2002; Montemagno and Gray, 1995; Stohret al., 2003) allows observation of the arrangement and re-arrangement of the grains within the fluid and the evolving behaviour of the flow during motion. Here, the adopted methodology together with the physical and optical properties of the selected fluid and solid phases are described. In particular, the suitability of the artificial mixture to mimic the characteristics of natural materials usually used in laboratory debris flow tests (sand and gravel mixed with water) is examined. The results of a first series of experiments performed in a small laboratory flume show the effectiveness of this technique and the ability of the
artificial glass–oil mixture to reproduce key features of flows composed of natural materials.
2. PLIF technique for granular material When an assembly of transparent particles is immersed in a transparent fluid having the same refractive index, the solid– liquid mixture becomes transparent as the incident light passes straight through their constituents without substantial refrac-tive deviation. The PLIF technique is a non-intrusive optical method that can be used to distinguish the particles from the fluid. This method uses a fluorescent component in the fluid which is excited by a thin laser light sheet with a wavelength tuned to its absorption band. After some time, the order of microseconds, the component de-excites and emits light at a wavelength larger than the excitation wavelength. This light, known as fluorescence, enables the fabric of the particle-fluid system to be observed and recorded in two-dimensional images by an imaging system normal to the fluorescent plane. The specific component excited by the laser light may be either tracer particles or, as for the experiments presented in this paper, a fluorescent dye dissolved in the fluid. This makes the particles within the laser sheet appear dark against a bright background (Figure 1).
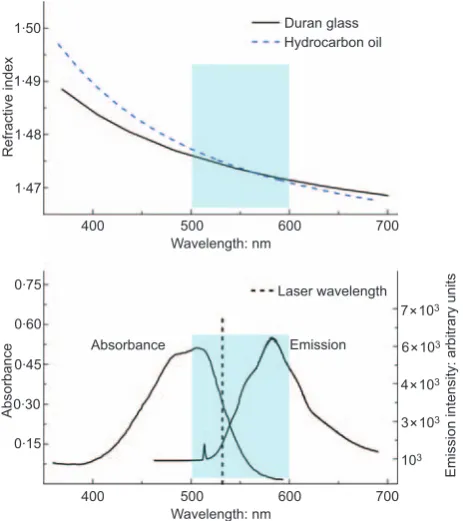
match at the emission wavelength was sought, with a reason-able match at the absorption wavelength. As expected, no considerable distortion of the laser plane was detected. The effects of light scattering owing to a slight mismatch at the absorption wavelength were eliminated with the use of a long pass optical filter on the camera lens, resulting in crisp particle images and no areas of excessive brightness. Given the stress-optical coefficient of the borosilicate glass (461026MPa21)
and low stresses (,1/2 kPa) felt within the medium, little distortion of the refractive index due to stress effects was expected in the experiments.
Although RIM should provide a transparent system, the depth of optical access inside the medium may be reduced by factors such as entrapped air, variations of the refractive index of the liquid caused by temperature sensitivity, imperfections in the solid particles and presence of impurities (Cui and Adrian, 1997; Iskander et al., 2002). A series of simple tests was performed in a glass box to assess the influence of the particle size distribution on the transparency of the mixture. The clarity
attainable using a coarse uniform particle size distribution with CU5D60/D1053 andD50511?5 mm and a well graded one
with CU 5 10 and D50 5 7?1 mm were investigated using
mixtures with a volumetric solid concentration of 0?57 (i.e. porosity 50?43) at room temperature around 19
˚
C. In both cases, the glass particles were deposited inside the box and saturated with the hydrocarbon oil. Before testing, air bubbles were removed by gently stirring the mixture. The images shown in Figure 4 were taken with a high-speed camera set at 200 frames per second (fps) and the laser sheet at two different depths inside the box, 75 mm and 45 mm. When the coarser particles were used, the transparency of the mixture was high and the single grains could be seen in detail, even at the deepest illuminated section. When the system involved finer particles, the clarity of the images degraded with depth. The presence of smaller particles produces a greater amount of scattered light owing to the slight differences in refractive indices at the grain– liquid interfaces. Better optical resolution can be achieved when the laser sheet is placed closer to the outside wall of the container.Tank
Laser Optical fibre 24.5°
Camera view point
focus lens Aluminium
chute
2000 mm
Test slope 2000 mm by 150 mm with transparent sidewall
2400 mm by 700 mm runout area
Flume section
Flow
Focus lens
Optial fibre Laser sheet 2D section of
flowing granular material
Optical filter
[image:3.595.68.541.139.320.2]High-speed camera
Figure 1.Apparatus employed in the test: (left), arrangement of experimental apparatus; (right), schematic layout of PLIF experimental set-up
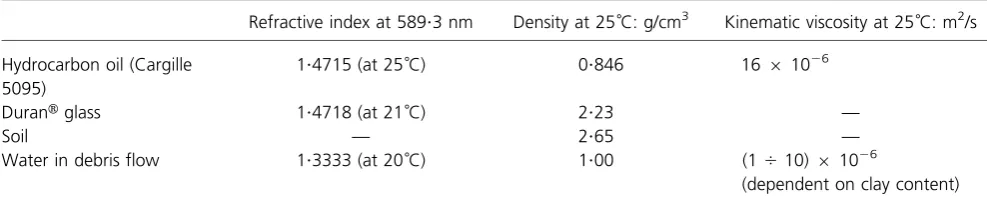
Refractive index at 589?3 nm Density at 25
˚
C: g/cm3 Kinematic viscosity at 25˚
C: m2/sHydrocarbon oil (Cargille 5095)
1?4715 (at 25
˚
C) 0?846 1661026DuranHglass 1?4718 (at 21
˚
C) 2?23 —Soil — 2?65 —
Water in debris flow 1?3333 (at 20
˚
C) 1?00 (1410)61026(dependent on clay content)
[image:3.595.55.549.652.763.2]3. Experimental set-up
3.1 Experimental apparatus
Figure 1 shows the apparatus used for the experimental debris flows. The main device was a small-scale flume with an aluminium tank at the top of the slope. A curved chute guided the flow from the mouth of the tank to the top of the slope, at which point it travelled down a 150 mm wide by 2000 mm long channel before being deposited on a horizontal runout surface. The flume angle could be inclined from 0
˚
to 40˚
. The bottom of the channel was made of stainless steel in the upper part and glass in the lower. The glass bottom was artificially roughened over a length of 1 m with a slip resistant material (3M Safety-Walk 370H) to ensure friction between the bed and the overriding granular flow. The transparent sides were made from poly(methyl methacrylate) except for the lower part, which was made of 1 m long borosilicate glass sidewalls. A SVSi Memview high-speed camera located near the end of the flume recorded the flow behaviour at a rate of 1100 fps with a1.50
1.49
Refractive index
1.48
1.47
400 500
Wavelength: nm 600
Laser wavelength Duran glass Hydrocarbon oil
700
400 500
Wavelength: nm
600 700
0.75
0.60
0.45
Absorbance
Absorbance Emission
7×10³
6×10³
4×10³
3×10³
103
Emission intensity: arbitrary units
[image:4.595.299.540.145.469.2]0.15 0.30
[image:4.595.50.282.148.409.2]Figure 2.The variation of refractive index against wavelength for Duran glass at 21
˚
C (Schott, private communication) and hydrocarbon oil 5095 at 25˚
C (Cargille, private communication) on the top panel. Absorbance and emission spectra of Nile Red in hydrocarbon oil on the bottom panel (the sample concentration is 5 mg/l)Figure 3.Details of the laser light sheet through the assembly of glass particles immersed in hydrocarbon oil
(a)
20 mm
20 mm
20 mm (b)
(c)
[image:4.595.44.286.511.734.2]resolution of 12806256 pixels, corresponding to a resolution of approximately 0?2 mm/pixel in x and y directions. The 3 gigabyte internal memory of the camera enabled a video recording of 5?9 s. A 50 mm focal length Navitar DO-5095 lens designed for low light applications was used. During the tests a Schott OG550 long pass filter with the cut-point at 550 ¡ 6 nm, was placed over the lens to transmit only the fluorescence signal. Prior to testing, the granular material was stored in the tank and manually stirred to ensure that the least possible segregation and consolidation took place and to remove any air bubbles before its release. The pneumatically-operated trapdoor at the exit point of the tank was linked by a micro switch to the camera to ensure a coordinated time-delay between the release of the material and the recording of the flow. The light source was an 800 mW solid state laser operating at 532 nm. The laser beam was coupled from the laser head into an optical fibre, recollimated at the fibre output, and then sent through a line generator lens located beneath the flume. The resulting laser sheet, set parallel to the longitudinal direction of the flume, could illuminate the lower part of the channel passing through the bed by means of a slit cut on the rough material stuck on the glass bottom. The slit was 300 mm long and 1?5–2 mm wide and was placed at a distance of 35 mm from the transparent sidewall – that is, ap-proximately one quarter of the flume width.
3.2 Solid properties
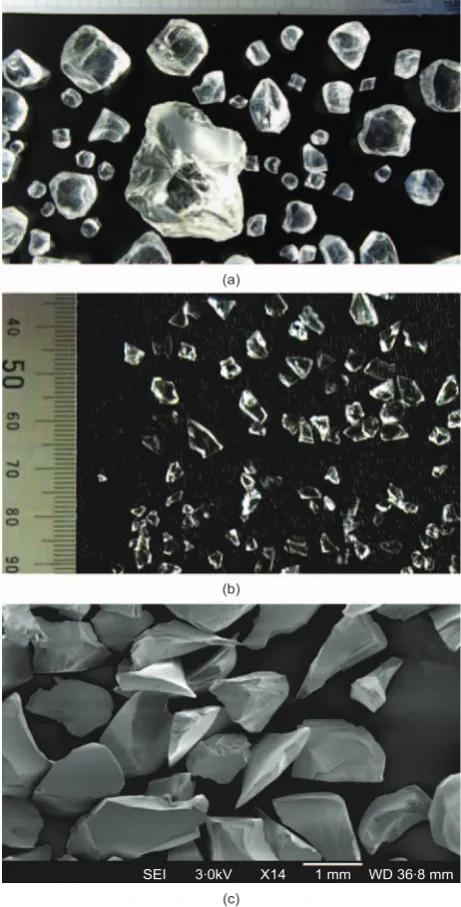
For the purpose of this work, besides being optically compatible, the properties of the adopted solid and fluid were required to compare closely with those of real debris flow materials (Iverson, 1997). The relative densities of the glass and the oil are slightly less than those of soil and water, but the ratio of the densities of the solid and the fluid are the same. Glass particles with irregular shapes were used in order to mimic the friction and rotational resistance between soil grains. Coarse material was produced by cutting cylindrical pieces of glass from rods. These pieces were then shaped to achieve sub-angular and sub-rounded particles. Finer glass particles were obtained by crushing tubing of different wall thickness. The finer particles turned out to be more angular and elongated than the coarser ones, as shown in Figure 5.
Pore-fluid pressure is crucial to debris flow behaviour because it reduces intergranular friction by way of decreased effective stress and therefore enhances the bulk flow mobility. Pore pressure may be greater than hydrostatic within the flow body to the extent that effective stress reduces to zero and ‘liquefaction’ occurs (Iverson, 1997). Therefore the develop-ment and dissipation of high pore pressure needs careful consideration in physical modelling. As the viscosity of hydrocarbon oil is greater than that of water (see Table 1), to ensure that the drainage behaviour of a typical material adopted in a granular flow laboratory test was maintained,
particles were scaled up assuming as the prototype a grain size distribution (PSD11) used in previous research on similar chute flow experiments (Bowman and Sanvitale, 2009), as shown in Figure 6.
The Darcy’s permeability k, more properly referred to as saturated hydraulic conductivity, of any porous material depends on the properties of the permeant, the size of the
(a)
(b)
(c)
[image:5.595.314.545.154.608.2]SEI 3.0kV X14 1 mm WD 36.8 mm
pores and their geometric characteristics. Many theoretical and empirical relationships (Hazen, 1892; Taylor, 1948; Terzaghi, 1925) have been derived that relatekto these properties. Their fundamental formulation may be written as follows (Aubertin et al., 1996)
1. k~fffvfs
where ff, fv, fs factors take into account the influence of the
fluid properties, void space and solid grain surface, respec-tively. Different expressions for these factors can be adopted, but the most widely used are those proposed in the Kozeny– Carman equations (Kozeny, 1927; Carman, 1938, 1956) as
2. ff~
cf m; fv~
e3 1ze; fs~
1
CK-CS20
wherecis the unit weight of the permeant, mis the dynamic viscosity of permeant, e is the void ratio, S0 is the specific
surface and CK-C is an empirical coefficient to take into
account the pore shape and the tortuosity of the flow path. Specific surface is function of grain size and grain shape (Carrier, 2003; Fair and Hatch, 1933; Loudon, 1952; Sperry and Peirce, 1995), so
3. fs~
D2
eff
CK-CSF
whereSF is a shape factor and Deff is a representative grain
dimension.
For the glass–oil combination, the factor ff assumes a value
that is approximately 18 times smaller than that of a soil–water mixture at 25
˚
C; hence according to Equation 1, the hydraulicconductivity should vary in the same way. In order to counteract this, the particle size distribution of the glass was scaled up four times, to give an increase in the hydraulic conductivity by 16 times owing to the increase in pore size, represented by Deff.. This assumption holds as long as the
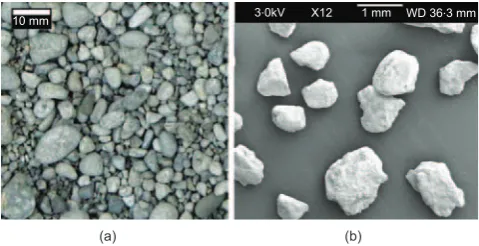
fabric of the model medium is comparable with that of the prototype soil, but because of the way the glass particles were produced and the intrinsic properties of glass, the artificial assembly can never be exactly the same as that of a real soil. Compared to the soil grain prototype particles, the glass particles are more smooth and polished, and are very angular and elongated (Figure 7).
In order to verify the effectiveness of particle scaling in controlling the drainage behaviour, the hydraulic conductivity of the artificial (PSD11-up) and the prototype materials (PSD11) were evaluated using two rigid-wall permeameter tests. A large permeameter with an internal diameter of 22?8 cm was employed for the glass material, while a smaller one, with diameter of 7?6 cm was used for the soil. The tests were performed according to ASTM D 2434-68 (ASTM, 2000) which requires a permeameter to have a diameter from 8 to 12 times the maximum particle size and any particle larger than 19 mm to be separated out from the sample by sieving. The particle size distribution resulting from the glass sample without the oversized grains is shown in Figure 6. For the purpose of creating comparable test conditions, the gradation of the soil sample was also modified, removing particles with size larger than 19/454?75 mm. Hydrocarbon oil and water were used as permeants for the glass and soil assembly, respectively. The preparation of the specimens was similar for both the samples. The material was placed in thin layers of 15–20 mm using subsamples prepared according to the target distribution. Before placing the material inside the permea-meter, the particles were moistened with a small quantity of fluid in order to prevent size segregation. The permeability tests were performed under constant head with a hydraulic
100
80
PSD11-up model
PSD11-up model resized PSD11 prototype
PSD11 prototype resized 60
Percent finer by mass passing: %
40
20
0.01 0.1 1
Particle diameter: mm
[image:6.595.51.278.141.290.2]10 100
Figure 6.Particle size distributions (PSDs) of the materials used in the permeability tests. The model PSD11-up is larger by a factor 4 in comparison with the prototype PSD11
10 mm
(a) (b)
3.0kV X12 1 mm WD 36.3 mm
Figure 7.Soil particles used for the prototype PSD11. Coarse grains (left panel); SEM image of 600mm particles at 126
[image:6.595.299.539.600.723.2]gradient ranging from 0?2 to 0?8 to maintain laminar flow. The results are reported in Table 2 together with the parameters assumed in the calculation of the Kozeny–Carman equation for the particle size distributions. The factorsc,mandewere known, whereas the termsDeff,CK-CandSFwere estimated. CK-Cis usually taken to be equal to 5 for soils (Carrier, 2003).
Assuming the soil consisted of non-uniform spheres,Deffwas
calculated from the particle size distribution (Carrier, 2003; Fair and Hatch, 1933; Sperry and Peirce, 1995) according to
4. Deff~
100% P
fi=Davei
ð Þ
wherefiis the fraction of particles between two sizes (Dliand
Dsi) andDave,iis the average particle size between two sieve sizes (~D0:5
li D0
:5
si ). According to Loudon (1952) the shape factor, SF, was estimated to be 7?8 for the soil and 9 for the glass grains by visual inspection of scanning electron micro-scope images of the particles.
The results confirmed that the hydraulic conductivity of the artificial mixture was similar to that using soil and water and, hence, the adopted particle scaling was appropriate in these terms. Furthermore, the comparison of the predicted and measured values showed the Kozeny–Carman equation to be reliable.
3.3 Test conditions
The flume apparatus was used with a slope angle at 24?5
˚
, typical of a debris flow transition reach (Fannin and Wise, 2001), leading to a flat unconfined runout zone. The laser power set at around 600 mW and the frame rate of the camera at 1100 fps. For all of the tests, a mixture was prepared with 12 kg of glass particles saturated with 3?94 litres of oil for a resulting overall sediment volume concentrationCs50?57 (i.e.porosity50?43). The concentration of the dye in the oil was 2?5 mg/l. Figure 8 shows the particle size distributions (PSD) of the solid used for the experiments. These grain size curves were created to examine the influence of a change in the coefficient of uniformityCUat the particularD50 57?1 mm.
The grading PSD11up with CU 5 10 was used for the
permeability tests. The gradings PSD9up and PSD16up were chosen in order to have a more well graded (CU520?2) and a
uniform material (CU 5 3?3), respectively, in comparison to
PSD11up. For each grading, two experiments were carried out to ensure repeatability of results. Table 3 summarises the main parameters for the tests.
4. Results
4.1 Deposit morphology
In all of the experiments most of the sediment deposited beyond the flume mouth on the deposition area, though some material was also found on the final part of the channel. Figure 9 shows photographs of the typical runout area for each grading while Figure 10 depicts the deposit fans. Figure 10 shows that the deposit morphology was well reproduced for both experiments of each grading. The coefficient of uni-formity has a significant effect on flow mobility, with larger runout observed for largerCU. This behaviour is in agreement
with the findings of previous research carried out by Bowman and Sanvitale (2009) using mixtures of soil and water.
Deff: mm SF c/m: (ms)21 CK-C e kpredicted: m/s kmeasured: m/s
PSD11 model resized 2?19 9 6?136105(at
25
˚
C)5 0?62 1?0761023 1
?4261023
PSD11up prototype resized 0?55 7?8 9?296106(at 18
˚
C)5 0?58 1?1561023 1
?0961023
Deff, effective diameter; SF, shape factor;c, unit weight of the permeant;m, dynamic viscosity of the permeant;CK-Cis an empirical
[image:7.595.316.543.146.287.2]coefficient;e, void ratio;k, permeability value
Table 2.Adopted parameter values in Kozeny–Carman equation
100
PSD9up CU=20.2
CU=9.8
CU=3.3 PSD16up PSD11up 80
Percent finer by mass passing: %
60
40
20
0.1
0.01 1 10
Particle diameter: mm
100 1000
[image:7.595.54.551.642.723.2]The PSD9up experiments exhibited the longest and thinnest deposits. Their thickness was usually less than 20 mm, except where the biggest particles deposited. The large difference in the slope of the flume and the flat runout area led to an accumulation of sediment close to the exit of the flume, where the thickness of the deposit was greatest (30 mm on average). Some material deposited also along the final part of the flume in correspondence to the roughened bed: that is, approximately 1?0 m before the mouth of the channel.
The runout for the tests with PSD11up was shorter and slightly wider than for PSD9up. Again, some minor material deposited in the flume but the deposition started further down, around 0?5 m before the flume exit. The deposit was thicker: in general less than 30 mm, but with a depth around 40–45 mm close to the exit point.
Deposits formed by PSD16up were the shortest. They had a circular shape and thickness greater than those of PSD11up, approximately 35 mm. The deposition started 0?3 m before the end of the flume, but in comparison to the other tests, the layers of sediments found in the flume were thinner. In this case, the accumulation of the material at the flume exit was not present. The thickness of the deposit was larger in the centre of the fan and decreased progressively towards the margins.
Sediment samples at the front margin (edge sample) and at the centre (centre sample) of the deposit on the runout area and in the distal part of the channel (flume sample) were collected after each test to examine the gradation of the material (Figure 11). Segregation of particles was more pronounced for the well-graded mixtures. PSD9up and PSD11up presented morphologic features resembling those of natural and labora-tory debris flow fans (Major, 1997) with coarse particles
accumulating at the front and at the margins of the deposit and fines at the rear.
4.2 Flow features
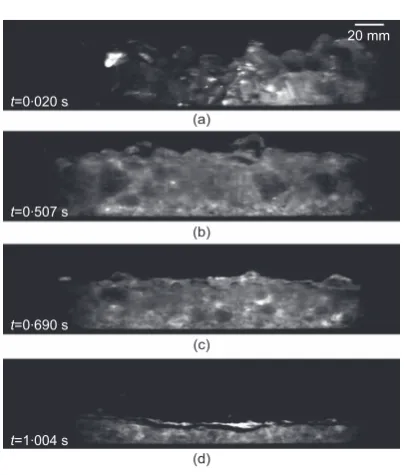
The internal flow dynamics over the illuminated laser section was recorded by the high-speed camera. Figure 12, Figure 13 and Figure 14 show sequences of images for one test of each grading. The flow proceeds from right to left and the camera is tilted at 24?5
˚
so that in the image the flow appears to be horizontal. In the figures, the parts of the flow from (a) to (d) correspond to (a) the arrival of the flow front; (b) immediately after the front; (c) the core of the flow; (d) the tail of the surge. The thickness of the flows immediately after the front (Figure 15) was estimated from the images. In all of the tests, the arrival of the front was preceded by a few tumbling grains; however, as CU increased, faster and thinner flows wereobserved.
The flow behaviour in the runs using the most well graded material (PSD9up) behaved in a similar manner. Figure 12 shows images of the experiment PSD9up-b. The flow was thin and elongated, so that the front and the body had approxi-mately the same height, around 20–30 mm. The thickness at the tail was around 10 mm. The flow segregated during motion with most of the coarse particles concentrating towards the front. Note that, at the front, the material was not saturated and individual particles are visible as illuminated blocks and not as dark spots since the PLIF technique needs full saturation to be effective. This reflects observations of an unsaturated front found in instrumented large-scale flumes and debris flow torrent channels (Iverson, 1997; McArdellet al., 2007). Segregation along the depth was not evident owing to the small thickness of the flow. Nevertheless, a tendency of the coarse particles to position close to the free surface (the line of
Initial conditions Results
Particle size
distribution CU CZ D90: mm D50: mm D10: mm
Number of tests
Volumetric sediment
concentration Runout: mm
Front velocity: m/s
PSD9up 20?2 1?1 35?5 7?1 0?54 2 0?57 94 (a) 2?48 (a)
85 (b) 2?31 (b)
PSD11up 9?8 1?1 28?7 7?1 1?1 2 0?57 70 (a) 2?04 (a)
71 (b) 2?05 (b)
PSD16up 3?3 0?9 17?6 7?1 2?7 2 0?57 60 (a) 1?49 (a)
60 (b) 1?52 (b)
D10andD50, effective and mean grain size;D90, particle size for which 90% of the particles are finer;CZ, coefficient of curvature; CU, coefficient of uniformity
saturation can be seen as a wavy black line) is notable, with coarse grains appearing to float, which has often been observed in field situations (McArdellet al., 2007; Pierson, 1980), see Figure 12(b) and (c). Particles sufficiently large to be distin-guished within the flow exhibited frequent collisions between
each other and the bottom of the channel. The resulting impacts were so strong that the upwards movement after these collisions sometimes made the particles bounce outside the free surface as shown in Figure 16.
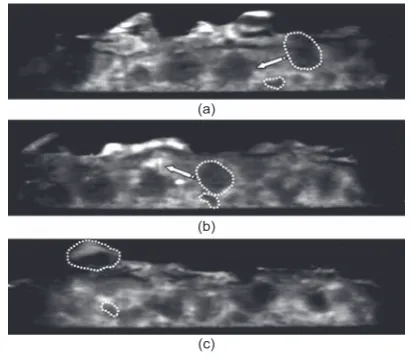
Similar behaviour was exhibited by the granular flows using PSD11up. In Figure 13, images of test PSD11up-a are shown. The thickness of the flow was larger than that of PSD9up-b with the front and body 25–40 mm thick, while the tail was around 10–15 mm thick. Again individual particles are visible
(a)
(b)
[image:9.595.316.543.142.582.2](c)
Figure 9.Photographs of test deposition on the runout area: (a) PSD16up withCU53?3; (b) PSD11up withCU59?8; (c) PSD9up withCU520?2
PSD9up
PSD16up
20 cm Flume
PSD11up
Figure 10.The deposit fans of the performed tests
100
PSD9up source material
PSD9up-a edge
PSD9up-a centre PSD9up-a flume
PSD9up-b edge PSD9up-b centre
PSD9up-b flume 80
Percent finer by mass passing: %
60
40
20
0.1
0.01 1
(a)
(b)
(c)
10 Particle diameter: mm
100
100
PSD11up source material
PSD11up-a edge
PSD11up-a centre PSD11up-a flume
PSD11up-b edge PSD11up-b centre PSD11up-b flume
Percent finer by mass passing: %
60
20
0.1
0.01 1 10
Particle diameter: mm
100
100
PSD16up source material PSD16up-a edge
PSD16up-a centre
PSD16up-a flume PSD16up-b edge
PSD16up-b centre PSD16up-b flume
Percent finer by mass passing: %
60
20
0.1
0.01 1 10
Particle diameter: mm
[image:9.595.102.248.144.496.2]100
[image:9.595.61.290.640.746.2]as illuminated grains in the unsaturated front. Segregation was evident along the length and the depth of the flow, with the coarser particles concentrated towards the head of the surge and dispersed close to the free surface, as shown in Figure 13(b) and (c). Interaction between the grains was evident, but the collisions were fewer and not so strong in comparison to those of PSD9up. The fluctuation movements were restricted to a small area around the grain (Figure 17). t=0.002 s
t=0.486 s
t=0.703 s
t=1.401 s
(a)
(b)
(c)
(d)
[image:10.595.316.520.144.381.2]20 mm
Figure 12.Digital images of the test using PSD9up-b. The flow is proceeding from right to left: (a) during arrival of the flow front; (b) in the core of the flow; (c) in the tail of the flow; (d) at the end of the flow
t=0.020 s
t=0.507 s
t=0.690 s
t=1.004 s
(a)
(b)
(c)
(d)
[image:10.595.63.269.146.383.2]20 mm
Figure 13.Digital images of the test using PSD11up-a. The flow is proceeding from right to left: (a) during arrival of the flow front; (b) in the core of the flow; (c) in the tail of the flow; (d) at the end of the flow
t=0.070 s
t=0.336 s
t=0.453 s
t=0.786 s
(a)
(b)
(c)
(d)
20 mm
Figure 14.Digital images of the test using PSD16up-a. The flow is proceeding from right to left: (a) during arrival of the flow front; (b) in the core of the flow; (c) in the tail of the flow; (d) at the end of the flow
PSD16a PSD16b PSD11a PSD11b PSD9a PSD9b
PSD16 image′s height CU=3.3
CU=3.3
CU=9.8
CU=9.8
CU=20.2
CU=20.2 60
50
40
Flow height: mm 20
10
0
0 0.5 1.0 1.5 2.0 2.5
[image:10.595.64.267.476.714.2]Time: s 30
[image:10.595.305.535.592.723.2]Rather different behaviour was exhibited by the tests using the uniform particle size distribution PSD16up, Figure 14. The flow was very thick with a steep front and a bulky body of over 55 mm. A sudden drop in the height of the flow followed, leading to a tail of around 10 mm thick. In Figure 14(b) and (c), the top of the flow is not visible since the thickness was greater than the image field of view (note the slight truncation above 56 mm in Figure 15). In Figure 14(a) and (b) the quality of the images is not ideal owing to the presence of air bubbles entrapped inside the flow. Moreover, the large thickness and the high concentration of solid particles partially prevented the penetration of the laser sheet through the mixture. By visual inspection of successive images it appears that the grains immediately after the front moved mostly by sliding over one
another with prolonged frictional contacts. These gradually diminished as the flow evolved and the concentration of the particles decreased as shown in Figure 14(c). From here, the quality of the images improved significantly. The grains in the core and in the tail of the flow presented a few weak collisions that were mostly attributable to direct interactions with the bottom of the channel. Particles appeared homogenously distributed, with no particular segregation evident except for the coarsest particles which accumulated at the front.
These preliminary results provide direct visual evidence of how larger particles in well-graded flows ‘focus’ towards the front (Suwa, 1988) as they are shunted upwards into faster moving layers (Sanvitaleet al.,2011) by way of more violent inertial grain collisions, in comparison to smaller particles. The more well-graded a flow, the more segregation can occur, resulting in a more fluidised finer tail. The fluidised tail aids the mobility of the flow on shallower and less confined reaches where it pushes the decelerating frictional front forwards, leading to greater runout overall and the observed elongated and segregated deposit.
5. Conclusions
This paper presents the results of a novel method adopted to analyse the inner behaviour of transparent dense granular flows in a ‘free surface’ condition and characterised by relatively high-speed movements. The approach aims to study the motion of the solids and fluid within the flow in small-scale flume tests with a view to understanding debris flows mechanics. The method is based on refractive index matching of a transparent solid and fluid to make the system transparent, and the use of PLIF to distinguish the solid particles within the fluid. Among the different pairings suitable for this approach, a mixture of borosilicate glass particles and hydrocarbon oil was adopted. Glass particles were shaped in order to resemble those of real soil grains. As the viscosity of hydrocarbon oil is greater than that of water, to ensure that the drainage behaviour typical of materials used in debris flow laboratory tests was maintained, particles were scaled up. Permeability tests were carried out on both the up-scaled and prototype mixtures to verify the appropriateness of such scaling.
A series of experiments was undertaken in a laboratory chute to investigate the effectiveness of this technique and the reliability of the artificial glass–oil mixture in reproducing the key features of debris flows composed of natural materials. Two-dimensional images of vertical sections through the granular flow were captured by a high-speed camera located near the end of the channel. Three different particle size distributions were used: two well-graded and one uniform. The mobility of the tests in terms of runout exhibited behaviour compatible with that observed in similar flume experiments
(a)
(b)
[image:11.595.72.278.144.323.2](c)
Figure 16.Strong grain collision during the test PSD9up-a: (a) before the impact; (b) grain interaction; (c) after the collision
(a)
(b)
(c)
[image:11.595.74.278.560.738.2]using natural mixtures (Bowman and Sanvitale, 2009). The morphologic features of the deposit resembled those typical of debris flow fans, particularly those that used the most well-graded materials. Segregation of the solid particles occurred during the flow and could be observed in images of the tests. The segregation mechanism appeared to chiefly involve inertial particle collisions which were more violent the more well-graded the material and larger the individual particles involved – a process that may result in a more fluidised tail, dominated by finer material and higher mobility.
These results show that the proposed technique is a valuable tool with which insight may be gained into the mechanics of granular–fluid flows. This method proved to be a reasonably economic, versatile and user friendly approach to acquire internal images inside highly concentrated particle–fluid systems. The main drawback of this method was found to be the time-consuming procedure to produce glass particles with irregular shape resembling those of sand and gravel grains. As an extension of the work shown here, the images recorded during the tests are being used to investigate the internal kinematics using a particle image velocimetry approach. Preliminary results are presented in Sanvitaleet al. (2011). A more detailed analysis will be given in a coming paper along with a detailed discussion of scaling laws and comparison to typical flow regimes exhibited by large and small debris flows.
Acknowledgements
The research presented in this paper was supported through the Royal Society of New Zealand under the Marsden Fund grant: ‘Investigation of the internal mechanics of debris flows’. The authors would like to thank Professor R. Genevois (University of Padova) for his support of the research activity. Thanks also go to the laboratory staff Messers John Kooloos, Rob MacGregor, Kevin Wines, Peter McGuigan, Ian Sheppard and Siale Faitotonu of the University of Canterbury for help in construction of the flume apparatus and experimental testing.
REFERENCES
Allersma HGB(1982) Determination of the stress distribution in
assemblies of photoelastic particles. Theoretical and experimental description of the application of the photoelasticity method to three-dimensional assemblies of glass particles.Experimental Mechanics22(9): 336–341.
Armanini A and Gregoretti C(2000) Triggering of debris-flow
by overland flow: A comparison between theoretical and experimental results. InProceedings of the 2nd International Conference on Debris-flow Hazards Mitigation: Mechanics, Prediction and Assessment(Wieczorek G and Naeser ND (eds)). Balkema, Rotterdam, the Netherlands, pp. 117–124.
Armanini A, Capart H, Fraccarollo L and Larcher M(2005)
Rheological stratification in experimental free-surface
flows of granular–liquid mixtures.Journal of Fluid Mechanics532: 269–319.
ASTM(2000) D 2434-68: Standard Test Method for Permeability of Granular Soils (Constant Head). ASTM International, West Conshohocken, PA, USA.
Aubertin M, Bussie`re B and Chapuis RP(1996) Hydraulic
conductivity of homogenized tailings from hard rock mines.Canadian Geotechnical Journal33(3): 470–482.
Bagnold RA(1954) Experiments on a gravity-free dispersion of
large solid spheres in a Newtonian fluid under shear. Proceedings of the Royal Society of London. Series A. Mathematical and Physical Sciences225(1160): 49–63.
Baxter GW, Behringer RP, Fagert T and Johnson GA(1989)
Pattern formation in flowing sand.Physical Review Letters
62(24): 2825–2829.
Bonn D, Rodts S, Groenink M, Rafai S, Shahidzadeh-Bonn N and
Coussot P(2008) Some applications of magnetic resonance
imaging in fluid mechanics: complex flows and complex fluids.Annual Review of Fluid Mechanics40: 209–233.
Bowman ET and Sanvitale N(2009) The role of particle size in
the flow behaviour of saturated granular materials. In Proceedings of the 17th International Conference on Soil Mechanics and Geotechnical Engineering(Hamza M, Shahein M and El-Mossallamy Y (eds)). IOS Press, Amsterdam, the Netherlands, pp. 470–473.
Budwig R(1994) Refractive index matching for liquid flow
investigations.Experiments in Fluids17(5): 350–355.
Campbell CS(1990) Rapid granular flows.Annual Review of
Fluid Mechanics22(1): 57–90.
Campbell CS(2006) Granular material flows – an overview.
Powder Technology162(3): 208–229.
Campbell CS and Brennen CE(1985) Chute flows of granular
material: some computer simulations.Journal of Applied Mechanics52(1): 172–178.
Carman PC(1938) The determination of the specific surface of
powders.Journal of Society of Chemical Industries Transactions57: 225–234.
Carman PC(1956)Flow of Gases through Porous Media.
Butterworths, London, UK.
Carrier DW(2003) Goodbye, Hazen; Hello, Kozeny–Carman.
Journal of Geotechnical and Geoenvironmental Engineering
129(11): 1054–1056.
Chau KT, Chan LCP, Luk ST and Wai WH(2000) Shape of
deposition fan and runout distance of debris-flow: Effects of granular and water contents. InProceedings of the 2nd International Conference on Debris-flow Hazards
Mitigation: Mechanics, Prediction and Assessment
(Wieczorek G and Naeser ND (eds)). Balkema, Rotterdam, the Netherlands, pp. 387–395.
Coussot P, Raynaud J and Ancey C(2003) Combined
Prediction and Assessment(Rickenmann D and Chen C (eds)). Millpress, Davos, Switzerland, pp. 291–301.
Cui MM and Adrian RJ(1997) Refractive index matching and
marking methods for highly concentrated solid–liquid flows.Experiments in Fluids22(3): 261–264.
Denlinger RP and Iverson RM(2001) Flow of variably fluidised
granular masses across three-dimensional terrain. 2. Numerical predictions and experimental tests.Journal of Geophysics Research106(B1): 552–566.
Dutta AK, Kamada K and Ohta K(1996) Spectroscopic studies of
Nile red in organic solvents and polymers.Journal of Photochemistry and Photobiology93(1): 57–64.
Egashira S, Honda N and Itoh T(2001) Experimental study on
the entrainment of bed material into debris flow.Physics and Chemistry of the Earth, Part C: Solar, Terrestrial, and Planetary Science26(9): 645–650.
Fannin RJ and Wise MPW(2001) An empirical-statistical model
for debris flow travel distance.Canadian Geotechnical Journal38(5): 982–994.
Fair GM and Hatch LP(1933) Fundamental factors governing
the streamline flow of water through sand.Journal of the American Water Works Association25(11): 1551–1565.
Fontenot MM and Vigil RD(2002) Pore-scale study of
nonaqueous dissolution in porous media using laser-induced fluorescence.Journal of Colloid and Interface Science247(2): 481–489.
Hassan YA and Dominguez-Ontiveros EE(2008) Flow
visualization in a pebble bed reactor experiment using PIV and refractive index matching techniques.Nuclear Engineering and Design238(11): 3080–3085.
Hazen A(1892) Some physical properties of sands and gravels,
with special reference to their use in filtration. In24th Annual Report of the Massachusetts State Board of Health. State Board of Health, Boston, MA, USA, Pub. Doc. No. 34, pp. 539–556.
Hungr O, Evans SG, Bovis M and Hutchinson JN(2001) Review of
the classification of landslides of the flow type.
Environmental and Engineering GeoscienceVII(3): 221–238.
lskander M, Sadek S and Liu J(2002) Optical measurement of
deformation using transparent silica gel to model sand. International Journal of Physical Modelling in Geotechnics
2(4): 13–26.
Iverson RM(1997) The physics of debris flows.Reviews of
Geophysics35(3): 245–296.
Iverson RM and Denlinger RP(2001) Flow of variably fluidized
granular masses across three-dimensional terrain. Coulomb mixture theory.Journal of Geophysical Research106(B1): 537–552.
Iverson RM, Logan M, LaHusen RG and Berti M(2010) The
perfect debris flow? Aggregated results from 28 large-scale experiments.Journal of Geophysical Research115: F03005.
Jakob M and Hungr O(2005)Debris-flow Hazards and Related
Phenomena. Springer Verlag, New York, NY, USA.
Konagai K, Tamura C, Rangelow P and Matsushima T(1992)
Laser-aided tomography: a tool for visualization of changes in the fabric of granular assemblage.Structural Dynamics and Earthquake Engineering9(3): 193–201.
Kozeny J(1927) Ueber kapillare Leitung des Wassers im
Boden.Wien, Akadademie Wissenschaft136(2a): 271 (in German).
Loudon AG(1952) The computation of permeability from
simple soil tests.Ge´otechnique3(4): 165–183.
Mainali A and Rajaratnam N(1994) Experimental study of debris
flows.Journal of Hydraulic Engineering120(1): 104–123.
Major JJ(1997) Depositional processes in large-scale
debris-flow experiments.Journal of Geology105(3): 345–365.
McArdell BW, Bartelt P and Kowalski J(2007) Field observations
of basal forces and fluid pressure in a debris flow. Geophysical Research Letters34: L07406.
Michalowski RL(1984) Flow of granular material through a
plane hopper.Powder Technology39(1): 29–40.
Montemagno CD and Gray WG(1995) Photoluminescent
volumetric imaging: A technique for the exploration of multiphase flow and transport in porous media. Geophysical Research Letters22(4): 425–428.
Okada Y and Ochiai H(2008) Flow characteristics of 2-phase
granular mass flows from model flume tests.Engineering Geology97(1–2): 1–14.
Papa M, Egashira S and Itoh T(2004) Critical conditions of bed
sediment entrainment due to debris flow.Natural Hazards and Earth System Sciences4(3): 469–474.
Parsons JD, Whipple KX and Simoni A(2001) Laboratory
experiments of the grain-flow, fluid-mud transition in debris flows.Journal of Geology109(4): 427–447.
Pierson TC(1980) Erosion and deposition by debris flows at Mt.
Thomas, North Canterbury, New Zealand.Earth Surface Processes5(3): 227–247.
Pitman EB and Le L(2005) A two-fluid model for avalanche and
debris flows.Philosophical Transactions of the Royal Society A363(1832): 1573–1601.
Pitman EB, Nichita CC, Patra AK, Bauer AC, Bursik M and Weber A
(2003) A model of granular flows over an erodible surface. Discrete Continuum Dynamic Systems B3(4): 589–599.
Rombi J, Pooley EJ and Bowman ET(2006) Factors influencing
granular debris flow behaviour: an experimental investigation. InProceedings of the 6th International Conference on Physical Modelling in Geotechnics(Ng CWW, Wang YH and Zhang LM (eds)). Balkema, Rotterdam, the Netherlands, pp. 379–384.
Sanvitale N, Bowman ET and Genevois R(2011) Experimental
Savage SB(1979) Gravity flow of cohesionless granular materials in chutes and channels.Journal of Fluid Mechanics92(1): 53–96.
Savage SB and Hutter K(1989) The motion of a finite mass of
granular material down a rough inclineJournal of Fluid Mechanics199: 177–215.
Savage SB and Jeffrey DJ(1981) The stress tensor in a granular flow
at high shear rates.Journal of Fluid Mechanics110(1): 255–272.
Schaefer M, Bugnion L, Kern M and Bartelt P(2010) Position
dependent velocity profiles in granular avalanches. Granular Matter12(3): 327–336.
Slominski C, Niedostatkiewicz M and Tejchman J(2007)
Application of particle image velocimetry (PIV) for deformation measurement during granular silo flow. Powder Technology173(1): 1–18.
Sperry JM and Peirce JJ(1995) A model for estimating the
hydrau-lic conductivity of granular material based on grain shape, grain size, and porosity.Ground Water33(6): 892–898.
Stohr M, Roth K and Jahne B(2003) Measurement of 3D
pore-scale flow in index-matched porous media.Experiments in Fluids35(2): 159–166.
Suwa H(1988) Focusing mechanism of large boulders to a
debris-flow front.Japanese Geomorphological Union Transactions9(3): 151–178.
Takahashi T(1991)Debris Flow. IAHR Monograph. Balkema,
Rotterdam, the Netherlands.
Takahashi T(2007)Debris Flow: Mechanics, Prediction and
Countermeasures. Taylor & Francis, Abingdon, UK.
Taylor DW(1948)Fundamentals of Soil Mechanics. Wiley, New
York, NY, USA.
Terzaghi C(1925) Determination of the permeability of clay.
Engineering News Records95(21): 832–836.
Tognacca C and Minor HE(2000) Role of surface tension, fluid
density and fluid viscosity on debris-flow dynamics. In Proceedings of the 2nd International Conference on Debris-flow Hazards Mitigation: Mechanics, Prediction and Assessment(Wieczorek G and Naeser ND (eds)). Balkema, Rotterdam, the Netherlands, pp. 229–235.
Wiederseiner S, Andreini N, Epely-Chauvin G and Ancey C(2011)
Refractive-index and density matching in concentrated particle suspensions: a review.Experiments in Fluids50(5): 1183–1206.
Zhou GD, Law RPH and Ng CWW(2009) The mechanisms of
debris flow: a preliminary study. InProceedings of the 17th International Conference on Soil Mechanics & Geotechnical Engineering(Hamza M, Shahien M and El-Mossallamy Y (eds)). IOS Press, Amsterdam, the Netherlands, pp. 1570– 1573.
WHAT DO YOU THINK?
To discuss this paper, please email up to 500 words to the editor at [email protected]. Your contribution will be forwarded to the author(s) for a reply and, if considered appropriate by the editorial panel, will be published as discussion in a future issue of the journal.