Int. J. Electrochem. Sci., 7 (2012) 10254 - 10265
International Journal of
ELECTROCHEMICAL
SCIENCE
www.electrochemsci.org
Chromium Substituted LiSn
2P
3O
12Solid Electrolyte
R. Norhaniza1, R.H.Y. Subban2, N.S. Mohamed3,*, A.Ahmad4,*
1
Institute of Graduate Studies, University of Malaya, 50603 Kuala Lumpur, Malaysia.
2
Faculty of Applied Sciences, Universiti Teknologi MARA, 40450 Selangor, Malaysia
3
Center for Foundation Studies in Science, University of Malaya, 50603 Kuala Lumpur, Malaysia.
4
School of Chemical Science and Food Technology, Faculty of Science and Technology, Universiti Kebangsaan Malaysia 43600 Bangi Selangor Malaysia.
*
E-mail: [email protected], [email protected]
Received: 25 June 2012 / Accepted: 2 September 2012 / Published: 1 October 2012
This study was focused on enhancing the conductivity of lithium tin phosphate, LiSn2P3O12 by
partially substituting Sn4+ ions with Cr3+ ions to obtain system with general formula Li1+xCrxSn
2-xP3O12. Li1+xCrxSn2-xP3O12 powders with x = 0.2, 0.4, 0.6 and 0.8 were prepared by mechanochemical
milling method. X-ray diffraction analysis indicated that all samples consisted of triclinic crystalline LiSn2P3O12 structure. Energy Dispersive X-ray analysis suggested that Cr3+ was successfully
substituted into the LiSn2P3O12 crystalline structure. Impedance analysis showed an increase in
conductivity with increase in x. The enhancement in bulk conductivity was due to increase in number and polarisability of Li+ ions and crystallinity. The increase in grain boundary conductivity was ascribed to enhancement in Li+ migration as a result of increase in contact between grains. The conductivity versus the reciprocal of temperature plots showed a sudden change in conductivity at 393 K for the sample with x = 0.2 and 373 K for the sample with x = 0.4, 0.6 and 0.8. This was attributed to a structure transition phenomenon. All samples showed Arrhenian behaviour.
Keywords: Tin, Conductivity, Nasicon, Arrhenius, Nanomaterial, Solid Electrolyte
1. INTRODUCTION
Extensive studies on lithium ion conductor with NASICON (Sodium Superionic Conductor) structure have been done because of their possible application in electrochemical devices [1-4]. NASICON has chemical formula LiM2P3O12 (M = Ti, Ge, Sn, Zr, Hf, etc.) with structure built from
MO6 octahedra and PO4 tetrahedra. Their framework is formed by the corner sharing of oxygen of PO4
occupy i.e.: (i) M1 sites located between MO6 octahedral and (ii) M2 sites, located between the ribbons
of PO4 tetrahedra. This 3D structure possesses channels which are also known as bottlenecks that allow
migration of mobile ions. The corner sharing bonding in this framework also allows rotation of the framework; hence modifications like partial substitution may be done to improve its properties [2-4].
In the NASICON family, LiSn2P3O12 has received less attention since their pellets were fragile
and easily broken making them difficult to handle during characterisation [4-7]. This was due to structure transition (monoclinic to rhombohedral structure) which yielded changes in the lattice volume leading to breakage of the pellet. Several works have been done to overcome this problem such as the use of teflon as a binder [6-7] or the use of germanium (Ge) as an agent for completing the reaction to produce LiSn2P3O12 [8]. In our previous study, we have proven that mechanically stable
LiSn2P3O12 pellets could be obtained by preparing this compound using mechanochemical milling
technique without the use of any binding agent [9]. However, the LiSn2P3O12 pellets showed low
conductivities due chemical composition and ionic mobility.
The present study focussed on enhancing the conductivity of LiSn2P3O12 by partially
substituting Sn4+ ions with Cr3+ ions. The effects of partial substitution using Cr3+ on conductivity of NASICON structured compounds have been investigated by several researchers [10-13]. According to Zhao et al [14], partial substitution can be easily carried out if the size of the ion is about the same as that of the ion to be substituted. Since the ionic radius of Cr3+ ion is 0.62 Å while that of Sn4+ ion is 0.65 Å, therefore partial substitution of Sn4+
by Cr3+ is expected to be possible. Xu et al reported on conductivity enhancement of about three orders of magnitude for Cr3+ substituted LiGe2P3O12 system
[10]. Delmas et al [11] reported that the conductivity enhancement in Cr3+ substituted NaZrP3O12 was
due to increase in mobility of ions as reflected by decrease in activation energy. This partial substitutions were done with the objectives of creating Li interstitials to form structures with general formula Li1+xCrxSn2-xP3O12 where Sn4+ ↔ Li+ + Cr3+ [10-14]. The effects of Cr substitution on the
structure and conductivity of LiSn2P3O12 are reported in this article.
2. EXPERIMENTAL
2.1. Materials and Methods
Stoichiometric proportions of Li2O (99 % Aldrich), Cr2O3, SnO2 (98 % Sigma-Aldrich) and
NH4H2PO4 (98 % Sigma-Aldrich) were mixed according to the formula Li1+xCrxSn2-xP3O12 (x = 0.2,
their optimum sintering temperatures and these samples are labelled as C2, C4, C6 and C8 for x = 0.2, 0.4, 0.6 and 0.8 respectively.
Structural study was carried out using Bruker D8 Advance X-Ray Diffractometer. Crystallite size, D was calculated using Scherer equation;
cos
k
D (1)
where k is the Scherer constant value (0.94), λ is the wavelength of the source (Copper-K, λ= 1.5406Å), β is FWHM (in radians) and θ is the Bragg angle (in radians). Surface morphology and elemental composition analyses were done using FEI Quanta 200 FESEM equipment in low vacuum condition and accelerating voltage of 20 kV. For these analyses, samples were gold sputtered after ultrasound cleaning. Conductivity studies were carried out using Solartron 1260 impedance analyser. Transference number was determined using Wagner’s polarisation method on Solartron 1260 interfaced with SI 1287 Electrochemical Interface. The samples were sandwiched between two carbon electrodes and polarised by applying a potential of 0.5 V.
3. RESULTS AND DISCUSSION
3.1. X-ray diffraction (XRD) study
10 15 20 25 30 35 40 45 2 (o)
In
te
n
si
ty
(a
.u
)
C2 C4 C6 C8 Li6P6O18 SnP2O7 SnO2
1
1
-1 -2
0
2
020 02
-1
2
2
-2
0
2
-2
131 -22
3
3
3
[image:3.596.159.438.440.642.2]-2
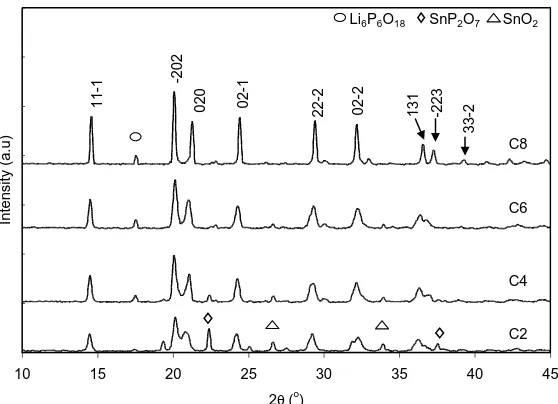
Figure 1. X-ray diffraction patterns for C2, C4, C6 and C8
Fig. 1 shows XRD spectra of samples C2, C4, C6 and C8. Presence of crystalline triclinic LiSn2P3O12 (labelled with hkl index in Fig. 1) was detected in all samples. The values of lattice
constants of this structure for all samples were similar with those reported by Iglesias which were a = 14.680 Å, b = 8.413 Å and c = 8.900 Å [16]. Our studies [9] on unsubstituted LiSn2P3O12 showed
21.487 Å. The change from rhombohedral structure in the unsubstituted LiSn2P3O12 to triclinic
structure in the chromium substituted samples may be due to the presence of interstitial Li+ ions at the mid way sites of M1 and M2 [1,3]. The change in structure may also be attributed to the restructuring of
the lattice atoms in order to accommodate Cr3+ ions which were smaller compared to Sn4+ ions. The adjustment in lattice parameters was due to the expansion of the framework along the a-axis which caused a rotation of tetrahedral PO4 units connecting two parallel columns with a concomitant
[image:4.596.136.446.211.395.2]contraction of the structure along c-axis [17,18].
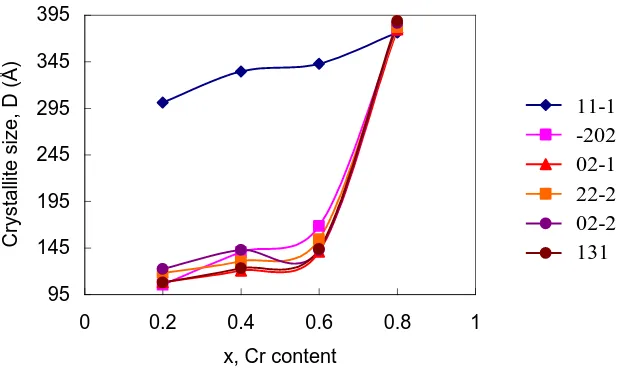
Figure 2. Variation of crystallite size with x (chromium content) at different planes
The peaks of the LiSn2P3O12 triclinic crystalline structure were also observed to become
narrower with increase in Cr3+ content showing that Cr substitution controlled the number of nucleation centres resulting in the formation of larger crystallites [19]. Increase in XRD intensity with x value was due to the growth of LiSn2P3O12 structure [10, 20]. In order to determine the crystallite
size, Scherer equation was used and the values of crystallite sizes for LiSn2P3O12 are shown in Fig. 2.
C8 possessed the largest crystallite size in the range 37 to 38 nm while C2, C4 and C6 possessed crystallites in the range from 11 to 30 nm, 12 to 33 nm and 14 to 34 nm, respectively. This inferred that samples were nanomaterials. Fig. 2 also shows that the crystallite size in C8 was homogeneous while those in other samples were quite heterogeneous. Traces of SnP2O7 crystalline indicated by the
peak at 2θ ~ 23 º was found to be present in all samples. However, the amount of SnP2O7 decreased
with increase in x. Meanwhile, trace of Li6P6O18 was also found to be present in C4, C6 and C8 as
indicated by the presence of the peak at 2θ ~ 17.5 º.
3.2. Scanning Electron Microscopy (SEM)
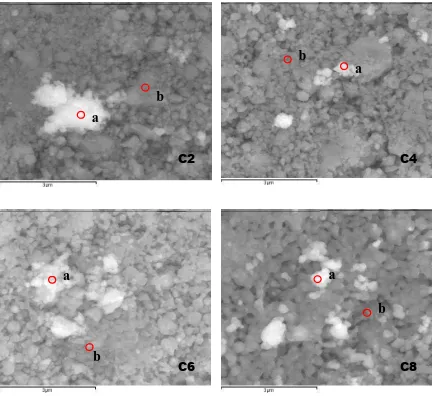
Fig. 3 illustrates the SEM micrograph for the cross-sections of C2, C4, C6 and C8. Average grains size in the samples increased with Cr content which were 0.12 µm, 0.45 µm, 0.49 µm and 0.67 µm for C2, C4, C6 and C8 respectively. A notable difference in the grain size was observed in C2.
95 145 195 245 295 345 395
0 0.2 0.4 0.6 0.8 1
x, Cr content
Cr
y
s
tal
lite
s
iz
e,
D (
Å
)
D11-1 D-202 D02-1 D22-2 D02-2 D131 D
[image:5.596.82.517.147.543.2]
Decrease in number of large grains was seen in C4. Increase in number of grains with similar size and also contacts between grains were noticed in C6 while C8 exhibited very dense and well-packed structure with fewer pores. Uniform grains that fused together were also observed in this sample.
Figure 3. SEM images of Li1+xCrxSn2-xP3O12 samples
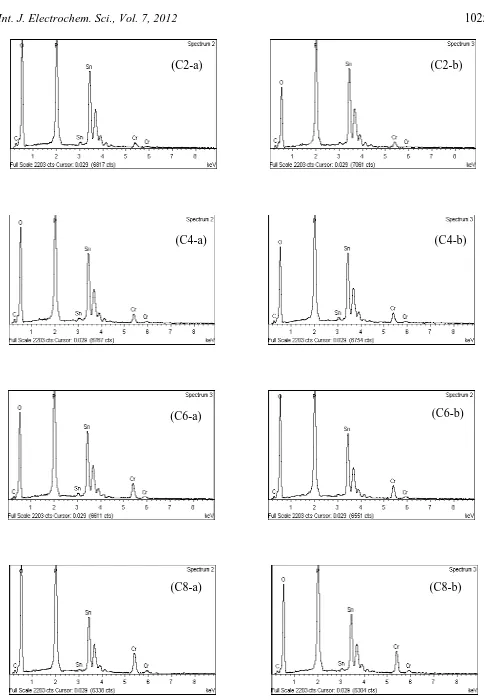
3.3. Energy Dispersive X-ray Spectroscopy (EDX)
EDX analysis was done at different points (a and b indicated in Fig. 3) to confirm stoichiometric proportions of the samples and the EDX backscattered spectra are shown in Fig. 4. Table 1 lists the atomic percentage at both points a and b in Fig. 3. Since Li+ ion was not detectable by EDX, the concept of charge neutrality was employed [20-21]. Using this concept, it was found that the stoichiometries of the samples were in good agreement with the designated values. Thus EDX analysis indicated that Cr3+ was successfully substituted into LiSn2P3O12 matrix forming Li1+xCrxSn2-xP3O12
compounds.
a
b
C8
a
b
C4
a
b
C2
b
a
Figure 4. EDX spectra at both points a and b for all samples
(C4-a) (C4-b)
(C2-a) (C2-b)
(C8-a) (C8-b)
Table 1. Atomic percentage of elements at points a and b for all samples
Sample Composition Elements (Atomic %) Stoichiometric ratio Cr : Sn : P
Cr Sn P
C2
starting mixture 4 36 60 0.2 : 1.8 : 3.0
EDX analysis
C2-a 3.56 35.54 60.90 0.17 : 1.75 : 3.00 C2-b 4.15 36.35 59.50 0.21 : 1.83 : 3.00
C4
starting mixture 7.98 32.02 60.00 0.4 : 1.6 : 3.0 EDX
analysis
C4-a 7.26 32.20 60.54 0.36 : 1.60 : 3.00 C4-b 7.55 32.17 60.28 0.38 : 1.60 : 3.00
C6
starting mixture 12.01 28.03 59.96 0.6 : 1.4 : 3.0 EDX
analysis
C6-a 11.46 28.26 60.28 0.57 : 1.41 : 3.00 C6-b 11.94 27.92 60.14 0.60 : 1.39 : 3.00
C8
starting mixture 16.00 24.00 60.00 0.8 : 1.2 : 3.0 EDX
analysis
C8-a 15.45 23.66 60.89 0.76 : 1.17 : 3.00 C8-b 15.86 23.71 60.43 0.79 : 1.18 : 3.00
3.4. Bulk Conductivity
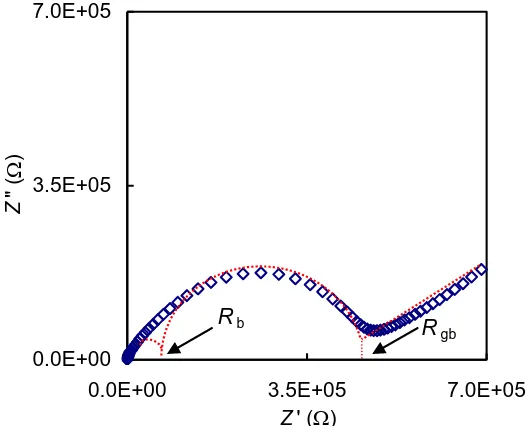
Impedance plot (Z plot) for the sample with x = 0.2 is presented in Fig. 5. The plot shows the presence of overlapping semicircles and an arc. The values of bulk resistance (Rb) was determined
from the intercept of the high frequency semicircle with the Z’-axis. The bulk (σb) conductivity was
calculated using the obtained Rb value and they are listed in Table 2. Since the semicircles in the
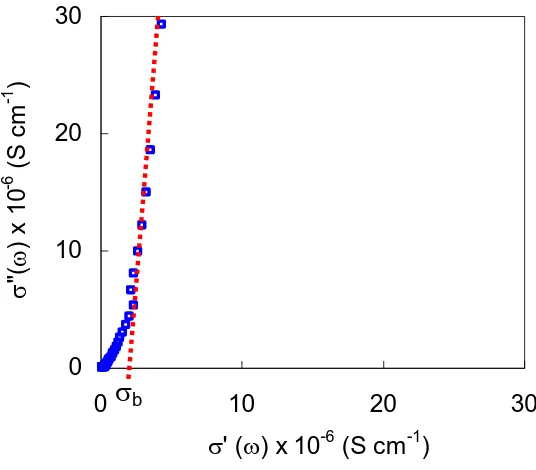
impedance plot were quite difficult to be distinguished, confirmation of the obtained bulk conductivity was done by plotting the conductivity spectrum, σ plot (imaginary conductivity, σ” versus real conductivity, σ’) of the sample. This method has been used by a few groups of researchers [22-26].
0.0E+00 3.5E+05 7.0E+05
0.0E+00 3.5E+05 7.0E+05
Z' (W)
Z
"
(
W
)
Rb R
[image:7.596.165.428.518.731.2]gb
0 10 20 30
0 10 20 30
s' (w) x 10-6 (S cm-1)
s
"(w
) x
1
0
-6 (
S
c
m
-1 )
[image:8.596.161.429.80.315.2]s
bFigure 6. Conductivity plot of C2
The σ” versus σ’ for C2 is depicted in Fig. 6. The figure shows the existence of two linear sections with different gradients (at high frequency region) and a semicircle (at low frequency region). Extrapolation of the first steeper section to σ’ axis gave the value of bulk conductivity. Similar method was used to obtain conductivity for other samples.
1.0E-07 1.0E-06 1.0E-05
0 0.2 0.4 0.6 0.8 1
x
s
(S
c
m
-1 )
bulk
grain boundary
Figure 7. Variation of conductivity with x (chromium content)
It was observed that the values of bulk conductivity obtained from both impedance and conductivity spectra, Table 2, were marginally close to each other hence confirming the values of σb
[image:8.596.159.404.475.673.2]
increased with increase in chromium content. The highest σb and grain boundary conductivity, σgb were
observed for C8 with values of 5.62 × 10⁻⁶
S cm-1 and 1.44 × 10⁻⁶ S cm-1 respectively. This means that C8 showed an increase of three times of σb and about one order of magnitude of σgb of the
unsubstituted LiSn2P3O12 which were 1.65 × 10⁻⁶ and 1.05 ×10⁻⁷ S cm-1, respectively [9].
The increase in conductivity with chromium content may be due to increase in the number of interstitial Li+ ions due to increase in the amount of Cr3+ ions [13]. Another factor that contributed to bulk conductivity enhancement was the increase in crystallinity which was the conducting structure in the compounds [13,19].
According to Semanate et al [20], the higher the structural order, the lower the energy barriers for ions to overcome in order to move. The enhancement in grain boundary conductivity was also attributable to improvement in contact between grains due to increase in homogeneity of grains as discussed in section 3.2. Semanate et al [20] also reported that similar grain sizes resulted in increase in the interfacial areas between grains. This increased the contact between grains which in turn increased conduction path and hence enhancing both bulk and grain boundary conductivities. Similar observations have reported by Best et al [2,27] and Mei et al [28].
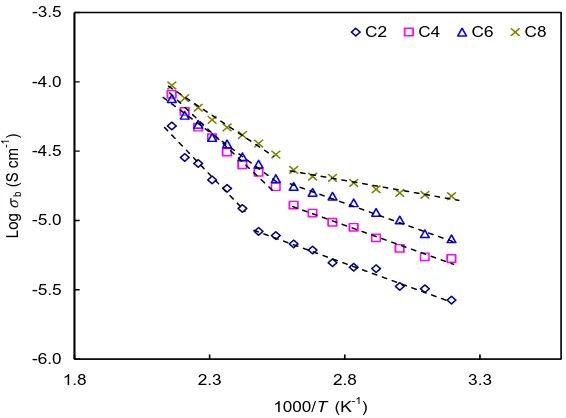
The variations of conductivity with temperature for all samples are depicted in Fig. 8. For C2, σb showed two linear regions with different slopes with a sudden change in slope at 393 K. The linear
regions showed that temperature dependent conductivity was thermally activated indicating Arrhenius behaviour [29-31]. The same trend was observed for other samples. However, the sudden change in slope was observed at 373 K. The bulk activation energy, Ea,b values are tabulated in Table 2. All
samples showed similar Ea,b values at low temperature (low T) and high temperature (high T) regions.
However the Ea,b in high T was lower than low T suggesting that there were two different diffusion
[image:9.596.150.433.492.701.2]channel [20,31].
Figure 8. Temperature dependence of conductivity for Li1+xCrxSn2-xP3O12 samples
-6.0 -5.5 -5.0 -4.5 -4.0 -3.5
1.8 2.3 2.8 3.3 1000/T (K-1)
Log
sb
(
S
c
m
-1 )
This was associated with a structure transition phenomenon from triclinic to rhombohedral structure [32]. Such structural transition occurred due to redistribution of Li+ ions. Losilla and co-workers [4] described that low temperature triclinic structure had low symmetry with ordered Li+ ions distribution. The structure had several bottleneck positions with a narrow probability for the Li+ ions to conduct. As temperature increased, Li+ bonds became loose making it free to move and became randomly distributed. At the same time, the torsion on PO4 tetrahedra takes place due to the
frameworks accommodating themselves without breaking their bonds [17]. As a result PO4 tetrahedra
rotated around two fold symmetry while SnO6 octahedra rotated in the opposite direction to its
direction of rotation at low temperature forming restructured frameworks [33]. These restructured frameworks possessed a more appropriate bottleneck arrangement for the hopping of Li+ ions to take place. According to Kolher and Schulz [34], with increasing temperature, the bottleneck size increased hence ideally for diffusion of Li+ ion. As such, the probability of the Li+ ions to move increased causing redistribution of Li+ ions into lattice sites. This redistribution of lithium ions gave rise to a formation of a new structure (rhombohedral) which was a more conducting structure.
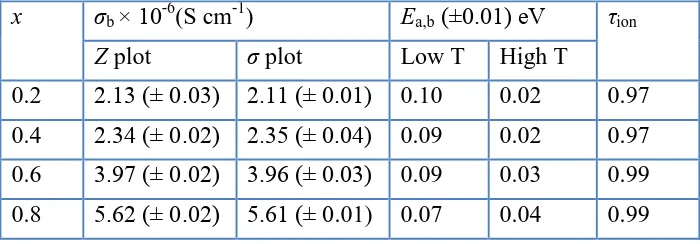
Table 2. Comparison of bulk conductivity values of Li1+xCrxSn2-xP3O12 samples obtained from
impedance and conductivity plots together with activation energy and transference number values.
x σb × 10-6(S cm-1) Ea,b (±0.01) eV τion
Z plot σ plot Low T High T
0.2 2.13 (± 0.03) 2.11 (± 0.01) 0.10 0.02 0.97 0.4 2.34 (± 0.02) 2.35 (± 0.04) 0.09 0.02 0.97 0.6 3.97 (± 0.02) 3.96 (± 0.03) 0.09 0.03 0.99 0.8 5.62 (± 0.02) 5.61 (± 0.01) 0.07 0.04 0.99
The values of Ea,b also indicated that mobility of ions was not varied. As such, the increase in
conductivity may be due to increase in polarisability of Cr ions and possible disorder of occupancy of vacant sites. Similar observation has been reported by Chowdari et al [29]. While Sugantha and Varadaraju [30] reported that the larger the polarisability of cation-oxygen bond, the easier the transport of ions through the bottleneck. Therefore it can be summarised that increase in Cr3+ ions, increased the ion transportation which resulted in an increase in conductivity.
3.5.Transference Number Measurement
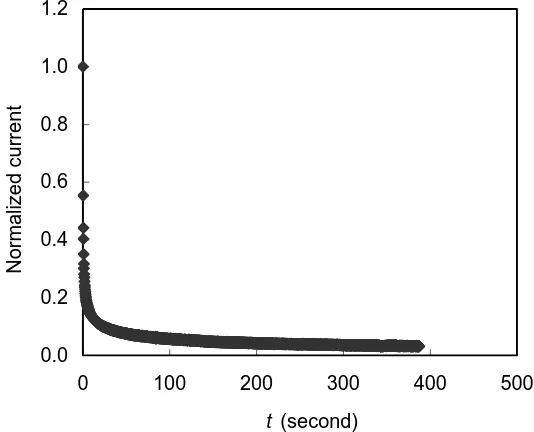
Fig. 9 shows a typical plot of normalized polarisation current versus time for Li1+xCrxSn2-xP3O12
[image:10.596.123.473.391.513.2]
Figure 9. Typical plot of normalized polarisation current versus time for Li1+xCrxSn2-xP3O12 system
4. CONCLUSIONS
Structural studies showed increase in crystallinity and homogeneity of the Cr substituted LiSn2P3O12 with increase in Cr content. EDX analysis indicated that Cr was successfully substituted at
Sn sites in LiSn2P3O12 matrix. This was supported by the XRD results that showed changes in lattice
constants as compared to the unsubstituted LiSn2P3O12. SEM results showed increase in contact
between grains due to grain with similar size when Cr is substituted into the parent compound. The substitution also resulted in conductivity enhancement up to to the order of 10-6 S cm-1. Temperature dependent conductivity studies showed change in crystallography structure as reflected by different Ea,b values for high and low temperatures ranges. The enhancement in bulk conductivity with Cr
content was attributed to increase in crystallinity and homogeneity of LiSn2P3O12 structure. Other
factors of this enhancement were increase in number and polarisability of Li+ ions. The enhancement in both conductivities were also due to increase in Li+ migration as a result of increase in contact between grains.
References
1. J.Sanz, J.M. Rojo, R. Jimenez and J.E. Inglesias, Solid State Ionics, 62 (1993) 287. 2. A.S. Best, M. Forsyth and D.R. MacFarlane, Solid State Ionics, 136-137 (2000) 339.
3. K. Arbi, J.M. Rojo and J. Sanz. Journal of The European Ceramic Society, 27 (2007) 4215. 4. E.R. Losilla, M.A.G. Aranda, M.M. Lara and S. Bruque, Chem. Mater., 9 (1997) 1678. 5. J.M. Winand, A. Rulmont and P. Tarte, J. Solid State Chem., 93 (1991) 341.
6. A.M. Juarez, R. Jimenez. P.D. Martin, J. Ibanez and J.M. Rojo, J. Phys. Condensed Matter, 9 (1997) 4119.
7. M.G. Lazarraga, J. Ibañez, M. Tabellout and J.M. Rojo, Compos. Sci. Technol., 64 (2004) 5759. 0.0
0.2 0.4 0.6 0.8 1.0 1.2
0 100 200 300 400 500
t (second)
Nor
ma
liz
ed
c
urr
en
t
8. J. Angenault, J.C. Couturier, J.P. Souron, D. Siliqi and M. Quarton, J. Mater. Sci. Lett., 11 (1992) 1705.
9. R. Norhaniza, R.H.Y. Subban and N.S. Mohamed, Adv. Mater. Res., 129-131 (2010) 338. 10.X. Xu, Z. Wen, Z. Gu, X. Xu and Z. Lin, Electrochem. Commun., 6 (2004) 1233.
11.C. Delmas, J.C. Viala, R. Olazcuaga, G.L. Flem and P. Hagenmuller, Mater. Res. Bull., 16 (1981) 83.
12.S.E. Sigaryov, Mater. Sci. Engin.: B, 13 (1992) 117.
13.X. Xu, Z. Wen, Z. Gu, X. Xu and Z. Lin, Electrochem. Commun., 6 (2004) 1233. 14.W. Zhao, L. Chen and R. Xue, Solid State Ionics, 70/71 (1994) 144.
15.R. Norhaniza, R.H.Y. Subban and N.S. Mohamed, J. Mater. Sci., 46 (2011) 24 7815. 16.J.E. Iglesias, J. Sanz, A.M. Juarez and J.M. Rojo, J. Solid State Chem., 130 (1997) 322. 17.J. Alamo, Solid State Ionics, 63-65 (1993) 547.
18.F.J. Berry, N. Costantini and L.E. Smart, Solid State Ionics, 177 (2006) 2889.
19.C.J. Leo, B.V.R. Chowdari, G.V.S. Rao and J.L. Souquet, Mater. Res. Bull, 37 (2002) 1419. 20.J.L.N. Semanate and A.C.M. Rodrigues, Solid State Ionics, 181 (2010) 1197.
21.F. Wu, Y. Liu, R. Chen, S. Chen and G. Wang, J. Power Sources. 189 (2009) 467.
22.A.F. Orliukas, A. Dindune, Z. Kanepe, J. Ronis, B. Bagdonas and A. Kezionis, Electrochem. Acta, 51 (2006) 6194.
23.R. Sobiestianskas, A. Dindune, Z. Kanepe, J. Ronis, A. Kezionis, E. Kazakevicius and A. Orliukas, Mater. Sci. Engin. B, 76 (2000) 184.
24.M. Cretin and P. Fabry, J. European Ceramic Soc., 19 (1999) 2931.
25.M. Godickemeier, B. Michel, A. Orliukas, P. Bohac, K. Sasaki, L. Gauckler, H. Heinrich, P. Schwander, G. Kostorz, H. Hofmann and O. Frei, J. Mater. Res., 9 (1994) 1228.
26.T. Šalkus, A. Kežionis, V. Kazlauskienė, J. Miškinis, A. Dindune, Z. Kanepe, J. Ronis, A.F. Orliukas, Mater.Sci. Engin. B, 172 (2010) 156.
27.A.S. Best, P.J. Newman, D.R. MacFarlane, K.M. Nairn, S. Wong and M. Forsyth, Solid State Ionics, 126 (1999) 191.
28.A. Mei, Q.H. Jiang, Y.H. Lin and C.W. Nan, J. Alloys and Compounds, 486 (2009) 871.
29.B.V.R. Chowdari, K. Radhakrishnan, K.A. Thomas and G.V.L Subba Rao, Mater.Res. Bull., 24 (1989) 2221
30.M. Sugantha and U.V. Varadaraju, Solid State Ionics, 95 (1997) 201. 31.J.M.L Meins, O. Bohnke and G. Courbion, Solid State Ionics, 11 (1998) 67.
32.M.P. Screpel, F. d’Yvoire and E. Bretey, Solid State Chemistry Proceedings of the Second European Conference, (1982) 215.
33.J. Alamo and J.L. Rodrigo, Solid State Ionics, 63-65 (1993) 678 34.H. Kohler and H. Schulz, Mater. Res. Bull., 20 (1985) 1461.