Complexion Formation in PVA/PEO/CuCl
2
Solid
Polymer Electrolyte
Omed Gh. Abdullah
1,*, Dlear R. Saber
1, Luqman O. Hamasalih
21Advanced Materials Research Lab., Department of Physics, School of Science, Faculty of Science and Science Education, University of
Sulaimani, Kurdistan Regional Government, Iraq
2Department of Chemistry, School of Science, University of Sulaimani, Kurdistan Regional Government, Iraq
Copyright © 2015 Horizon Research Publishing All rights reserved.
Abstract
Solid polymer electrolyte films based on polymer blends of poly(vinyl alcohol) (PVA) and poly(ethylene oxide) (PEO), with different concentration of copper (II) chloride (CuCl2) were prepared using casting technique. Optical studies were performed using Fourier transform infrared (FT-IR) and Ultraviolet-visible (UV-Vis) spectroscopy. The optical properties of these films were varied by varying CuCl2 concentration. The results show the absorption edge for electrolyte samples shifts toward a lower energy region by increasing the salt concentration, leading to the band gap reduction. The band gap energy data showed that the incorporation of CuCl2 into the polymeric system causes charge transfer complexes in the blend polymer, which lead to increase in the electrical conductivity, by providing additional charges in the lattice. The PVA/PEO/CuCl2 solid polymer electrolyte films exhibit good UV shielding properties in the wavelength range from 190 to 400 nm.Keywords
Polymer Electrolyte, Polymer Blend, Band Gap, Optical Conductivity1. Introduction
Optical spectroscopy is one of the most powerful techniques to determine the band structure of materials. Currently, there has been considerable interest in the optical spectra because of both the interesting physics involved and potential applications in materials [1-3]. Moreover, the changes in the electronic band structure of the crystal also can be investigated via optical spectroscopy [4-7]. The optimization of devices is largely the results of improvement in material quality. Studying functional material requires the knowledge of the band gap of the material [8].
Polyvinyl alcohol (PVA) polymers have attracted much attention in view of their variety applications in optical devices [9]. PVA is a water soluble polymer which is important from an industrial viewpoint due to the role of the
hydroxyl group and hydrogen bonds. Moreover, PVA is also nontoxic, high dielectric strength, and good charge storage capacity [10]. Some studies reveal that the physical properties of the PVA can be controlled by doping for different applications [11-13]. Polyethylene oxide (PEO) is the most widely utilized interesting material as a result of it is high chemical and thermal stability [14]. PEO is a semicrystalline polymer, possessing both crystalline and amorphous phases at room temperature.
Polymer blending is one of the most important contemporary ways for the development of new polymeric materials, and it is a useful technique for designing materials with a wide variety of properties [15]. Solid polymer electrolytes currently attract a considerable attention due to their exceptional properties, and numerous potential applications such as electrochromic devices, fuel cells, batteries of higher specific energy [16]. In particular, the introducing of inorganic salt into the polymer or polymer blend matrix can improve and modify its optical and electrical properties, due to a strong interface interaction between the organic polymer and an inorganic salt.
Numerous researchers reported in the literatures the preparation and characterization of PVA/PEO blend polymer [17-20], also the effect of different fillers such as: nano-ZnO [21], nano-TiO2 [22], glass-fiber-mat [23], and MnCl2 [24] on physical characterization of the blend of PVA/PEO are investigated and described. The main purpose of this work was to achieve a deeper insight into the fundamental physical properties of PVA/PEO blend films doped with different concentration of CuCl2 salt. The FTIR and UV-Vis spectroscopy was used to investigate the formation of complexions CuCl42−. The results are discussed to find the effect of CuCl2 concentration on the optical characterizations of polyblend PVA/PEO system to get evidence for characterizing the optical functions.
2. Materials and Methods
polymeric electrolyte material; the blend polymer and copper (II) chloride CuCl2 were supplied by Alfa Aesar. All chemicals were used as received without any purification. Equal quantity (0.5 gm) of PVA and PEO (50:50) was dissolved in (20 ml) distilled water separately. The polymer blend is prepared by physical mixing of the two solutions and allowed to stir continuously until a homogeneous viscous liquid was formed. CuCl2 salt was also dissolved in (10 ml) distilled water, the resulting blue-green color solution of CuCl2 was added slowly to the polymer blend solution with different mass fraction (2, 4, 6 and 8 wt%). The resulting solution was cast onto plastic Petri dishes and kept at a room temperature for two weeks for drying process till the solvent gets completely evaporated from the films. Interestingly the color of the solid polymer electrolyte was changed during film formation. The dried films are then peeled off from the Petri dishes and kept in vacuum desiccators until use. The thickness of the produced films was between (0.12-0.14) mm. The FTIR spectrometer (Perkin Elmer LR-64912C) was used for recording the IR spectra in the wavenumber range (400-4000) cm-1, and Ultraviolet-visible absorption spectra were measured in the wavelength region of (190-1100) nm using (Lambda-25) UV-Vis-NIR spectrophotometer.
3. Results and Discussion
The first feature that changed after drying the CuCl2 doped samples was the color of the sample. The PVA/PEO blend polymer film is colorless and transparent for visible light. The color of the PVA/PVO/CuCl2 electrolyte films changed progressively towards light green for 2% CuCl2 and yellow for 4, 6, 8 %CuCl2. These modifications have caused the observed change in the FTIR, and UV-Vis spectroscopy.
The blue-green color of CuCl2 will change to a light green or yellow, by reacting with chloride to form complexions CuCl42−, which indicates that Cl- anions were changed to Cl 2-anions [25].
𝐶𝐶𝐶𝐶𝐶𝐶𝐶𝐶2+ 2𝐶𝐶𝐶𝐶−⇌ (𝐶𝐶𝐶𝐶𝐶𝐶𝐶𝐶4)2−
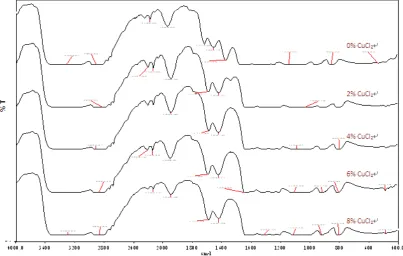
Fig.1 portrays the FTIR spectra of the PVA/PEO blend, and solid polymer electrolyte PVA/PEO/CuCl2 samples in the range (400-4000) cm-1. The IR spectra of PVA/PEO blend are indicated to be consistent with recent previously reported works [14, 17]. The most important bands feature of these samples appears to be C-O-C stretching vibration around 1136 cm-1, and O-H bending vibration at 1328 cm-1, and C=O stretching vibration at 1567 cm-1 and 1712 cm-1. The vibrational bands appeared at 2894, and 3304 cm-1 correspond to υ(CH) and υ(OH), respectively [26,27]. In general, the vibrational bands of PVA/PEO blend shows spectrum characterizing of both PVA and PEO polymer.
[image:2.595.102.506.486.742.2]From Fig.1, it can be seen that there is an increase in the absorption intensity of bands at 1712 cm-1 with increasing the concentration of CuCl2. However, the absorption bands 1567 cm-1 of blend polymer are found to be absent in the electrolyte samples. The frequency shifts were observed in electrolyte systems compared with blend polymer, indicate an insight into the particular interactions between CuCl2 salt with polar groups of the blend polymer. The salt ions can make weak hydrogen bonds with the hydroxyl groups (OH) in the blend polymer chains, so it links the polymer chains together to form a weak cross-linking. Thus, the complex formation between the PVA/PEO blend polymer and CuCl2 salt has been confirmed. Similar type of salt complexed polymer electrolytes for different polymer electrolyte were observed in the literature [28,29].
The UV absorption mainly corresponds to the electron transition from the top of the valence band to the bottom of the conduction band. The UV-vis absorption spectra of blend PVA/PEO and PVA/PEO/CuCl2 solid polymer electrolyte films are recorded at room temperature in the wavelength range (190-1100) nm as shown in Fig.2. The polymer blend does not show appreciable UV absorption, whereas the solid polymer electrolyte exhibit very high absorption in the UV range while the absorption was smaller in the visible range. Consequently, PVA/PEO polymer blend is considered as an optically transparent in the visible region. The spectrum of blend sample exhibited a hump at 290 nm, which is assigned to the existence of carbonyl-groups associated with ethylene unsaturation of the type -(CH=CH)2CO-, and is indicative of the presence of conjugated double bonds [30]. The spectra of solid polymer electrolyte films have an additional band at 668, 845, 869, 872 nm, for 2, 4, 6 and 8 wt% CuCl2 contain, respectively. This new band assigned to Cu-Cl2 chromophoric groups. The absorption intensity of this band increases with increasing CuCl2 wt% content in blend sample.
[image:3.595.314.551.179.311.2]The optical absorption of the polymer electrolyte films in the UV region is high, and this aspect highlights the possibilities of uses of these films in the fields related to the UV protecting. The CuCl2 content improves the UV shielding properties of a solid polymer electrolyte.
Figure 2. UV-vis spectra of PVA/PEO/CuCl2 solid polymer electrolyte.
The fundamental absorption edge is one of the most important features of the absorption spectra, which provides the most valuable optical information available for material identification [31]. The nature of optical transition involved in the blends can be determined on the basis of the dependence of the absorption coefficient (𝛼𝛼) on photon energy (ℎ𝑣𝑣). The absorption coefficient (𝛼𝛼) was calculated from the absorbance (𝐴𝐴) using Lambert Beer's law [16].
𝐼𝐼 = 𝐼𝐼𝑜𝑜𝑒𝑒𝑒𝑒𝑒𝑒(−𝛼𝛼𝛼𝛼) (1) 𝛼𝛼 =2.303𝑑𝑑 𝐶𝐶𝑙𝑙𝑙𝑙 �𝐼𝐼𝑜𝑜
𝐼𝐼� = 2.303
𝑑𝑑 𝐴𝐴 (2) where 𝐼𝐼𝑜𝑜 and 𝐼𝐼 are the intensities of incident and transmitted radiation respectively, 𝛼𝛼 is the thickness of the sample.
Fig.3 shows the plot of absorption coefficient versus photon energy for PVA/PEO blend films and their
electrolyte with different concentration of CuCl2. The values of the absorption edge were calculated by extrapolating the linear portion of the curves to zero absorption value. The values of the absorption edge are listed in Table 1. It was observed clearly that the values of the absorption edge for polymer electrolyte decreased as CuCl2 wt% increases. This indicates the creation of localized states in the band gap as a result of the compositional disorder [32].
Figure 3. Relation between absorbance coefficient (𝛼𝛼) versus (ℎ𝑣𝑣) for PVA/PEO/CuCl2 solid polymer electrolyte.
According to the Tauc relation [33], the absorption coefficient 𝛼𝛼 of band gap material is given by:
𝛼𝛼ℎ𝑣𝑣 = 𝛽𝛽�ℎ𝑣𝑣 − 𝐸𝐸𝑔𝑔�𝛾𝛾 (3) where 𝐸𝐸𝑔𝑔 is the energy band gap, constant 𝛽𝛽 is different for different transitions, and is also a useful diagnostic of the material. ℎ𝑣𝑣 is the energy of photons, and 𝛾𝛾 is an index used to be assumed the values 1/2, 3/2, 2 or 3 depending on the nature of the electronic transition, corresponding to allowed direct, forbidden direct, allowed indirect and forbidden indirect transitions, respectively [34].
According to Tauc's extrapolation, the band gap of a material can be obtained from the extrapolation of the straight line portion of the (𝛼𝛼ℎ𝜈𝜈)1/𝑛𝑛 against ℎ𝑣𝑣 to 𝛼𝛼 = 0.
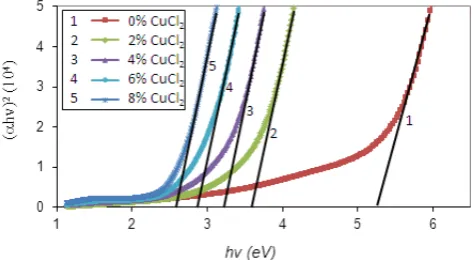
[image:3.595.59.296.396.528.2]The direct band gap values were obtained by plotting (𝛼𝛼ℎ𝜈𝜈)2 versus ℎ𝑣𝑣 curves, as shown in Fig.4. The indirect band gap values were obtained from the plot of (𝛼𝛼ℎ𝜈𝜈)1/2 versus ℎ𝑣𝑣 (see Fig.5). All these values of absorption edge, direct and indirect band gap values are listed in Table 1.
[image:3.595.314.551.592.722.2]Figure 5. Relation between (𝛼𝛼ℎ𝑣𝑣)1/2 versus (ℎ𝑣𝑣) for PVA/PEO/CuCl
2
[image:4.595.56.296.270.365.2]solid polymer electrolyte.
Table 1. The values of the absorption edge and band energy of PVA/PEO/CuCl2 solid polymer electrolyte.
CuCl2 wt% Absorption edge (eV) Direct band gap (eV) Bandgap (eV) Indirect
0 4.53 5.26 3.71
2 2.78 3.59 2.26
4 2.46 3.23 1.93
6 2.12 2.87 1.74
8 1.97 2.58 1.53
The decrease in optical band gap energy by increasing salt content can be explained by the fact that the incorporation of CuCl2 salt forms charge transfer complexes in the polymer matrix. These increases the electrical conductivity by providing additional charges in the lattice [16,35].
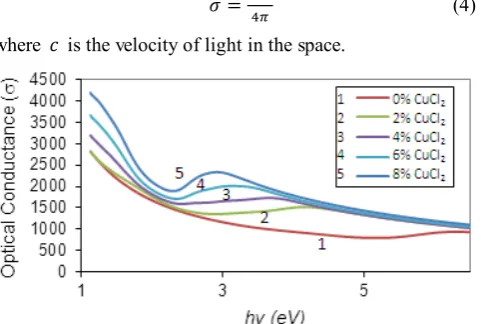
The absorption coefficient 𝛼𝛼, and the refractive index 𝑛𝑛, were used to obtain the optical conductivity (𝜎𝜎), using the relation [36],
𝜎𝜎 =𝛼𝛼𝑛𝑛𝛼𝛼4𝜋𝜋 (4) where 𝑐𝑐 is the velocity of light in the space.
Figure 6. Optical conductivity of PVA/PEO/CuCl2 solid polymer
electrolyte films.
Fig.6 shows the variation of optical conductivity 𝜎𝜎 with the incident photon energy ℎ𝑣𝑣. The optical conductivity increases with increase CuCl2 concentration. The new appearance broad peak in the electrolyte samples, attributed to the formation of the charge transfer as it was expected in absorbance spectra. The conductivity enhancement in polymer electrolyte can be attributed to the reducing the
crystalline phase which provide the conducting pathways for the mobility of ions as well as polymer segments [37]. Thus the observed effect of CuCl2 on the optical conductivity and the conduction behavior of blend polymer films can be explained on the basis of charge transfer complex formation.
4. Conclusions
The solid polymer electrolyte films PVA/PEO/CuCl2 were prepared by a solution casting method, and are characterized by FTIR, UV-Vis spectroscopy. The complexion (𝐶𝐶𝐶𝐶𝐶𝐶𝐶𝐶42−) of the solid polymer electrolytes were confirmed by spectrum analysis. Optical absorption edge and optical band gap (direct and indirect) showed a decreasing trend with increased of CuCl2 salt content, which attributed to formation of the charge transfer complexes with the blend polymer, and decrease in the degree of crystallinity in the polymer blend electrolyte. The polymer electrolyte films are shown to exhibit quite high UV-shielding efficiency of UV radiation in the wavelength range between 190 and 400 nm.
Acknowledgements
The authors are very grateful to the University of Sulaimani, for financial support for this research work.
REFERENCES
[1] K.C. Peng, S.K. Sahu, H.C. Huang, K. Ueno, Y.H Chang, C.H Wang, W.S Hou, Nuclear Instruments and Methods in Physics Research Section A 384, 544-546 (1997).
[2] J.S. Luo, J.M. Olson, Yong Zhang, A. Mascarenhas, Phys. Rev. B 55, 16385-16389 (1997).
[3] S.D. Hart, G.R. Maskaly, B. Temelkuran, P.H. Prideaux, J.D. Joannopoulos, Y. Fink, Science 296, 510-513 (2002). [4] S. Sirohi, T.P. Sharma, Optical Materials 13, 267-269 (1999). [5] F. Zhou, K. Kang, T. Maxisch, G. Ceder, D. Morgan, Solid
State Communications 132, 181-186 (2004).
[6] A.B. Murphy, Solar Energy Materials and Solar Cells 91, 1326-1337 (2007).
[7] N.M. Ahmed, Z. Sauli, U. Hashim, Y. Al-Douri, International Journal of Nanoelectronics and Materials 2, 189-195 (2009). [8] L. Changshi, L. Feng, Optics Communications 285,
2868-2873 (2012).
[9] M. Abdelaziz, M.M. Ghannam, Physica B, 405, 958-964 (2010).
[10] P.B. Bhargav, V.M. Mohan, A.K. Sharma, V.V.R.N. Rao, Curr. Appl. Phys. 9, 165 (2009).
[image:4.595.57.563.453.753.2] [image:4.595.60.301.477.639.2][12] L.Z. Zhang, Y.Y. Wang, C.L. Wang, H. Xiang, Journal of Membrane Science, 308, 198-206 (2008).
[13] M. Abdelaziz, Physica B, 406, 1300-1307 (2011).
[14] K.K. Kumar, M. Ravi, Y. Pavani, S. Bhavani, A.K. Sharma, V.V.R.N. Rao, Physica B, 406, 1706-1712 (2011).
[15] K. Pielichowski, I. Hamerton, Eur Polym J., 36, 171-181 (2000).
[16] O.G. Abdullah, B.K. Aziz, D.M. Salh, Indian Journal of Applied Research, 3, 477-480 (2013).
[17] C. Sawatari, and T. Kondo, Macromolecules, 32, 1949-1955 (1999).
[18] J. Lee, D. Bhattacharyya, A.J. Easteal, J.B. Metson, Current Applied Physics 8, 42-47 (2008).
[19] R. Mishra, K.J Rao, Solid State Ionics 106, 113-127 (1998). [20] F.H. Abd Elkader, N.A. Hakeem, I.S. Elashmawi, A.M.
Ismail, Australian Journal of Basic and Applied Sciences, 7, 608-619 (2013).
[21] Z. Lian, L. Ye, Journal of Thermoplastic Composite Materials, 26, 912-922 (2013).
[22] F.H. Abd Elkader, N.A. Hakeem, I.S. Elashmawi, A.M. Ismail, Indian J. Phys. 87, 983-990 (2013).
[23] C.C. Yang, S.J. Lin, Journal of Power Sources, 112, 497–503 (2002).
[24] I.S. Elashmawi, E.M. Abdelrazek, A.M. Hezma, A. Rajeh, Physics B: Condensed Matter 434, 57-63 (2014).
[25] A.F. Wells, Structural Inorganic Chemistry, Oxford University Press, UK, (2012).
[26] R. Mishra, K.J. Rao, European Polymer Journal, 35, 1883-1894 (1999).
[27] S. Rajendran, M. Sivakumar, R. Subadevi, Solid State Ionics, 167, 335-339 (2004).
[28] Y. Yang, C. Liu, H. Wu, Polymer Testing, 28, 371-377 (2009).
[29] N.J. Elizondo, P.J.A. Sobral, F.C. Menegalli, Carbohydrate Polymers, 75, 592-598 (2009).
[30] M. Abdelaziz, E.M. Abdelrazek, Physica B, 390, 1-9 (2007). [31] R.M. Ahmed, and S.M. El-Bashir, International Journal of
Photoenergy 2011, 1-6 (2011).
[32] O.G. Abdullah, B.K. Aziz, S.A. Hussen, Chemistry and Materials Research, 3, 84-90 (2013).
[33] J. Tauc, Plenum Press, in Amorphous and liquid semiconductor, New York, p. 159 (1974).
[34] O.G. Abdullah, D.A. Tahir, S.S. Ahmad, H.T. Ahmad, IOSR Journal of Applied Physics, 4, 52-57 (2013).
[35] V. Raja, A.K. Sarma, V.V.R.N. Rao, Mater. Lett., 57, 4678-4683 (2003).
[36] R. Das, and S. Pandey, International Journal of Material Science 1, 35-40, (2011).