Int. J. Electrochem. Sci., 8 (2013) 235 - 248
International Journal of
ELECTROCHEMICAL
SCIENCE
www.electrochemsci.org
Dynamic Simulation of PEM Water Electrolysis and
Comparison with Experiments
Bonghwan Lee, Kiwon Park and Hyung-Man Kim
Department of Mechanical Engineering & High Safety Vehicle Core Technology Research Center, INJE University, 607 Eobang-dong, Gimhae-si, Gyongsangnam-do 621-749, Republic of Korea
*
E-mail: [email protected]
Received: 26 November 2012 / Accepted: 12 December 2012 / Published: 1 January 2013
The effects of temperature and flow rate are studied analytically and experimentally to develop a proton exchange membrane (PEM) electrolyzer with satisfactory performance for use in a regenerative fuel cell system. The dynamic interactions in the electrolyzer are simulated with Simulink® to include five ancillaries: anode, cathode, membrane, voltage and storage. To validate the analytical polarization curve, the performance of the PEM electrolyzer has been assessed in terms of power, flow rate and temperature controllers. The four circulating water flow fields in the electrolyzer are experimentally evaluated using a small cell with an active area of 25 cm2. By comparing the analytical and experimental polarization curves at various temperatures, the optimum temperature and flow field for water electrolysis are presented. At the optimum temperature and flow field, the hydrogen and oxygen production rates are obtained for various water flow rates. These analytical and experimental results will be applied to the controls of temperature and flow rate of the PEM electrolyzer for the regenerative fuel cell system.
Keywords: PEM electrolyzer, water electrolysis, flow field, temperature, flow rate
1. INTRODUCTION
11]. To date, most of the research and development on water electrolysis related to renewable hydrogen production projects have focused on alkaline electrolysis systems and PEM electrolyzers. Compared with traditional alkaline electrolysis systems, the need for higher efficiency and flexible operation has prompted the active study of electrocatalysts [12-16], high-pressure operation [17-19], modeling [20-22] and stack development [23-25].
We plan to build a regenerative fuel cell consisting of a PEM electrolyzer and a fuel cell linked with a PV array. Regenerative fuel cells are analogous to rechargeable batteries; however, they have the advantage of being able to continue to function and produce power as long as the reactants are supplied. Hydrogen has been identified as a potential energy carrier and can be applied effectively to the regenerative fuel cell in conjunction with the fluctuating nature of the PV system. Hydrogen can be generated by a range of technologies, such as the reforming of natural gas, liquefied petroleum gas, gasoline, etc.; the gasification of coal and biomass; the electrolysis of water using nuclear, fossil or renewable energy sources; photo-electrochemical and catalytic water-splitting; and thermo-chemical cycles. Water electrolysis is a key technology for hydrogen generation as it is compatible with existing and future power generation technologies. PEM water electrolysis is considered the most favorable approach to hydrogen generation from renewable energy sources [26-29].
In this study, a control-oriented model for PEM water electrolysis was developed based on the mole balance at the anode and the cathode. The model is capable of characterizing PEM electrolyzers and is essential for determining a control strategy that ensures the efficient and reliable operation of the electrolyzer. To validate the analytical polarization curve, the PEM electrolyzer was tested with power, flow rate and temperature controllers. The four flow fields of circulating water in the electrolyzer were experimentally evaluated using a small cell with an active area of 25 cm2. Based on a comparison of the analytical and experimental polarization curves, the optimum temperature and flow rate of water were used to characterize and determine the control strategy of the PEM electrolyzer.
2. DYNAMIC MODEL
The electrolysis of water is the dissociation of water molecules into hydrogen and oxygen. A simple model was developed to explain the current and potential characteristics of electrolysis based on charge and mass balance as well as Butler-Volmer kinetics on the electrode surfaces [30]. A complete dynamic model based on the conservation of the molar balance at the anode and the cathode was developed [29], but it has not been experimentally validated. Predictive models were built using neural-network-based adaptive neuro-fuzzy inference systems for the hydrogen generation rate and PEM electrolyzer system-efficiency [27].
water molar hold-ups. The hydrogen and oxygen reaction rates are calculated as
(1)
[image:3.596.50.553.237.699.2]For PEM electrolyzers, the Faraday efficiency is assumed to be a consequence of an internal current that could be the result of oxygen travel from the anode to the cathode or hydrogen travel from the cathode to the anode and is generally assumed to be over 99% [31].
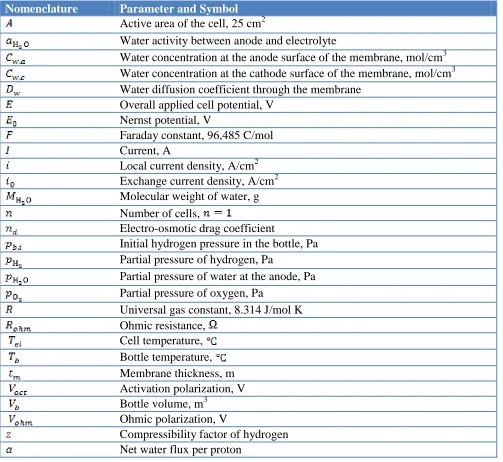
Table 1. Parameters and symbols used in this modeling.
Nomenclature Parameter and Symbol
Active area of the cell, 25 cm2
Water activity between anode and electrolyte
Water concentration at the anode surface of the membrane, mol/cm3 Water concentration at the cathode surface of the membrane, mol/cm3 Water diffusion coefficient through the membrane
Overall applied cell potential, V Nernst potential, V
Faraday constant, 96,485 C/mol Current, A
Local current density, A/cm2 Exchange current density, A/cm2 Molecular weight of water, g Number of cells,
Electro-osmotic drag coefficient
Initial hydrogen pressure in the bottle, Pa Partial pressure of hydrogen, Pa
Partial pressure of water at the anode, Pa Partial pressure of oxygen, Pa
Universal gas constant, 8.314 J/mol K Ohmic resistance,
Cell temperature, Bottle temperature, Membrane thickness, m Activation polarization, V Bottle volume, m3
Ohmic polarization, V
Compressibility factor of hydrogen Net water flux per proton
When protons move through the membrane, water molecules accompany them. This phenomenon is well-known as electro-osmotic drag, and this water transportation is expressed by
(2)
Water diffusion through the membrane is given from Fick’s first law of diffusion as follows:
(3)
The electrolyzer operates in either current mode or voltage mode. When run in voltage mode, voltage is applied to the electrolyzer and, depending on the operating conditions, the electrolyzer draws the current from the source. After a couple of transient cycles, it reaches a steady-state value. However, most of the commercially available electrolyzers run in current mode and the operating voltage of an electrolyzer is given as
(4)
The open circuit voltage defined by the Nernst equation, the activation polarization and the ohmic polarization are, respectively obtained by
(5)
(6)
(7)
The hydrogen and oxygen generated by electrolyzer are stored in bottles. Constant hydrogen and oxygen flow fills up the bottles until their pressure reaches the electrolyzer pressure. The dynamics of the storage are as follows:
(8)
The compressibility factor is a function of the temperature and pressure. It is assumed that the bottle temperature is constant throughout the storing process because the process is slow.
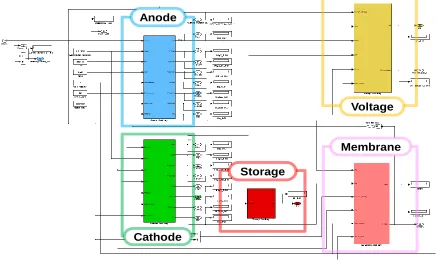
water diffusion and conductivity of the membrane. The anode ancillary dynamically calculates the oxygen and water flows and partial pressures. Similarly, the hydrogen and water partial pressures and their flows are obtained in the cathode subsystem. The storage ancillary shows the storage dynamics of the bottled generated hydrogen by considering the initial hydrogen level therein and the compressibility of hydrogen. A detailed control-oriented model for a PEM electrolyzer was developed based on mole balance and electrochemical reaction at the anode and the cathode, and a Simulink model of the electrolyzer was created, as shown in Fig. 1.
Anode
Cathode
Storage
Voltage
Membrane
Figure 1. Simulink diagram of the five-component dynamic model of the PEM water electrolysis system.
3. EXPERIMENTAL SETUP
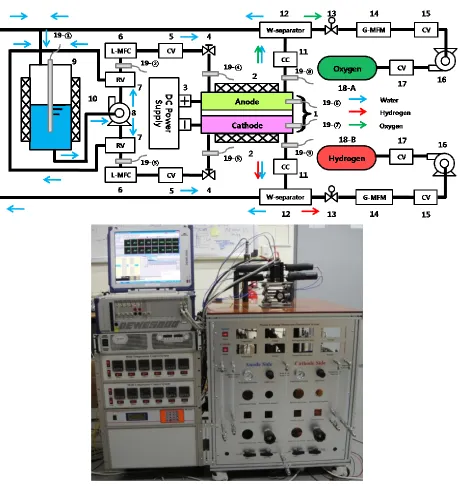
The PEM electrolyzer is set up according to a commonly used PEM fuel cell configuration consisting of a membrane electrode assembly (MEA); gas diffusion layers (GDLs) and bipolar plates (BPs) with flow channels. Fig. 2 shows the schematic diagram (Fig. 2a) and the photograph (Fig. 2b) of the PEM water electrolysis system used in this experiment for control and measurement, which was built at INJE University. This small single-cell electrolyzer was originally designed as a PEM fuel cell with an active area of 25 cm2 [32]. The preparation of the MEA was the same as that of a PEM fuel cell: catalytic electrodes were hot pressed to both surfaces of the membrane. Nafion 115 was used as the PEM. An iridium oxide (IrO2) electrocatalyst was used for the oxygen electrode, and a platinum
[image:5.596.76.514.213.475.2]
of the cathode. The porosity of each GDL was approximately 0.75.
Figure 2. Experimental setup for evaluating the control of temperature and flow rate of a PEM water electrolysis system. (a) Schematic diagram (1-single cell, 2-cartridge heater, 3-DC power supply, 4-one-way valve, 5-check valve, 6-liquid mass flow controller, 7-relief valve, 8-water pump, 9-water tank, 10-electrical heating tape, 11-water separator, 12-pressure regulator, 13-gas mass flow controller, 14-compressor, 15-hydrogen and oxygen tanks, 16-nine thermocouples). (b) Photograph of the control and measurement system built at INJE University.
[image:6.596.71.531.111.597.2][image:7.596.24.575.148.533.2]
for electrolysis. The water flow rate was controlled by liquid mass flow controllers (item 6, mini CORI-FLOW® M14I).
Table 2. Summary of the sensors monitoring and recording all data for the fuel cell test equipment.
Description Source Sensor Range Quantity
Signal Physical
Cell power supply Agilent 8735A; 30 V, 110 A, 3.3 kW
DC voltage 0-5 V 0-30 V 0-110 A
1 Water supply (water
pump)
Laing D5 Vario, 25 LPM, H2O
- - 0-25 LPM 2
Water flow rate (L-MFC)
Bronkhorst Mini Cori Flow Controller, 2 kg/h, H2O
DC voltage 0-5 V 0~2 kg/h 2
Water pressure (RV) OSCAR E292 L, 0.35 MPa - - 005-0.35 MPa 2
Back pressure (Regulator)
Crown GSV1-04B3-4F4TF, 3 MPa
- - 0-3 MPa 2
Water removal (Water separator)
KCC KWS 300-02, 300 l/min - - - 2
Hydrogen flow rate KOFLOC 3660, 20 SLPM, H2
DC voltage 0-5 V 0-20 SLPM 1
Oxygen flow rate KOFLOC 3660, 2 SLPM, O2 DC voltage 0-5 V 0-2 SLPM 1
Gas pressure Autonics PSAN-L1C(P)V, 1 MPa
DC voltage 0-5 V 0-5 V (on/off) 4 Gas Compressor KNF N145 ANE, 30 l/min 7
bar
- - - 2
Gas Storage (Storage tank)
Hansol, 7 bar, 1.4 l - - 0-7 bar 2
Water temperature At water tank PT 100 Ω - - 1
Cell temperature Attached to bipolar plate Type K - - 2
Line temperature At water tube Type K - - 6
and data acquisition system to control the operating conditions continuously. The specifications of each device are listed in Table 2.
(a)
(b)(b)
(c)
(d)
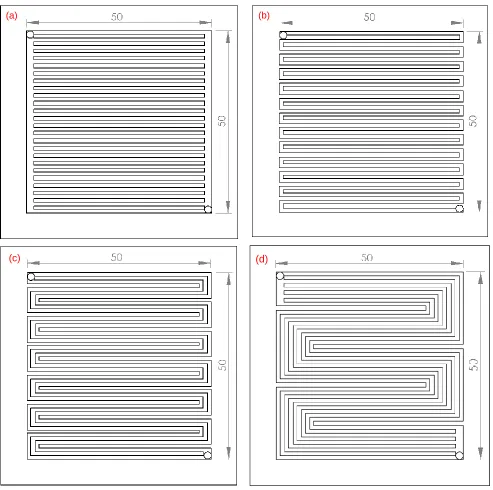
Figure 3. Flow field of the bipolar plate with an active area of 25 cm2: (a) PFF, (b) 1/24 SFF, (c) 2/12 SFF and (d) 5/4 SFF.
[image:8.596.53.546.132.622.2]
all four flow fields, the cross-section of the channel was a 0.01 cm2 square. In the present cell set-up, the flow in the BPs was vertical upward in the parallel flow field and serial repetition of vertical upward and downward in the serpentine flow fields. Using these flow fields, the flow velocity in the channel could be changed dramatically, even when the flow rate was kept constant.
4. RESULTS AND DISCUSSION
4.1 Simulation results for the PEM water electrolysis
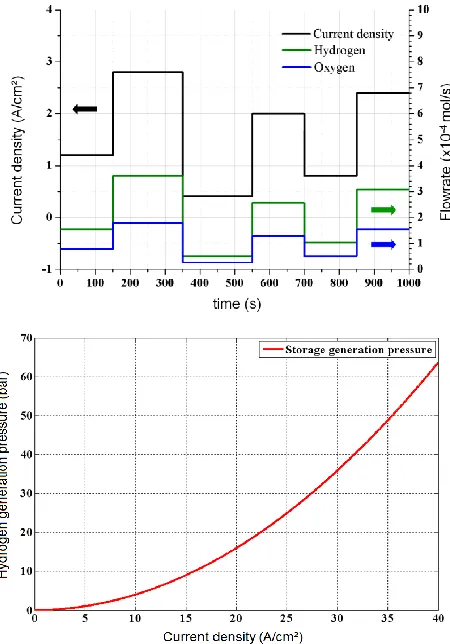
The simulation studies use the same PEM electrolyzer geometry as used in the experiment for comparison purposes. The electrolyzer operating temperature increases from 30 °C to 70 °C in 10 °C increments, and the pressure is fixed at 1 atm. To confirm the transient dynamic behavior of the PEM electrolyzer with the Simulink program (Fig. 1), current density transients are introduced and the responding hydrogen and oxygen partial pressures are presented in Fig. 4a.
[image:9.596.186.411.353.675.2][image:10.596.91.517.291.547.2]
The operating current density is stepped up from 1.2 to 2.8 A/cm2 at t =150 s, stepped down from 2.8 to 0.4 A/cm2 at t = 350 s, stepped up from 0.4 to 2.0 A/cm2 at t =550 s, stepped down from 2.0 to 0.8 A/cm2 at t = 700 s, stepped up from 0.8 to 2.4 A/cm2 at t =850 s and returned to 1.2 A/cm2 at t = 1000 s. The hydrogen and oxygen partial pressures are synchronized with current density transients, and the hydrogen generating flow rate is twice the oxygen generating flow in Eq. (1). The storage ancillary shows the storage dynamics of the generated hydrogen in a bottle by considering its initial hydrogen level and the compressibility of hydrogen. When the current density increases from 0 A/cm2 to 40 A/cm2 at t = 1000 s, the hydrogen storage pressure is calculated using Eq. (8) and hydrogen bottle pressure changes as shown in Fig. 4b. The current flow can be stopped once the hydrogen bottle pressure reaches a specified value for safety purposes. These figures show that the model can capture the transient dynamic behavior of the PEM electrolyzer.
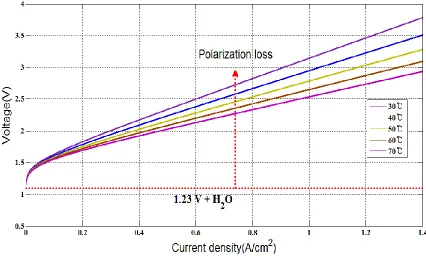
Figure 5. Polarization curves for the PEM electrolyzer at various water temperatures.
starts at = 0 A/cm2, increases non-linearly up to almost = 0.05 A/cm2 and is then approximated as a linear increase. The slope of this linear curve represents the internal electrical resistance of the PEM electrolyzer cell [33].
4.2 Effect of flow field and temperature on the electrolyzer performance
(a) (b)
(c) (d)
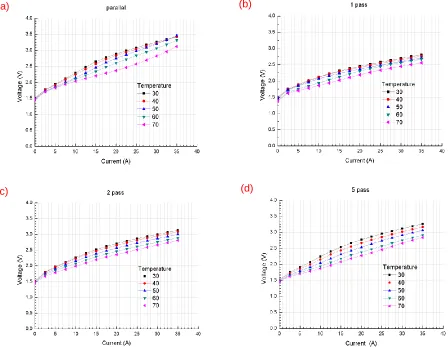
Figure 6. Effect of the flow field on the polarization curve of the PEM electrolyzer at various water temperatures: (a) PFF, (b) 1/24 SFF, (c) 2/12 SFF and (d) 5/4 SFF.
To verify the performance of the PEM electrolyzer, we measured the current density, temperature-dependent voltage change and generated hydrogen and oxygen flow rates. The input current density stops after reaching 1.4 A/cm2 for safety because of potential damage to the MEA. The temperature-dependent voltage and voltage increased as the water temperature increased from 30 to 70 °C. Fig. 6 shows the effect of the flow field on the PEM electrolyzer polarization curves at various temperatures under atmospheric pressure. The electrocatalytic activity increased as a function of temperature due to the activation behavior of the irreversible O2 evolution occurring at the IrO2
[image:11.596.65.513.184.531.2]
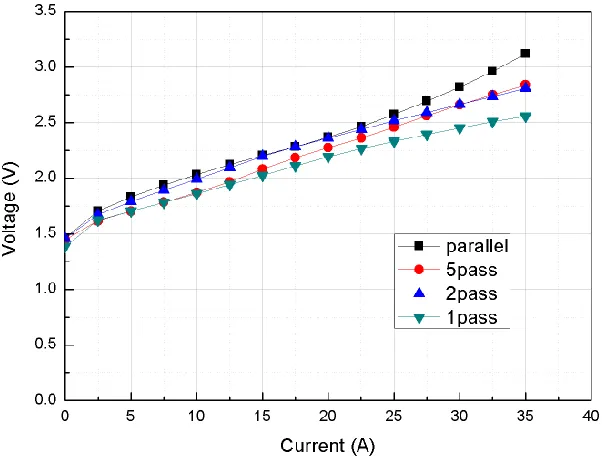
Figure 7. Comparisons of the polarization curves obtained numerically and experimentally with the Simulink program and the four flow fields of PFF, 1/24 SFF, 2/12 SFF and 5/4 SFF at cell temperatures of 70 °C.
The polarization curve is the core of the PEM electrolyzer performance, which depends on the input current, the water temperature and some constitutive internal resistances. Fig. 7 compares the polarization curves obtained numerically and experimentally with the Simulink program and the four flow fields, PFF, 1/24 SFF, 2/12 SFF and 5/4 SFF, at a cell temperature of 70 °C. When the cell temperature is 70 °C, the cell voltage for the PFF is the lowest of the flow fields and is also very close to that obtained with the Simulink program. The applied voltage, i.e., the circuit voltage calculated using the Nernst equation (5), increases nonlinearly up to almost 0.05 A/cm2 and linearly thereafter. The slope of this linear curve represents the electrical resistances inside the cell. The developed model predicts the qualitative cell polarization curve well; however, the measured voltage is higher than the analytical voltage due to internal electrical resistances. The overvoltage in the high-current-density region was larger when the flow velocity of the circulating water in the channel was higher because the flow rate per channel, and thus the flow velocity, is significantly different for various flow fields and depends on the number of channels in parallel, even when the flow rate is the same. This finding suggests that an increase in overvoltage in the high current density region is caused by an increase in concentration overvoltage and suggests a relation between the flow velocity and the concentration overvoltage.
[image:12.596.142.443.77.305.2][image:13.596.134.454.86.323.2]
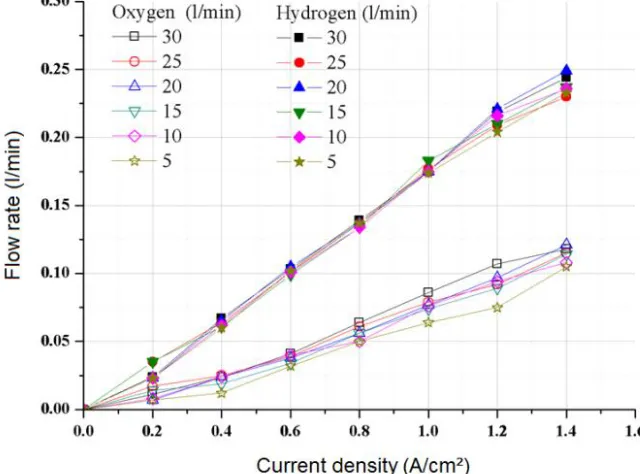
Figure 8. Effect of water flow rate on the generating flow rates of hydrogen and oxygen with the PFF at various water temperatures.
The generating flow rates of hydrogen and oxygen were lower than the value estimated by the overall dissociation of water because of the internal electrical resistance. The conversion efficiency of de-ionized water into hydrogen and oxygen was calculated as approximately 80%.
5. CONCLUSIONS
This analytical and experimental study focused on the control of the temperature and flow rate of de-ionized water in a PEM electrolyzer for the efficient generation of hydrogen and oxygen. The developed model predicted the polarization curve from 30 to 70 °C well in comparison with the experimental measurement. The quantitative differences between the model prediction and the experimental measurement were caused by the internal electrical resistance of the PEM electrolyzer cell. At 70 °C, the electrolyzer with the PFF flow field had the highest performance of the polarization curve as well as generating flow rates of hydrogen and oxygen measured for water flow rates from 5 to 30 ml/min. The generating flow rates of hydrogen and oxygen were approximately 80% of those of the overall dissociation of water. A Simulink program is now created for the mole balance and electrochemical reaction at the anode and the cathode. Based on these results, we aim to develop an efficient PEM electrolyzer for regenerative fuel cell systems with renewable energy.
ACKNOWLEDGMENTS
References
1. F. Barbir, Sol. Energy, 78 (2005) 661.
2. S. A. Grigoriev, V. I. Porembsky, V. N. Fateev, Int. J. Hydrog. Energy, 31 (2006) 171.
3. S. Rivas, L. G. Arriaga, L. Morales, A. M. Fern ndez, Int. J. Electrochem. Sci., 7 (2012) 3601. 4. R. E. Clarke, S. Giddey, S. P. S. Badwal, Int. J. Hydrog. Energy, 35 (2010) 928.
5. E. Rasten, G. Hagen, R. Tunold, Electrochim. Acta, 48 (2003) 3945.
6. S. A. Grigoriev, V. Porembskiy, S. V. Korobtsev, V. N. Fateev, Int. J. Hydrog. Energy, 36 (2011) 2721.
7. F. Andolfatto, R. Durand, A. Michas, P. Millet, P. Stevens, Int. J. Hydrog. Energy, 19 (1994) 421. 8. D. Shapiro, J. Duffy, M. Kimble, M. Pien, Sol. Energy, 78 (2005) 544.
9. O. Atlam, Int. J. Hydrog. Energy, 34 (2009) 6589.
10.H. Zhang, S. Su, G. Lin, J. Chen, Int. J. Electrochem. Sci., 7 (2012) 4143. 11.R. E. Clarke, S. Giddey, S. P. S. Badwal, Int. J. Hydrog. Energy, 35 (2010) 928.
12.S. Song, H. Zhang, X. Ma, Z. Shao, R. T. Baker, B. Yi, Int. J. Hydrog. Energy, 33 (2008) 4955. 13.L. Ma, S. Sui, Y. Zhai, Int. J. Hydrog. Energy, 34 (2009) 678.
14.G. Wei, Y. Wang, C. Huang, Q. Gao, Z. Wang, L. Su, Int. J. Hydrog. Energy, 35 (2010) 3951. 15.M. L. Helm, M. P. Stewart, M. Bullock, M. R. DuBois, D. L. DuBois, Science, 333 (2011) 863. 16.H. Su, B. J. Bladergroen, S. Pasupathi, V. Linkov, S. Ji, Int. J. Electrochem. Sci., 7 (2012) 4223. 17.Y. Onda, T. Kyakuno, K. Hattori, K. Ito, J. Power Sources, 132 (2004) 64.
18.F. Marangio, M. Pagani, M. Santarelli, M. Calı, Int. J. Hydrog. Energy, 36 (2011) 7807.
19.S. Siracusano, V. Baglio, M. A. Navarra, S. Panero, V. Antonucci, A. S. Aric , Int. J. Electrochem. Sci., 7 (2012) 1532.
20.K. Onda, T. Murakami, T. Hikosaka, M. Kobayashi, R. Notu, K. Ito, J. Electrochem. Soc., 149 (2002) A1069.
21.P. Choi, D. G. Bessarabov, R. Datta, Solid State Ion., 175 (2004) 535.
22.C.-G. Piuleac, C. S ez, P. Ca izares, S. Curteanu, M. A. Rodrigo, Int. J. Electrochem. Sci., 7 (2012) 6289.
23.S. P. S. Badwal, S. Giddey, F. T. Ciacchi, Ionics, 12 (2006) 7.
24.S. A. Grigoriev, V. I. Porembsky, V. N. Fateev, Int. J. Hydrog. Energy, 31 (2006) 171.
25.P. Millet, D. Dragoe, S. Grigoriev, V. Fateev, C. Etievant, Int. J. Hydrog. Energy, 34 (2009) 4974. 26.J. D. Maclay, J. Brouwer, G. S. Smauelsen, Int. J. Hydrog. Energy, 31 (2006) 994.
27.S. Becker, V. Karri, Int. J. Hydrog. Energy, 35 (2010) 9963.
28.R. E. Clarke, S. Giddey, S. P. S Badwal, Int. J. Hydrog. Energy, 35 (2010) 928. 29.H. G rg n, Int. J. Hydrog. Energy, 31 (2006) 29.
30.P. Choi, D. G. Bessarabov, R. Datta, Solid State Ion., 175 (2004) 535.
31.R. Garc a-Valverde, C. Miguel, R. Mart nez-B jar, A. Urbina, Int. J. Hydrog. Energy, 33 (2008) 5352.
32.K. S. Choi, H. M. Kim, S. M. Moon, Electrochem. Commun., 13 (2011) 1387. 33.O. Atlam, M. Kolhe, Energy Conv. Manag., 52 (2011) 2952.