E
CONOMIC
P
OLICY
R
ESEARCH
I
NSTITUTES
W
ORKINGP
APERN
O. 5/S
EPTEMBER2001
W
HAT
D
ROVE
R
ELATIVE
W
AGES
IN
F
RANCE
?
S
TRUCTURAL
D
ECOMPOSITION
A
NALYSIS IN A
G
ENERAL
E
QUILIBRIUM
F
RAMEWORK
, 1970-92
S
ÉBASTIEN
J
EAN
ANDO
LIVIER
B
ONTOUT
ISBN 92-9079-346-5
W
HAT
D
ROVE
R
ELATIVE
W
AGES IN
F
RANCE
?
S
TRUCTURAL
D
ECOMPOSITION
A
NALYSIS IN A
G
ENERAL
E
QUILIBRIUM
F
RAMEWORK
, 1970-92
ENEPRI W
ORKING
P
APER
N
O
. 5, S
EPTEMBER
2001
S
EBASTIENJ
EAN& O
LIVIERB
ONTOUT∗A
BSTRACTThis paper confronts a CGE model to observed evolutions in France, between 1970 and 1992, through a structural decomposition analysis. The choice of the model and the assumption of constant elasticities over time enable the structural change of the economy between two equilibria to be summarised through a set of four types of state variables, reflecting the effect of technical change, changes in factor supplies, shifts in consumption patterns, and international trade. Simulations then allow the contribution of each of these shocks to be assessed. We find that technical change had a strong positive impact on the relative wage of skilled to unskilled workers, while the impact of changes in factor supplies is strongly negative. The effect of international trade is far less important. However, if we take into account a trade-induced effect on productivity, then we find that trade substantially increased wage inequalities.
JEL Classification: D58, F16.
Key-words: Decomposition analysis; General equilibrium model; Relative wages; France.
∗ Sébastien Jean (corresponding author) is economist at the OECD. Olivier Bontout is economist
ENEPRI W
ORKINGP
APERN
O. 5
W
HAT ARE THE FACTORS BEHIND THE RISE IN THE
UNEMPLOYMENT AMONG UNSKILLED WORKERS
?
In most EU Member States the rate of unemployment is much higher for unskilled than for skilled workers and for persons with less than upper secondary education than for persons with upper secondary or third level education. In addition the rate of unemployment among unskilled workers accounted for a high proportion of the overall increase in the rate of unemployment during the 1990s. What are the factors behind the deterioration of the employment prospects for the unskilled workers?
A study undertaken by two French economists, Sebastien Jean and Olivier Bontout, now published as an ENEPRI Working Paper1, shows that, for France at least, a large part of the
relative increase in unemployment among the unskilled workers can be attributed to (a) technological progress favouring skills and knowledge and (b) increasing globalisation of markets and enhanced competition from imports.
The conceptual framework used by Jean and Bontout consists in a computable general equilibrium (CGE) model describing the choice of consumption between domestic and foreign products, on the assumption of imperfect substitutability between the former and the latter. Using data for 9 industrial sectors, they show that for the economy as a whole the increase in the real wage (total labour cost) of unskilled relative to skilled workers over the twenty two years from 1970 to 1992 was accompanied by an evolution of production technologies toward a more intensive use of skilled labour and a shedding of unskilled workers. This effect was to some extent compensated by the increased relative supply of skilled labour.
In an additional simulation, they show that globalisation and the resulting rise in import penetration during this period resulted in an overall rise in “welfare” (productivity per capita) for the economy. However, foreign trade put a higher pressure on wage costs of unskilled workers and therefore, in the absence of wage flexibility, contributed to shedding and an associated rise in the productivity of this kind of labour.
This work does not pretend to reach definitive conclusions and further research is needed both to further develop the conceptual framework and to assess further the empirical evidence of these mechanisms. It nevertheless provides an underpinning of arguments in the design of the labour market policies most appropriate to cope with the effects of globalisation on the labour market in the developed countries. It underlines, in particular, that retraining and “upgrading” of unskilled labour may be a most appropriate response to globalisation.
1 Sebastien Jean and Olivier Bontout:, What Drove Relative Wages in France: Structural Decomposition Analysis in a General Equilibrium Framework, 1970-1992, ENEPRI Working Paper N° 5, 2001. The WP can be downloaded from ENEPRI’s web site: http://www.enepri.org
1. Introduction ...1
2. The Model ...3
2.1. The demand side ...3
2.2. The supply side ...5
2.3. Trade flows...6
2.4. Production factor markets ...7
3. Decomposition analysis in a general equilibrium framework: methodology...8
3.1. Structural model and state variables ...8
3.2. From state variables to decomposition analysis...8
3.3. Accounting for changes in international trade intensities...10
3.4. Accounting for changes in the sector distribution of consumption ...11
4. The results ...12
4.1. Stylised facts ...12
4.2. Results of the decomposition analysis ...14
4.3. The link between trade and productivity...16
4.4. Sensitivity to the substitutability between production factors ...18
5. Conclusion...20
References ...22
Annex 2: ...25
W
HAT
D
ROVE
R
ELATIVE
W
AGES IN
F
RANCE
?
S
TRUCTURAL
D
ECOMPOSITION
A
NALYSIS IN A
G
ENERAL
E
QUILIBRIUM
F
RAMWORK
, 1970-1992
S
ÉBASTIANJ
EAN ANDO
LIVIERB
ONTOUT1. Introduction
Various causes are invoked to explain the recent evolutions of skilled to unskilled relative wage in industrialised countries. The most important ones are probably five: changes in factor supplies, modifications of consumption patterns, institutional changes, technical change and international trade. In spite of the abundant literature on the subject, it remains difficult to have a clear view of the role of these determinants.
Their impact is in most cases studied separately, using ad hoc methods (factor content of trade calculations, for example) or econometric analysis based on reduced forms. Informative as they are, these kinds of studies only tell part of the story. The residual, unexplained variations in relative wages are then often attributed to the causes not taken into account. Such an assessment does not account for the possible interactions between the various causes, and it does not check the consistency of the overall explanation.
Other studies adopt a radically different approach, based on general equilibrium modelling. Recent examples include Rowthorn (1995), Cortes and Jean (1996, 1998), Cardebat and Teïletche (1997), Lawrence and Evans (1997), Bontout and Jean (1998) and Francois and Nelson (1998). These works are useful in clarifying the prevailing mechanisms. It is difficult, however, to understand how well these models explain observed evolutions. They generally focus on part of the possible causes, and they either rely on stylised databases or adopt a prospective standpoint.
As emphasised by Abrego and Whalley (1999), the choice of a structural model has strong implications for the interpretation of given observations. They insist that "it is important to explicitly explore the properties of particular structural models in decompositions, rather than only appealing to them as theoretically consistent models for reduced form analyses".
We first choose the structural model, and assume constant the elasticities of substitution over time, both in the utility function and production function. Given these parameters (set on the
basis of existing econometric studies)[SJ2], the structural equilibrium of the economy is
determined by four categories of parameters and exogenous variables, which therefore form a set of state variables: share coefficients in the production function, reflecting the productivity for each factor within each sector; factor supplies, assumed to be exogenous; share coefficients in the utility function, reflecting consumers preferences; and, for each sector, the relative price of imports, as a proportion of domestic output price.
However, wage rigidities and institutional changes are not accounted for. We do not take into account frictional and cyclical unemployment, hence the assumption of full employment in 1970. From the 1992 database and given the observed structural unemployment at this date, we compute an "underlying full-employment equilibrium", assuming that relative wages adapt in order to remove this unemployment. The equilibrium obtained is considered as the benchmark for 1992. The study then analyses the causes of evolution of the French economy between these two full-employment equilibria, assuming that wages are perfectly flexible. This is most of all a way to avoid addressing the questions of changes in wage rigidities and institutional aspects of the labour market, for which CGE models are not really well-suited.
Structural change of the French economy between 1970 and 1992 can thus be summarised through the changes in these four categories of state variables. To analyse their role, we built a database for 1970 and for 1992. For the latter, we used the same physical units, for goods and factors, as for the former. The total change over the period can then be decomposed, in order to determine the contribution of each category of state variables.
This procedure makes it possible to estimate the contributions of technical change, factor supplies variations, shifts in the sectoral consumption pattern, and shift in trade intensities, in the variations of welfare and of each factor's real reward.
2. The Model
The computable general equilibrium (CGE) model presented in this section has been conceived with the objective of providing a rough analysis of the structural change of the French economy. It is built on the basis of the model we used in Jean and Bontout (1998), which is in many respects similar to those developed by Gasiorek, Smith and Venables (1992) and Mercenier (1992) for the assessment of European economic integration, as well as to the one proposed by Cortes and Jean (1996, 1998) for dealing with the emergence of low-labour-cost countries. This model uses an Armington hypothesis, but it also incorporates, for French industrial sectors only, horizontal product differentiation, monopolistic competition and increasing returns to scale.
The model focuses on France (including its trade flows, separately with a Southern and a
Northern2 area). Nine sectors are distinguished, eight of which belong to agriculture and
industry. Services are gathered in a single sector. We consider three production factors: unskilled labour, skilled labour and capital.
2.1. The demand side
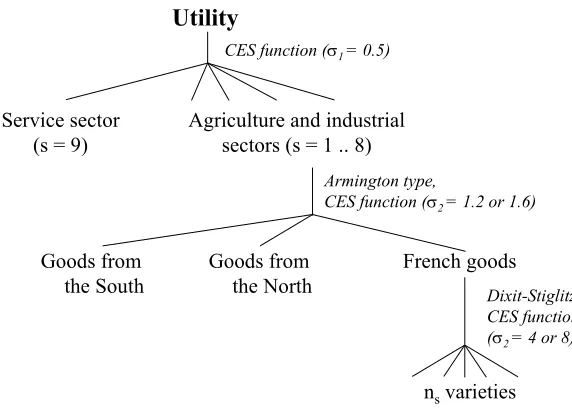
Final consumption and intermediate consumption are modelled in the same way. For each of them, the demand function is supposed to be homothetic, and the representative consumer behaviour is modelled in three stages (see Figure 1). The first level describes the distribution of demand between industries. It is represented through a CES utility function, with an elasticity of substitution σ1 equal to 0.5. The share of an industry in total expenditure thus
increases with its relative price.
2 This Northern area includes the countries the GDP in PPP per capita of which was greater than 80%
Figure 1: Structure of the utility function
Utility
Service sector (s = 9)
Agriculture and industrial sectors (s = 1 .. 8)
Goods from the South
French goods
ns varieties
Armington type,
CES function (σ2 = 1.2 or 1.6)
Dixit-Stiglitz, CES function (σ2 = 4 or 8)
CES function (σ1 = 0.5)
Goods from the North
This is the only tier for the service sector, where goods are assumed to be homogenous and non-tradable. Within each other sector, in contrast, we use an Armington hypothesis: the choice between products from different geographical origins (France, North and South) is modelled through a CES function, with an elasticity of 1.2 for the high-differentiation sectors, and 1.6 for the low-differentiation ones (see Table 1). A third tier is modelled, for French products only, corresponding to a Dixit-Stiglitz formulation: the consumer chooses between horizontally-differentiated varieties of each good, with a constant elasticity of substitution (equal to 4 in high-differentiation sectors and 8 in low-differentiation ones).
Table 1: Sectoral parameters (elasticity and fixed costs)
Sigma2 (Armington elasticity)
Sigma3 (elasticity of substitution between
French varieties)
Fixed costs, as a proportion of total cost
1 Agriculture 1,6 8 0,15
2 Agro-food industry 1,2 4 0,30
3 Energy 1,6 8 0,15
4 Intermediate goods 1,6 8 0,15
5 Professional equipment goods 1,2 4 0,30
6 Households equipment goods 1,6 8 0,15
7 Transport materials 1,2 4 0,30
8 Current consumption goods 1,6 8 0,15
2.2. The supply side
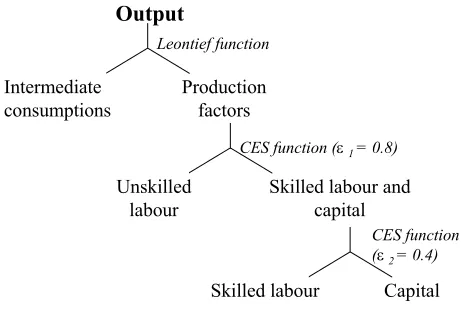
[image:9.612.188.420.312.467.2]The production function involves intermediate consumptions and the three types of production factors. It is a nesting of two functions (see Figure 2). Firstly, intermediate goods and value added are assumed to be perfectly complementary, as reflected by the use of a Leontief function. The service sector is assumed to exhibit constant returns to scale. For all other sectors, however, we take into account at this level the presence of fixed costs, inducing economies of scale. These fixed costs correspond to 15% of the initial output in low-differentiation sectors (where the elasticity of substitution between French varieties is 8, and the Armington elasticity is 1.6), and to 30% in high-differentiation ones (with elasticities in demand of 4 and 1.2), and this percentage is assumed to hold both in 1970 and in 1992.
Figure 2: Structure of the production function
Output
Intermediate consumptions
Production factors
Unskilled labour
Skilled labour and capital
Skilled labour Capital
Leontief function
CES function (ε 1 = 0.8)
CES function (ε 2 = 0.4)
The combination of production factors is represented in two stages: a first CES function gathers unskilled labour and an aggregate of skilled labour and capital, the latter aggregate being represented though a CES with a lower elasticity of substitution. This aims at reflecting the relative complementarity between capital and skilled labour.
the first effect should be taken into account in the context of a CGE model, where uniform factor intensity is assumed within each sector. The study of Legendre and Le Maître (1997) based on panel data for France confirms that taking into account interfirm heterogeneity leads to lowering the estimations of capital-labour substitutability, and estimates by Steiner and Wagner (1997) with disaggregated data for Germany point in the same direction. Nonetheless, we will consider in the sensitivity analysis the possibility for this elasticity to be superior to one (1.2).
The service sector is assumed to be perfectly competitive, while industrial sectors are in monopolistic competition à la Cournot (see Annex 1 for details). Given the substantial length of the period considered, and the fact that we focus on structural equilibria, the number of firms is assumed to be variable, and set by a zero-profit condition. Knowing fixed costs and the elasticity of substitution between goods, this zero-profit condition also enables the number of firms to be calibrated in the benchmarks.
2.3. Trade flows
The French demand for imports does not call for a specific modelling: it is set through the demand of French consumers, as a result of their utility maximisation under budget constraint.
The demand addressed to French exports, in contrast, has to be modelled in an ad hoc way.
This is done assuming that export intensity3 depends on the relative price of exports to imports
with a constant elasticity, equal to the Armington elasticity of substitution used in the sub-utility index of the sector:
(1) s Fr s j j s Fr s s Fr j s Fr
p
p
CFC
Y
Y
2,, , , , ., , ,
, −σ
=
Where the subscript Fr refers to France, j to another area (North or South), and s to an industrial sector (s = 1 to 8). YFr,s,j is the French output of sector s sold in area j as a final
consumption, pFr,s,j is the corresponding price, and pj,s,Fr is the price of French imports in the
3 This modelling of the demand addressed to exports is based on export intensity, not on exports,
sector s, from area j. YFr,s, . is the total French output of sector s.CFCs is a constant, calibrated
on the basis of the French export flow of final consumptions in sector s. A similar equation can be written for intermediate consumptions, with a specific constant, CICs. σ2,s is the
Armington elasticity of sector s.
Prices of imports (pj,s,Fr) are given in the database. In the simulations, two closing rules are
possible with regards to foreign trade with: the first one is to consider these import prices as exogenous, hence an endogenous trade balance; the second one is to consider the trade balance as exogenous, and to allow import prices to vary by the same proportion for all sectors, which is equivalent to assume the exchange rate to be endogenous. Except where otherwise stated, this second closure rule will be adopted.
2.4. Production factor markets
The rise in unemployment, in particular among unskilled workers, has been one of the main features of the French economy during the last decades. However, it is difficult to account for it in a CGE model. Since we are concerned only with structural equilibrium, frictional and cyclical unemployment are irrelevant here. Only structural unemployment could be studied in this framework, but even in this case, some important problems arise. Let us assume, for example, that unskilled labour market can be described through a WS-PS model (as in Bontout and Jean, 1998, for example); the problem is that the WS curb would not be unchanged throughout the period studied, and that we cannot account explicitly for the determinants of this shift.
In this context, we can assume all factor markets to be perfectly competitive, with perfectly flexible price, included for unskilled labour. The supply of each production factor is assumed to be exogenous, and full employment of each factor is met through wage adjustment.
3. Decomposition analysis in a general equilibrium framework: methodology 3.1. Structural model and state variables
In order to describe the state of the economy at a given date, we initially need an extended database (see next section and Annex 2 for further details on the data), covering output, value added, production factors, intermediate consumptions and trade flows for each sector, plus the prices of goods and production factors. Once the structural model is chosen, however, the state of the economy can be summarised in a plainer fashion.
Indeed, we assume constant over time the parameters which are not calibrated, i.e. the
elasticities of substitution between (baskets of) goods used in the utility function and the elasticities of substitution between factors in the production function, plus the magnitude of fixed costs as a proportion of total production costs, for industrial sectors. We also suppose that there is no trade barriers.
In this context, the state of the economy is fully determined by two categories of calibrated parameters and two categories of exogenous variables:
• share coefficients in the production function (calibrated parameters);
• share coefficients in the utility function (calibrated parameters);
• sector structure of relative import prices (i.e.pi,s,Fr / pi,s',Fr), plus the level of exchange rate
(i.e. the level of one import price, relative to the domestic price in the same sector) or the level of trade balance (exogenous variables);
• factor supplies (in physical units, not in values) (exogenous variables).
3.2. From state variables to decomposition analysis
through the changes in these state variables. And we can link the main causes put forward for the evolution in wage inequalities to these changes in state variables:
• technical change is summarised through the changes in the share coefficients in the
production function (this does not allow to take into account the changes in quality nor the appearance of new products, but this is no surprise as long as we assume the structural model to be unchanged);
• changes in the sectoral distribution of (intermediate and final) consumers demand are
reflected in the changes in the share coefficients in the upper tier of the utility function;
• trade evolutions are the consequence of both changes in import prices relative to domestic
prices (and in the value of trade balance), and evolutions of the share coefficients in the Armington tier of the utility function (which reflect the geographical distribution of consumers demand, for given prices);
• changes in factor supplies are directly accounted for.
This enables the contribution of each of these four main shocks to be determined: it is equal to the impact of the change in the corresponding set of state variables. The problem is that this impact depends on the initial state of the economy. The effect of the sum of these four shocks is known (it corresponds to the structural change observed between 1970 and 1992), but the impact of one of them is not the same if it is assumed to occur first (from the 1970 benchmark) or after other shocks. One way to overcome this problem could be to divide the period in many subperiods (the shorter the period, the weaker the dependence between the impact of a single shock and the order in which shocks are considered to occur), but this method would require a heavy data work. For the sake of simplicity, we adopt the following
proxy. The impact of each shock (i.e. each change in a set of state variables) is computed
assuming it occurs first (on the basis of the 1970 benchmark) and then assuming that it occurs after the three other shocks (in this case, the shock leads, from an intermediary state of the economy, to the 1992 benchmark4). The proxy is the average of these two impacts.5
4 In practice, we start from 1992's benchmark, and assume that the state variables concerned take back
their 1970's value. This gives the "intermediary state" of the economy mentioned above.
5 If ∆
This procedure is fairly straightforward to implement in the case of factor supplies and of technical progress (i.e. share coefficients in the production function). It is somewhat more tricky, however, for the two other shocks (sectoral consumption pattern and international trade). The first reason it that they modify the utility function of consumers, and therefore the dual price index. In this case, we use as a price index the geometric average of the dual price indexes of the initial and final utility functions. The second problem is the linkage between the various tiers of the utility function.
3.3. Accounting for changes in international trade intensities
To determine the contribution of trade to the structural change of the French economy, we simulate the impact of a shock corresponding to the modification of the state variables reflecting the evolution of trade intensities (i.e. export intensity and import penetration rate) by sector.
For export intensity, the change is due to the evolution of French export prices, with respect to foreign prices (the latter are assumed to be equal to import prices), but also to the changes in the function of demand addressed to French exports, namely in the constant CFCs (for final
consumption, in sector s) and CICs (for intermediate consumption), which are changed from
their 1970 value to their 1992 value.
In order to account for the changes in the import penetration rate, we first change the Armington tier of the utility function (turning from the share coefficients calibrated in 1970 to those obtained in 1992, both for final and intermediate consumptions). In fact, these coefficients summarise many things: possible changes in consumers tastes, trade barriers, transport costs, access of importers to distribution networks, supply effects (increase in the number of varieties offered by importers, for example), etc. We do not try to disentangle these various effects.
upper tier, in order to make sure that the sector distribution of consumption is not changed, for given prices.[SJ3] Once this is done, we take into account the changes in import prices.
To summarise, the "trade intensity shock" corresponds to a change in a set of state variables, which induces a shift of export intensities and import penetration rates, for each sector, from their 1970 level to their 1992 level. Concretely, the following state variables are changed (from their 1970 level to their 1992 level):
• import prices, with respect to domestic prices (as import prices are set, trade balance is
supposed to be endogenous);
• constants in the function of demand addressed to French exports;
• share coefficients in the Armington-type sub-utility function of each industrial sector
(with a re-calibration of the coefficient of the upper tier in coherence with the change in the composition of the sector goods' basket).
3.4. Accounting for changes in the sector distribution of consumption
In order to account for the changes in the sector distribution of consumption, we change the value of the share coefficients in the upper tier of the utility function, from their 1970's level to their 1992's level. But the definition of the baskets of goods concerned is not the same in both cases. It is therefore inconsistent to change the coefficients of the upper tier without taking into account the shift occurred at the lower (Armington) level.
To overcome this problem, we assess the global effect of trade and sector distribution of consumption (changing the whole utility function from its 1970's expression to its 1992's expression, and taking into account the changes in coefficients of demand addressed to exports, and in import prices), taken together. The effect of the shift in the sector distribution of consumption alone is then obtained by difference with the effect of changes in trade intensities.6
6 This is a proxy, because it assumes that changes in the sector distribution of consumption always
4. The results 4.1. Stylised facts
The data used are drawn from French National Accounts (see details in Annex 2). For each good and for each production factor, the physical unit used is the same in both databases (the evolutions expressed in volumes are set on the basis of 1980 prices)7. The prices are all set to
unity8 in the calibration of the 1970 benchmark, as usual, but this is not the case for the
calibration of the 1992 benchmark, as we account for variations in prices (note however, that only real values are relevant here, i.e. that the numeraire can be chosen freely in the second calibration).
The main evolutions are summarised in Table 2. Note in particular that the real9 wage for
unskilled workers10 has been rising faster (+51% over the period) than the real wage for
skilled workers (+33%). But, as mentioned above, we do not use the 1992 database directly as the final benchmark: we first compute an "underlying full-employment structural equilibrium", assuming that the economy (and in particular wages) adjusts in order to remove the 7% structural unemployment. Once this is done, we observe that the relative competitive wage11 of skilled to unskilled workers hardly changed over the period: it slightly increased,
from 2.23 in 1970 to 2.24 in 1992, and the real wage is found to have increased by about 40% for both categories. On the other hand, the employment growth is very different for these two categories: while skilled employment increased sharply (+65%), unskilled employment declined (-12.1% before adjustment for unemployment, -2.4% after). As computed from the evolution of global income of capital and from the very strong increase in the net fixed capital stock (+ 147%), the real cost of capital is found to have decreased by 18% before adjustment for unemployment, and by 13% after the adjustment.
7 For capital stock, we use the estimates made by the French national statistical institute (INSEE) of
the net, fixed capital stock by industry.
8 This is only a particular way to choose the physical unit, for each good and for each factor. 9 In this descriptive comment, real values are calculated on the basis of GDP deflator.
10 "Employés" and "ouvriers", in the French classification. Skilled workers, in contrast, are those
classified as intermediate and superior professions.
Meanwhile, trade intensities have risen sharply in the tradable sectors. The average import penetration rate (imports over total domestic demand) from the South nearly doubled (3.2 to 6.1%, and the increase would be far higher, were we to exclude energy), while it rose from 9.3 to 15.8% for imports from the North. The average export intensity went up from 3.6 to 6.8% toward the South, and from 8.2 to 14.9% toward the North. Of course, given the increasing weight of services, the evolutions are less impressive for the economy as a whole, but still the average import penetration rate rose from 7.2% to 9.8%, and the export intensity went up from 6.8% to 9.7%.
[image:17.612.101.553.392.591.2]The initial data set also enables the evolution of partial productivities to be observed. Their average over the whole economy reflects mostly the relative rhythm of accumulation of each factor, in comparison of GDP growth. It is no surprise, in this context, to observe a sharp fall in the average partial productivity of capital (-30%), while skilled labour partial productivity slightly increases (+5%), and the average partial productivity of unskilled workers is nearly doubled (+98%).
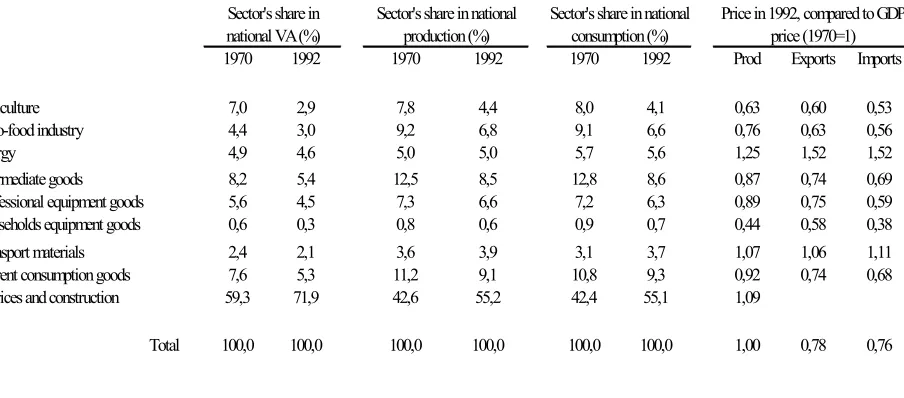
Table 2: Descriptive analysis from the 1970 and 1992 databases
Sector's share in national VA (%)
Sector's share in national production (%)
Sector's share in national consumption (%)
Price in 1992, compared to GDP price (1970=1) 1970 1992 1970 1992 1970 1992 Prod Exports Imports
1 Agriculture 7,0 2,9 7,8 4,4 8,0 4,1 0,63 0,60 0,53 2 Agro-food industry 4,4 3,0 9,2 6,8 9,1 6,6 0,76 0,63 0,56 3 Energy 4,9 4,6 5,0 5,0 5,7 5,6 1,25 1,52 1,52 4 Intermediate goods 8,2 5,4 12,5 8,5 12,8 8,6 0,87 0,74 0,69 5 Professional equipment goods 5,6 4,5 7,3 6,6 7,2 6,3 0,89 0,75 0,59 6 Households equipment goods 0,6 0,3 0,8 0,6 0,9 0,7 0,44 0,58 0,38 7 Transport materials 2,4 2,1 3,6 3,9 3,1 3,7 1,07 1,06 1,11 8 Current consumption goods 7,6 5,3 11,2 9,1 10,8 9,3 0,92 0,74 0,68 9 Services and construction 59,3 71,9 42,6 55,2 42,4 55,1 1,09
Penetration rate of imports from the South
(%)
Penetration rate of imports from the North
(%)
Export intensity toward the South
(%)
Export intensity toward the North (%) 1970 1992 1970 1992 1970 1992 1970 1992 1 Agriculture 4,9 3,4 4,2 6,0 1,2 4,3 5,6 10,5 2 Agro-food industry 3,4 3,7 3,0 7,8 1,3 3,1 5,3 10,4 3 Energy 11,8 10,5 3,9 5,0 0,6 1,6 2,7 3,6 4 Intermediate goods 2,5 5,7 15,0 22,6 4,5 7,0 10,9 19,7 5 Professional equipment goods 0,5 5,8 20,1 31,9 9,1 15,8 11,7 24,2 6 Households equipment goods 0,4 9,8 13,8 25,9 2,2 6,8 5,4 21,3 7 Transport materials 0,3 8,0 11,6 21,6 7,1 10,6 16,2 23,5 8 Current consumption goods 0,8 6,0 6,3 12,0 2,8 5,1 7,2 11,0 9 Services and construction 0,0 0,0 0,0 0,0 0,0 0,0 0,0 0,0
Total 1,8 2,7 5,4 7,1 2,1 3,0 4,7 6,7 Industrial sectors (1-8) 3,2 6,1 9,3 15,8 3,6 6,8 8,2 14,9
Value added at constant
prices
Capital income / VA (%)
Skilled wage bill / VA (%)
Unskilled wage bill / VA
(%)
Partial productivity (1970=100) (1970=100) 1970 1992 1970 1992 1970 1992 Capital Skilled Unskilled 1 Agriculture 113,4 24,1 23,4 23,4 21,6 52,5 55,1 135,0 228,4 228,6 2 Agro-food industry 155,6 24,1 23,4 21,0 19,8 54,9 56,8 111,5 184,2 191,3 3 Energy 129,4 69,2 75,3 12,2 12,8 18,6 11,9 60,4 100,4 188,9 4 Intermediate goods 129,7 33,9 37,2 15,3 19,6 50,8 43,2 86,2 119,4 204,2 5 Professional equipment goods 158,0 25,2 26,4 28,7 39,0 46,1 34,7 88,9 110,1 226,8 6 Households equipment goods 203,1 32,0 31,6 27,9 40,2 40,1 28,1 190,2 210,2 490,9 7 Transport materials 141,4 10,7 32,9 20,6 22,7 68,6 44,5 25,1 112,6 217,4 8 Current consumption goods 133,7 27,0 33,1 15,8 24,7 57,1 42,2 73,2 92,6 223,1 9 Services and construction 193,1 20,8 26,4 31,8 37,8 47,4 35,8 59,6 102,0 183,2 Total 173,7 25,2 29,5 26,7 33,7 48,1 36,8 70,2 105,0 197,6
4.2. Results of the decomposition analysis
around 8% lower following the model than in the data. Consequently, the global changes observed in the simulation for real values are around 8% higher than in the benchmark.12
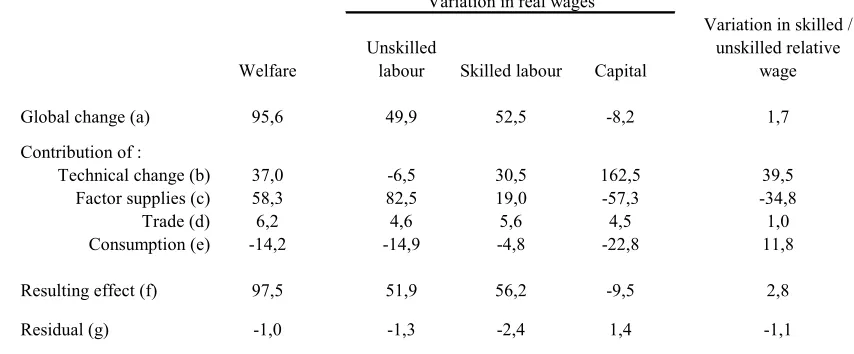
Table 3: Decomposition analysis for France, 1970-1992
Variation in real wages
Welfare
Unskilled
labour Skilled labour Capital
Variation in skilled / unskilled relative
wage
Global change (a) 95,6 49,9 52,5 -8,2 1,7 Contribution of :
Technical change (b) 37,0 -6,5 30,5 162,5 39,5 Factor supplies (c) 58,3 82,5 19,0 -57,3 -34,8 Trade (d) 6,2 4,6 5,6 4,5 1,0 Consumption (e) -14,2 -14,9 -4,8 -22,8 11,8
Resulting effect (f) 97,5 51,9 56,2 -9,5 2,8 Residual (g) -1,0 -1,3 -2,4 1,4 -1,1
Note: All figures are variations in percentage. The resulting effect is calculated as (f) = ( 1+(b) ) x ( 1+(c) ) x ( 1+(d) ) x ( 1+(e) ) - 1, and the residual is (g) = ( 1+(a) ) / ( 1+(f) ) - 1.
Applying the methodology described above makes it possible to decompose this global change, with a fairly good global fit: the residual between the resulting effect of the four shocks and the global effects is inferior to 2.5% for each variable. Technical change and variations in factor supplies appears to be by far the most important contributors to the global change, be it in terms of welfare or in terms of real and relative wages. These two shocks have had a strong positive impact on welfare, but its distribution among factors is very different. Not surprisingly, variations in factor supplies seem to have been very favourable to unskilled real wage (the only factor whose stock decreased) and very unfavourable to the real reward for capital, whose accumulation was very rapid. The effect on skilled real wage is intermediary, so that this shock have had a strong negative effect (-34.8%) on the skilled to unskilled relative wage. This effect is more than balanced by the impact of technical change, which increased the relative wage of skilled workers by nearly 40%, with a negative effect (-6.5%) on unskilled real wage.
12 Even taking this into account, the matching between the global results and observe variations is not
The variation in the sectoral distribution of demand corresponds mainly, in fact, to a shift toward services. As this sector is the only one with constant returns to scale, the impact on welfare turns out to be negative. Moreover, as services are more skilled-intensive and less capital-intensive than the average, this shock is very unfavourable to capital real reward (-22.8%), but it has a weak effect on skilled real wage (-4.8%). The impact on unskilled real wage is intermediary (-14.9%). Consequently, it increases the skilled to unskilled relative wage by 11.8%.
By comparison, the effect of trade seems to be rather weak. More importantly, perhaps, it is the only shock to have a positive effect on the real cost of each of the three production factors, including unskilled labour (+4.6%). There are gains linked to product differentiation and economies of scale, but the Stolper-Samuelson effect is most of all dominated by the strong improvement in terms of trade (nearly +20%). This is problematic, however. It is true that import prices rose less rapidly than domestic production prices, but we do not take into account here the other side of the coin: export prices rose even less rapidly. As long as we assimilate export prices to production prices (with only a small difference linked to mark-ups), we cannot account for this stylised fact.[SJ4]
Still, trade increases the skilled to unskilled relative wage by 1%, but this effect is quite negligible compared to the other impacts mentioned above. It is arguable, however, that the weak sectoral breakdown used here underestimates the variations in specialisation, in particular concerning trade with Southern countries.
4.3. The link between trade and productivity
has been found by Hine and Wright (1995), Feenstra and Hanson (1996),13 Cortes and Jean
(1997) and Greenaway, Hine and Wright (1999). The validity of these results is questionable, but the set-up presented here enables the stakes of such a relationship to be clarified.
If such an impact of trade intensity variations on productivity holds, this means that changes in factor productivities have to be split in two components: one which is linked to trade, and another which is "autonomous". In this case, only the latter belongs to the contribution of technical change, in our decomposition analysis. The former, in contrast, is part of the contribution of variation in trade intensities. This means that the joint impact of trade and technology is unchanged, but that we need to reassess the respective contributions of these two shocks.
In order to include it in the model, we use here the empirical results of Cortes and Jean (1997). They had shown that a one point increase in the import penetration rate in a given industry induces a 1.3% increase in the partial productivity of labour in this industry if imports come from the South and a 0.7% increase if they come from the North. They also found an effect on labour skill: a one point increase in the import penetration rate induces a 0.4% increase in the skilled to unskilled ratio in the industry concerned. In other words, the effect is stronger on the partial productivity of unskilled labour than on the productivity of skilled labour. Formally, this effect is modelled through an endogenous impact of the import penetration rate variations on the parameters of the production function of the representative firm, industry by industry. We will assume, in addition, that import penetration variations have the same impact on the productivity of capital than on the productivity of skilled labour (see Annex 3 for further details).[SJ5]
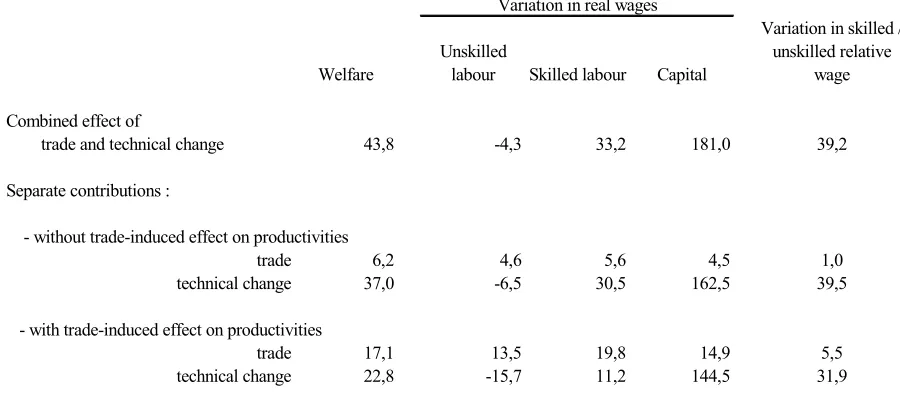
The results of the reassessment of the contributions of trade and technology are reported in Table 4. The impact of trade is strongly increased when an effect on productivity is assumed to hold, and it induces a welfare increase (+17.1%) not far from the one obtained for technical change (+22.8%). Once again, trade appears in this case to have had a positive impact on the real cost of each production factor, included for unskilled workers (+13.5%).
Table 4: Contributions of trade and technical change, with and without trade-induced effect on productivities
Variation in real wages
Welfare
Unskilled
labour Skilled labour Capital
Variation in skilled / unskilled relative
wage
Combined effect of
trade and technical change 43,8 -4,3 33,2 181,0 39,2
Separate contributions :
- without trade-induced effect on productivities
trade 6,2 4,6 5,6 4,5 1,0 technical change 37,0 -6,5 30,5 162,5 39,5
- with trade-induced effect on productivities
trade 17,1 13,5 19,8 14,9 5,5 technical change 22,8 -15,7 11,2 144,5 31,9
Note: All figures are variations in percentage. The composition of both effect is exactly equal to the combined effect in the case "with trade-induced effect on productivities", by construction. It is not the case for the contributions "without...", because the contributions have been calculated as in the previous section (average of the effects obtained assuming that the shock is the first / the last to occur).
However, its influence on the skilled to unskilled relative wage is then positive and significant (5.5%). Of course, this effect is weak compared to the impact of trade or factor supplies variations. But this direct comparison is not necessarily the most relevant: it is normal, according to secular trends, to observe an increase in the skilled to unskilled relative supply, and a parallel decrease in the partial productivity of skilled workers, compared to that of unskilled workers. An evolution in wage inequalities occurs when these trends turn out not to be "parallel". In this perspective, the 5.5% impact of trade on relative wages is far from being negligible.
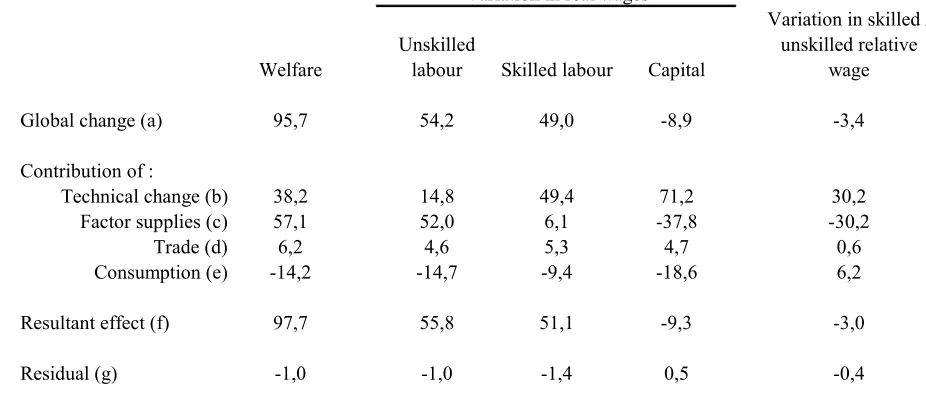
4.4. Sensitivity to the substitutability between production factors
In particular, we know a priori that the effect of a given factor bias in technical change depends on how the elasticity of substitution between the factors concerned compares to unity (see for example Cotis, Germain and Quinet, 1997). So far, the elasticity of substitution has been set to 0.4 between capital and skilled labour, and to 0.8 between their aggregate and unskilled labour. We explained above why we chose these values, but it is worth studying how the results change when a higher substitutability between factors is assumed. This is why we re-assessed the decomposition analysis presented above assuming these two elasticities to be equal to 0.8 and 1.2, respectively (see Table 5).
Table 5: Decomposition analysis for France, 1970-1992, with a high substitutability between factors (σ1=1.2 and σ2=0.8)
Variation in real wages
Welfare
Unskilled
labour Skilled labour Capital
Variation in skilled / unskilled relative
wage
Global change (a) 95,7 54,2 49,0 -8,9 -3,4
Contribution of :
Technical change (b) 38,2 14,8 49,4 71,2 30,2
Factor supplies (c) 57,1 52,0 6,1 -37,8 -30,2
Trade (d) 6,2 4,6 5,3 4,7 0,6
Consumption (e) -14,2 -14,7 -9,4 -18,6 6,2
Resultant effect (f) 97,7 55,8 51,1 -9,3 -3,0
Residual (g) -1,0 -1,0 -1,4 0,5 -0,4
Note first that the global change to explain is not exactly the same as previously. This is not surprising, as long as we do not use directly the 1992 data set as a benchmark: we assume first that relative wages adapt in order to remove structural unemployment. The corresponding adjustment is less important when the substitutability between production factors is higher. Here, it involves a 8.8% increase in the skilled to unskilled relative wage. As a consequence, the variation to be explained in this relative wage is a slight decrease (-3.4%).
factor incomes is still negative, though its positive impact on skilled relative wage is halved. The contribution of trade is nearly unchanged.
This good robustness with regards to factors' substitutability can be considered as surprising, most of all concerning the impact of technical change. It is due mainly to the fact that the definition of the corresponding shock has to be changed, consistently with the new elasticities. The share coefficients in the production function are not the same when the elasticities of substitution used in this function change: it is necessary to make a new calibration, in order to re-calculate the value of these coefficients both in 1970 and in 1992.
5. Conclusion
In this paper, we confront a CGE model to observed evolutions in France, between 1970 and 1992, through a decomposition analysis. We start by observing that, once the structural model is chosen, and constant elasticities of substitution are assumed over time, both in the utility function and production function, the change of the economy between two equilibria can be summarised through the changes in a set of four types of state variables: share coefficients in the production function, reflecting the productivity for each factor within each sector; factor supplies, assumed to be exogenous; share coefficients in the utility function, reflecting the preferences of consumers; and, for each sector, the relative price of imports, as a proportion of domestic output price.
The separate simulation of the impact of the change observed in each of these four sets of state variables then provides an assessment of the specific contribution of each underlying cause: technical change, changes in factor supplies, shifts in consumption patterns, and international trade. These various causes are then assessed in a unified and consistent framework, with the constraint of explaining the whole evolution observed.
The model distinguishes three production factors (unskilled labour, skilled labour and capital), and nine sectors. It uses the Armington hypothesis, but also incorporates horizontal differentiation, monopolistic competition and economies of scale for French industrial sectors.
These two effects are by far the most important, and they mainly reflect the secular skill upgrading of industrialised economies.
References
Bontout O. and Jean S. (1998), "Wages and Unemployment: Trade-off Under Different Labour Market Paradigms", Research Paper, no. 99/6, GLM, University of Nottingham. Cardebat J.-M. and Teïletche J. (1997), "Salaires relatifs, commerce Nord-Sud et progrès
technique: un modèle stylisé d'équilibre général calculable", in Commerce Nord-Sud,
migration et délocalisation- Conséquences pour l'emploi et les salaires, edited by J. de Melo and P. Guillaumont, Economica, Paris, pp. 183-206.
Cortes O. and Jean S. (1996), "Pays émergents, emploi déficient?", Document de travail, no. 96-05, CEPII.
Cortes O. and Jean S. (1997), "Quel est l'impact du commerce extérieur sur l'emploi? Une analyse comparée des cas de la France, de l'Allemagne et des Etats-Unis", Document de travail, no. 97-08, CEPII, and Document d'études, no. 13, DARES.[SJ6]
Cortes O. and Jean S. (1998), "Does Competition of Emerging Countries Threaten the
European Unskilled Labour? An Applied General Equilibrium Approach", in Global Trade
and European Workers, édité par P. Brenton and J. Pelkmans, Macmillan, Londres, pp. 96-122.
Cortes O. and Jean S. (2000), "Trade Spurs Productivity", in Globalisation and Employment Patterns, edited by J. Francois, D. Roland-Holst and D. van der Mensbrugghe, Oxford University Press, forthcoming.
Cotis J.-Ph., Germain J. M. and Quinet A. (1997), "Les effets du progrès technique sur le travail peu qualifié sont indirects et limités", Economie et Statistique, no. 301-302, pp. 23-44.
Feenstra R. C. and Hanson G. H. (1996), "Globalization, Outsourcing and Wage Inequality",
American Economic Review, vol. 86, no. 2, pp. 240-245.
Freeman R. B. (1986), "Demand for Education", in Handbook of Labor Economics, vol. 1, edited by O. C. Ashenfelter and R. Layard, North-Holland, Amsterdam.
Gasiorek M., Smith A. and Venables A. (1992), "1992 Trade and Welfare: a General
Equilibrium Model", dans Trade Flows and Trade Policies, edited by L. A. Winters,
Cambridge University Press, Cambridge.
Greenaway D., Hine R. C. and Wright P. (1999), "An Empirical Assessment of Impact of Trade on Employment in the UK", European Journal of Political Economy, no. 508. Hamermesh D. S. (1986), "The Demand for Labor in the Long Run", in Handbook of Labor
Economics, vol. 1, edited by O. C. Ashenfelter and R. Layard, Amsterdam: North-Holland, pp. 429-471.
Hine R. C. and Wright P. (1995), "The Impact of Changing Trade Patterns on the Demand for Labour in the United Kingdom", mimeo, University of Notthingham, nov.
Jean S. and Bontout O. (1998), "Sensibilité des salaires relatifs aux chocs de commerce international et de progrès technique, une évaluation d'équilibre général", Document de travail, CEPII, no. 98-09.
Lawrence R. Z. and Evans C. L. (1996), "Trade and Wages: Insights from the Crystal Ball",
Working Paper Series, no. 5633, NBER.
Legendre F. and Le Maître P. (1997), "Le lien emploi-coût relatif des facteurs de production: quelques résultats obtenus à partir des données de panel", Economie et statistique, no. 301-302, pp. 111-127.
Mercenier J. (1992), "Can '1992' Reduce Unemployment in Europe? On Welfare and
Employement Effects of Europe's Move to a Single Market", Discussion Paper 2292,
C.R.D.E., Université de Montréal.
Rowthorn R. (1995), "A Simulation Model of North-South Trade", UNCTAD Discussion
Paper, no. 104.
Steiner V. and Wagner K. (1997), "Relative Earnings and the Demand for Unskilled Labour
Annex 1:
Modelling imperfect competition in industrial sectors
In the French industrial sectors (s=1 to 8), firms compete à la Cournot, and their mark-up
ratio on a given market is defined by (the index for the market is omitted, for the sake of simplicity):14 Cm EP p et y p p y
EP=− (1− 1 )=
∂ ∂
(2)
Where pi is the selling price and Cmi the marginal cost of firm i. The firm's perceived
price-elasticity EPi depends on its market share (si) as follows:
s s
i i Fr
i ppUS
Y p n
EP
− + − + = 2 3 2 3 1 1 1 1 1 1 1 σ σ σ σ (3)
Where σ2 is the Armington elasticity of substitution, and σ3 is the elasticity of substitution
between French varieties in the industry.15 n
Fr is the number of French firms in the industry
(we assume a one-to-one correspondence to hold between firms and varieties), Yi is the ouput
of firm i, and pps USs is the amount of consumption in sector s, in the market concerned. The
last term is omitte on foreign market, which is equivalent to assume that the market share of French exporters on foreign markets is negligible.
14 We assume zero conjectural variations, and we do not take into account any Ford effect.
15 For more details on Equation (2), see Gasiorek, Smith and Venables (1992), or Cortes and Jean
Annex 2:
The Data
Most of the data (I/O tables, in particular) are drawn for the time-series of the French national accounts, in the 1980's basis. This is the reason why 1992 is chosen as the last year: the sectoral data for value added, intermediate consumptions and labour compensation is not available for more recent years.
Some hypotheses have to be made for the sake of simplicity and coherence. Stocks variations and investments are considered as final consumptions. Trade flows in services are not taken into account, implying a correction in the final consumption for the service industry. Moreover, the data concerning factor intensities in the national accounts are not fully satisfactory. Some corrections have thus been made on the basis of the factor intensities given in the database built by the OFCE for its model MOSAIC.
The geographical distribution of trade is drawn from the Cepii-Chelem database, keeping the value of total trade for each sector equal to its value in the national accounts.
The data concerning labour skill are taken from the survey Enquête sur la structure de
l'emploi (INSEE). The labour cost for skilled labour and for unskilled labour are built on the
basis of the net earnings from the Déclaration Annuelles de Données Sociales (DARES and
Annex 3:
Modeling the trade-induced effect on productivity
The aggregate of production factors (see also Figure 2) is expressed as follows (the index for the firm is omitted):
1 1 1 1 1 1 1 1
1− − −
+ = ε ε ε ε ε ε γ
γ UL SLK
PF UL SLK
Where PF is the aggregate of production factors used by the firm, UL is the input in unskilled labour, SKL the input in the aggregate of skilled labour and capital. The γ are the share coefficients of these two inputs.
The cost minimisation then leads to:
1 1 ε ε γ = − FP UL UL
FP wp
p UL VA
Where pFP is the dual index price of the aggegate FP, and wUL is the unskilled wage. A similar
relationship could written for SKL, the aggregate of skilled labour and capital, instead of unskilled labour.
For given prices, the partial productivity of skilled labour is thus proportional to γUL−ε1. This
makes it possible to include in the model the empirical results of Cortes and Jean (1997). They had shown that a one point increase in the import penetration rate in a given industry induces a 1.3% increase in the partial productivity of labour in this industry if imports come from the South and a 0.7% increase if they come from the North. They also found an effect on labour skill: a one point increase in the import penetration rate induces a 0.4% increase in the skilled to unskilled ratio in the industry concerned. In other words, the effect is stronger on the partial productivity of unskilled labour than on the productivity of skilled labour. We will assume, in addition, that import penetration variations have the same impact on the productivity of capital than on the productivity of skilled labour. Formally, this effect is
(
)
(
)
(
ini)
South South ini South South ini UL UL MP MP UL SKL SKL MP MP UL SKL SKL − + + + − + + = − − 004 . 0 007 . 0 004 . 0 013 . 0 ) ln( ) ln(
1 γ γ
ε
and
(
)
(
)
(
ini)
South South ini South South ini SLK SLK MP MP UL SKL SKL MP MP UL SKL SKL − + − + − + − = − − 004 . 0 007 . 0 004 . 0 013 . 0 ) ln( ) ln(
1 γ γ
ε
The European Network of Economic Policy Research Institutes (ENEPRI) is composed of ten leading European economic policy research institutes that are committed to working together to develop and consolidate a European agenda of research. ENEPRI was launched in 2000 by the Brussels-based Centre for European Policy Studies (CEPS), which provides overall coordination for the initiative.
While the European construction has made gigantic steps forward in the recent past, the European dimension of research seems to have been overlooked. The provision of economic analysis at the European level, however, is a fundamental prerequisite to the successful understanding of the achievements and challenges that lie ahead. ENEPRI aims to fill this gap by pooling the research efforts of its different member institutes in their respective areas of specialisation and to encourage an explicit European-wide approach.
ENEPRI is composed of the following member institutes:
• CEPII, Centre d’Etudes Prospectives et d’Informations Internationales, Paris, France
• CEPS, Centre for European Policy Studies, Brussels, Belgium
• CPB, Bureau for Economic Policy Analysis, The Hague, The Netherlands
• DIW, Deutsches Institut für Wirtschaftsforschung, Berlin, Germany
• ETLA, Research Institute of the Finnish Economy, Helsinki, Finland
• FEDEA, Fundacion de Estudios de Economia Aplicada, Madrid, Spain
• FPB, Federal Planning Bureau, Brussels, Belgium
• ISAE, Istituto di Studi e Analisi Economica, Rome, Italy
• NIESR, National Institute for Economic and Social Research, London, UK
• NOBE, Niezalezny Osrodek Bana Ekonomicznych, Lodz, Poland
This ENEPRI Working Paper series aims at making the research undertaken by the member institutes or in the context of special ENEPRI events known to a wide public. Unless otherwise indicated, the views expressed are attributable only to the author in a personal capacity and not to any institution with which he or she is associated.
ENEPRI publications are partially funded by the European Commission under its Fifth Framework Programme - contract no. HPSE-CT-1999-00004.
EUROPEAN NETWORK OF ECONOMIC POLICY RESEARCH INSTITUTES C/O CENTRE FOR EUROPEAN POLICY STUDIES
PLACE DU CONGRES 1 ▪ 1000 BRUSSELS ▪ TEL: 32(0) 229.39.11 ▪ FAX: 32(0) 219.41.51