Int. J. Electrochem. Sci., 10 (2015) 2802 - 2811
International Journal of
ELECTROCHEMICAL
SCIENCE
www.electrochemsci.orgSilicon/Graphite/Carbon Nanotubes Composite as Anode for
Lithium Ion Battery
Xinxi Li1, Guoqing Zhang1,*, Lei Zhang2, Meiling Zhong1, Xiaojiao Yuan1 1
School of Materials and Energy, Guangdong University of Technology, Guangzhou 510006, PR China
2
ChinaEnergineInternational(Holdings)Ltd,Beijing100176,PRChina *
E-mail: [email protected]
Received: 25 August 2014 / Accepted: 9 October 2014 / Published: 24 February 2015
Silicon/graphite/ carbon nanotubes (Si/G/CNTs) material was prepared by ball milling and annealing in a special condition. Each sample was characterized by XRD, SEM, and electrochemical testament.The results revealed that Si/G/CNTs exhibited an initial specific discharge capacity of 2326 mAh g−1. After 35 cycles, a high reversible capacity of 1363 mAh g−1 is still retained and the reversible capacity retention is nearly 86%. The improved electrochemical properties were due to the CNTs uniform dispersion in the inter-space of Si and graphite materials. This feature of CNTs not only has excellent electron conductivity, but can also alleviate the SEI film.
Keywords: lithium-ion battery; silicon; CNTs; electrochemical performance
1. INTRODUCTION
Lithium ion batteries(LIBs) as attractive energy storage devices have become ubiquitous power sources for mobile electronics, in the application of the increasing power and energy requirement, such as hybrid electric and electric vehicles. There has been intense interest in developing a type of high capacity electrode materials to surpass the capacities of electrode materials used in current LIBs[1-3]. In order to fulfill the demands, there are much research work that has been performed on anode materials with high specific capacities[4-6].
particles and then damages the electrode, which results in pulverization, capacity fading, and increased electric resistivity of the electrode. Apparently, it will cause much defect by poor interactions during Si particles and current collector when cycling [9-10].
For this reason, lots of researches have been carried out to overcome such problem in recently years, such as carbon pyrolysis on the Si surface [11-13], Si–carbon [14], amorphous Si thin film coating [15], Si–carbon–carbon nanotube composites [16-18], and Si–carbon composites with mechanical mixing [19-20] and many others.
However, such measures are still confronted with some issues, which include relatively high cost for commercialization, complicated synthetic processes for mass production, and unsatisfactory cycling performance.
Carbon nanotubes (CNTs) as Li insertion materials have received considerable interest[21]. Although CNTs in general are known to exhibit a higher reversible capacity than graphite as reported in the literatures [22-25], a large voltage hysteresis is commonly observed, which greatly limits their application as anode material for LIBs[26-28]. Nevertheless, CNTs have been proven to be a better choice than graphite as a matrix material for LIBs, they not only show electrical conductivity (resistivity <10−4 Ω﹒cm) [29-30] , they also demonstrate excellent physical properties including superior mechanical strength [31], large aspect ratio, structural flexibility, as well as tortuosity [32].
The present study attempts to prepared silicon/graphite/carbon nanotubes and assess their performance. For comparison, Si/G composite (without CNTs) was also prepared and the performance evaluated. The results show that CNTs play an important role on the electrochemical performance such as capacity and cycle-ability, and they also affect the characteristic of solid electrolyte interface (SEI).
2. EXPERIMENT
2.1 Annealing of the prepared silicon/Graphite/CNTs Samples
The nanosilicon (Si, 99.99%, Hefei Chemical Co. Ltd., China), graphite (Shenzhen BTR Co. Ltd., China) and CNTs (Shenzhen Chemical Co. Ltd., China) were oven dried for 20 hours before mailing, and placed in agate grinding mill. The mixed powders were milled for 18 hours at 350 rpm before the Si/G/CNTs or Si/G samples were collected. It should be noted that the molar ratio of n(Si): n(G): n(CNTs) was set to 0.22:0.70:0.08 and the molar ratio of n(Si): n(G) was set to 0.22:0.78.
The resulting product were calcined under flowing nitrogen, ensuring that it would not interfere with the chemical inertia of carbon, and the annealing temperature is 400 0C, 600 0C and 650 0C each for 6 hours.
2.2 Physical characterization
Energy dispersive spectrometer (EDS, INCA Energy 350, England) was employed to analyze the components of the prepared samples.
2.3. Electrochemical measurements
The electrochemical properties of the Si/G/CNTs composite electrodes were determined from Li/1 M LiPF6 in ethylene carbonate and diethyl carbonate (1:1, w/w)/ Si/G/CNTs composite cells using a LAND Battery Program control Test System. The Si/G/CNTs composite electrodes were fabricated by mixing 85:10:5 (w/w) of active material, a carbon (acetylene black) electronic conductor, and a polyvinylidene fluoride binder, using N-methyl-2-pyrrolidine as solvent. After drying the obtained slurry overnight under a vacuum at 100 °C, the mixture was pressed onto an aluminum sheet. Li was used as the counter electrode. The cells were assembled in a glove box. Charge–discharge cycle tests were performed at a constant current density of 350 mAg-1 over a potential range of 0.02 V to 1.5V.
Cyclic voltammetry (CV) and electrochemical impedance spectroscopy (EIS) of electrode measurement were carried out at PCTI4-750 electrochemical work station (USA, EG&G Corporation). CV testing condition was performed between 0.01 and 1.2V at a scan of 0.1mv.s-1, and EIS was tested by the frequency range from 0.1 kHz to 1 MHz with an amplitude of 5 mV.
3 RESULTS AND DISSCUSSION
3.1 XRD analysis
0 20 40 60 80 100
Pure Si Si/G Si/G/CNTs
2(Degrees)
In
te
n
s
it
y
(
a
.u
.)
(002) (111)
(220) (311)
(400) (331) (422)
[image:3.596.157.440.500.717.2]
The XRD patterns of Si/G/CNTs composite, Si/G composite, and silicon materials are presented in Fig. 1 which shows no obvious miscellaneous phase in the XRD patterns of composite. All diffraction peaks can be indexed based on a face-centered cubic spinel structure with an Fd3m space group. The composite material shows peaks at 2θ = 28.4°, 47.2°, 54.6°, 69.3°, 76.3°and 87.9°, and they are indexed as the (111), (220), (311), (400), (331), and (442) reflections of composite, respectively; whereas, that peaks at 2θ =26.4°, 54.6°, 83.5° corresponds to graphite diffraction peaks. This figure shows that Si/G/CNTs composite did not change their crystal structure. Under the effects of CNTs, the peak becomes narrower and the diffraction intensity greater.
3.2 SEM analysis
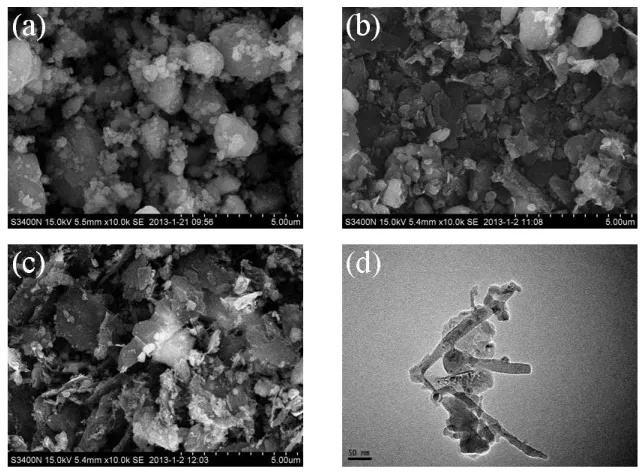
Fig. 2 shows the scanning electron micrograph of three samples: single silicon, Si/G and Si/G/CNTs composite materials. As seen in Figure 2a, Si powders show a uniform distribution with an average particle diameter below 500 nm. Fig 2b shows that Si is homogeneously distributed in graphite matrix, which would provide a buffer during the insertion/extraction of lithium ions. Fig 2c reveals Si/G structure coated by CNTs. The Si/G/CNTs composite structure features more agglomerate particles, and the CNTs distribute uniformly on the surface of the Si/G particles. Fig 2d depicts the CNTs tubular morphology characterized by TEM.
Figure 2. SEM micrographs of samples: a pure Si, b Si/G, c Si/G/CNTs; d TEM image of Si/G/CNTs
3.3 Electrochemical performance
[image:4.596.133.454.408.645.2]
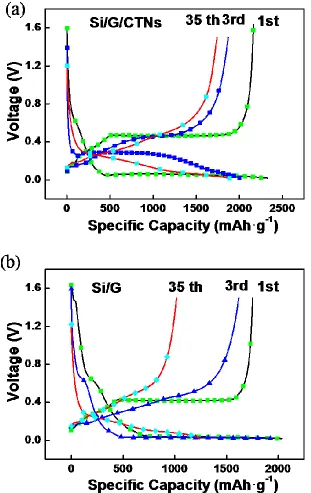
0.02~0.18 V, which is mainly caused by the alloying process of silicon with lithium and the insertion of lithium ions into the carbon inter-space.
Figure 3. a Charge–discharge curves of Si/G/CNTs for first, second, and 35th cycle; b Charge– discharge curves of Si/G for first, second, and 35th cycle;
[image:5.596.131.442.127.620.2]
phase. However, Si/G and Si/G/CNTs display clear differences in terms of charge-discharge curves. Compared to Si/G, Si/G/CNTs electrode not only demonstrates a lower intercalation voltage plateau in the first cycle, but shows a higher-extraction voltage plateau, which should be responsible for the reduced charge/discharge capacity of Si/G/CNTs electrode. Moreover, the potential and the length of plateaus for two electrodes display different patterns accompanied with different cycles. From the second to the 35th cycle, as the plateau length increases, the potential difference between lithium insertion and lithium extraction plateau of Si/G/CNTs electrode decreases. However, the potential difference of Si/G electrode decreases initially and then starts increasing as the cycle number increased. After the 35th cycle, the potential difference between lithium insertion and lithium extraction of Si/G electrode is much larger than that of Si/G/CNTs electrode, and meanwhile, the length of its plateaus decrease rapidly. These results prove that the conductive network of Si/G/CNTs electrode is maintained during the prolonged cycling, while the microstructure of Si/G electrode is destroyed severely. This is consistent with the cycle performance of Si/G/CNTs electrode.
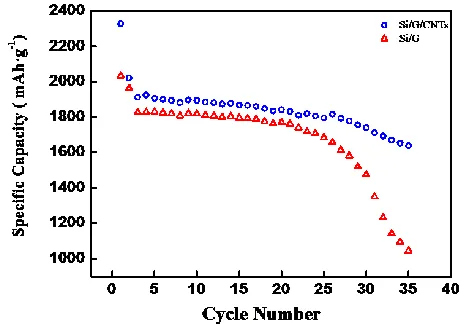
Figure 4 shows the variation of specific capacity versus cycle number of Si/G and Si/G/CNTs cycled at a current density of 350 mAg-1. The Si/G electrode delivers an initial discharge capacity of 2032 mAhg−1 with an irreversible loss of 247 mAhg−1 .However, a poor capacity retention ability was demonstrated. After 35 cycles, the reversible capacity retains only 903.5 mAhg−1, with capacity loss of about 57%. In contrast, Si/G/CNTs composite exhibits much better capacity retention. The first discharge and charge capacity is 2326 mAh g−1 and 2163 mAh g−1, respectively. The Si/G/CNTs composite electrode has a rechargeable capacity of above 1363 mAh g−1 after 35 cycles, meanwhile, the reversible capacity retention is more than 86%.The Si/G/CNTs composite electrode displayed much better electrochemical performance than that of Si/G electrodes. When Si/G reacts with lithium, there is a large volume expansion, inducing cracking and pulverization. But for Si/G/CNTs, the volume expansion and contraction of Si/G compostie can be effectively reduced because of the flexible carbon nanotubes. Furthermore, carbon nanotubes also provide a highly conductive medium for electron transfer during the insertion and extraction of lithium. That is the main reason that the composite material with CNTs can greatly improve their cycling stability.
[image:6.596.168.400.563.725.2]
A slow scan cyclic voltammogram (CV) of the Si/G and Si/G/CNTs composite electrode at 0.1 mV s−1 is demonstrated in Fig.5. A clear irreversible peak at 0.67 V in the first cycle is ascribed to the formation of the interface between Si/G/CNTs composite and the electrolyte, and this peak has disappeared in the following cycles, indicating the formation of a stable SEI film on the electrode surface with the aid of the graphite and CNT [33].
Figure 5. a Cyclic voltammograms performances of Si/G/CNTs; b Cyclic voltammograms performances of Si/G.
[image:7.596.165.464.179.636.2]
These observations from cyclic voltammetry are similar to those found in previous reports. The magnitudes of both the cathodic and the anodic peaks increase significantly with cycling, implying activation of more material to react with Li and an enhanced electronic kinetics process [34]. Although Si/G can be observed at anodic indicating the formation of SEI film on the electrode, which is similar with Si/G/CNT at first cycle, the subsequent cycles show the reversible peaks are resembling with Si/G/CNT. This is perhaps because CNTs provide the path for lithium ion insertion and extraction from electrode, which enhance the reversible performance.
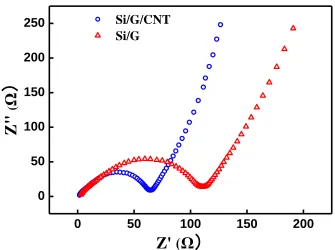
To further investigate the mechanisms for the improved cycle ability of Si/G/CNTs composite electrode, EIS of Si/G and Si/G/CNTs composite material electrodes in the open circuit potential before and after cycling was compared in Fig.6. As shown, all of the Nyquist plots consist of one depressed semicircle at high frequencies (HF) and a straight line at low frequencies (LF). Semicircle with the active substance particles charge-transfer resistance between the units corresponds to slash then corresponds to the lithium-ion diffusion in the material body impedance phase [35]. The diameter of the HF semicircle of the Si/G/CNTs composite electrode is much smaller than that of the Si/G electrode, which indicates that the resistance of the former one is much lower. The charge-transfer resistance of Si/G/CNTs composite particles is 65Ω, but that of the Si/G composite particles is 111Ω. This phenomenon indicating the presence of a small amount of carbon nanotubes in composite materials that can make up silicon-based electrodes embedded in lithium. More importantly, during the de-embedment phase of lithium ion, the volume contraction of the active material particles affects the integrity of the conductive network of the electrode with lithium–silicon alloys silicon to a single qualitative change. The existence of carbon nanotubes may provide compensation for electronic conductivity, preventing lithium ion extracting the lithium–silicon alloys, and then leads to the improvement of the cycle efficiency [36].
0 50 100 150 200
0 50 100 150 200
250 Si/G/CNT
Si/G
Z'
(
Ω
)
Z
"
(
Ω
)
[image:8.596.116.451.489.739.2]
4. CONCULSION
Si/G/CNTs composite was prepared by ball milling followed by annealing method in this study. In order to assess the effects of CNTs, the Si/G composite sample without CNTs was also prepared. And theseobtained samples were thoroughly characterized by XRD, SEM, and TEM electrochemical testament.The results showed that Si/G/CNTs composite not only had ahigher discharge capacity, but also exhibited a better cycling performance than Si/G composite. These superior electrochemical performancewas attributed to the uniform dispersion of CNTs in the interspace of Si and graphite materials, which have excellent conductivity. In addition, CNTs can also effectively alleviate SEI film.
ACKNOWLEDGEMENTS
This work was financially supported by 2011 Key Technical Project of Strategic Emerging Industries (2011A010802001) and Projects financed by the National Fund for international science and technology cooperation (2013DFG50150).
References
1. A. S AricÒ, P. G. Bruce, B. Scrosati, J. M. Tarason, W. V. Schalkwijk. Nat. Mater., 4 (2005) 366. 2. H. Li, Z. X. Wang, L. Q. Chen, X. Huang. Adv. Mater., 21 (2009) 4593.
3. W. M. Zhang, J. S. Hu, Y. G. Guo, S. F. Zheng, L. S. Zhong, W. G. Song, L. J. Wan. Adv. Mater., 20 (2008), 1160.
4. Y. G. Guo, J. S. Hu, L. J. Wan. Adv. Mater., 20 (2008) 2878.
5. L. X. Yuan, Z. H. Wang, W X Zhang, X. L. Hu, J. T Chen, Y. H. Huang, J.B. Goodenough. Energy. Environ. Sci., 4 (2011) 269.
6. X. L. Wu, L. Y. Jiang, F. F. Cao, Y.G. Guo, L. J. Wan. Adv. Mater., 21 (2009) 2710. 7. P. Poizot, S. Laruelle, S. Grugeon, L. Dupont, J.M. Tarascon. Nature 407 (2000) 496. 8. U. Kasavajjula, C. Wang, A. Appleby. J. Power Sources 163 (2007) 1003.
9. F. F. Cao, J. W. Deng, S. Xin, H. X. Ji, O.G. Schmidt, L. J. Wan, Y. G. Guo. Adv. Mater., 23 (2011) 4415.
10.J. Li, D. B. Le, P. P. Ferguson, J. R. Dahn, Electrochim. Acta., 55 (2010) 2991. 11.J. R. Szczech, S. Jin, Energy & Environmental Science 4 (2011) 56.
12.M. H. Park, M. G. Kim, J. Joo, K. Kim, J. Kim, S. Ahn, Y. Cui, J. Cho, Nano Letters 9 (2009) 3844.
13.T. D. Bogart, D. C. Oka, X. T. Lu, M. G, C. M. Wang, B. A. Korgel. ACS. Nano.,8 (2014) 915 14.H. Kim, M. Seo, M.-H. Park, J. Cho, Angew. Chem. Int. Edit., 49 (2010) 2146.
15.H. Jusef, S. Bruno, Angew. Chem. Int. Edit., 49 (2010) 2371. 16.J. Bae, S. H. Cha, J. Park, Macromol. Res., 21 (2013) 826.
17.H. Ma, F.Y. Cheng, J. Chen, J.Z. Zhao, C.S. Li, Z.L. Tao, J. Liang, Adv. Mater., 19 (2007) 4067. 18.S. Renganathan, G. Sikha, S. Santhanagopalan, R.E. White, J. Electrochem. Soc., 157 (2010) 155. 19.Y.M. Chiang, Science 330 (2010) 1485.
20.J.Y. Huang, L. Zhong, C.M. Wang, J.P. Sullivan, W. Xu, L.Q. Zhang, S.X. Mao, N. S. Hudak, X.H. Liu, A. Subramanian, H. Fan, L. Qi, A. Kushima, J. Li, Science 330 (2010) 1515.
21.S. Iijima, Nature 354 (1991) 56.
23.Y. Wu, J.P. Wang, K.L. Jiang, S.S. Fan. Front. Phys., 9 (2014) 351.
24.T. Ishihara, A. Kawahara, H. Nishigushi, M. Yoshio, Y. Takita, J. Power Sources 97 (2001) 822. 25.G. Maurin, F. Henn, B. Simon, J. F. Colomer, J. B. Nagy, Nano Lett 11(2001) 175.
26.H. Shimoda, B. Gao, X. P. Tang, A. Kleinhammes, L. Fleming, Y. Wu, O. Zhou, Phys. Rev. Lett., 88 (2002) 155.
27.B. Gao, A. Kleinhammes, X. P. Tang, C. Bower, L. Fleming, Y. Wu, O. Zhou. J. Chem. Phys. Lett., 307 (1999) 153.
28.A. S. Claye, J. E. Fischer, C. B. Huffmann, A. G. Rinzler, R. E. Smalley, J Electrochem. Soc., 147 (2000) 2845.
29.A. Thess, R. Lee, P. Nikolaev, H. Dai, P. Petit, J. Robert, C. Xu., Y. H. Lee, S. G. Kim, A. G. Rinzler, D. T. Colbert, G. Scuseria, D. Tománek, J. E. Fischer, R.E. Smalley, Science 273 (1996) 483.
30.B. Koo, P. Goli, A. V. Sumgant, P. C. D. S. Claro, T. Rajh, C. S. Johnson, A. A. Balandin, E. V. Shevchenko. ACS Nano, 8 (2014) 7202.
31.M. F. Yu, B. S. Files, S. Arepalli, R. S. Ruoff. Phys. Rev. Lett., 84 (2000) 5552.
32.B. G. Demczyk, Y. M. Wang, J. Cumings, M. Hetman, W. Han, A. Zettl, R. O. Ritchie, Mater. Sci. Eng. A., 334 (2002) 173.
33.I. Kovalenko, B. Zdyrko, A. Magasinski, B. Hertzberg, Z. Milicev, R. Burtovyy, I. Luzzinov, G. Yushin, Science 334 (2011) 75.
34.S. L. Chou, J. Z. Wang, M. Choucair, H. K. Liu, J.A. Stride, S. X. Dou, Electrochem. Commun., 12 (2010) 303.
35.C. Wang, A. J. Appleby, F. E. Little Electrochim. Acta., 46 (2001)1793. 36.Y. R. Ren, J.N. Ding, N.Y. Yuan. J. Solid. State. Electrochem., 16 (2012) 1453.