Int. J. Electrochem. Sci., 8 (2013) 6839 - 6850
International Journal of
ELECTROCHEMICAL
SCIENCE
www.electrochemsci.org
Simultaneous Determination of Epinephrine, Dopamine,
Ascorbic Acid and Uric Acid by Polydopamine-nanogold
Composites Modified Electrode
Ying Zhang1,2, Wang Ren1,2,*, Shulin Zhang3
1
Key Laboratory of Green Catalysis of Sichuan Institutes of High Education, Zigong 643000, China 2
College of Chemical and Pharmaceutical Engineering, Sichuan University of Science and Engineering, Zigong 643000, China
3
College of Materials and Chemical Engineering, Sichuan University of Science and Engineering, Zigong 643000, China
*
E-mail: [email protected]
Received: 15March 2013 / Accepted: 13 April 2013 / Published: 1May 2013
A facile polydopamine (PDA)-nanogold composites modified glassy carbon electrode (GCE) was prepared by a one-pot method and used for the sensitive determination of epinephrine (EP), dopamine (DA), ascorbic acid (AA) and uric acid (UA) simultaneously in this work. Under a mild spontaneous reaction condition, DA as a reducing agent and monomer, and HAuCl4 as an oxidant to trigger DA polymerization and the source of gold nanoparticles, were mixed to yield composites of DA polymer and gold nanoparticles, which were then anchored on GCE by electropolymerization of the remaining DA monomer. The resultant electrode exhibited excellent electrocatalytic redox activities toward EP, DA, AA and UA. Furthermore, although the oxidation peaks of EP and DA at the modified electrode appeared at a same potential of 230 mV, three well-defined oxidation peaks for AA, EP, DA and UA (50, 230, 380 mV) and two non-interference reduction peaks for EP (-150 mV) and DA (190 mV) were presented. By virtue of this interesting phenomenon, for the first time the simultaneous detection of EP, DA, AA and UA using the proposed sensor has been achieved by cyclic voltammetry (CV) and square wave voltammetry (SWV). The calibration curves for EP, DA, AA and UA were acquired in the range of 1.0–80.0 μM, 1.0–80.0 μM, 40.0–1000.0 μM, and 0.8–100.0 μM with the detection limits (S/N = 3) of 0.1 μM, 0.08 μM, 5.0 μM and 0.06 μM, respectively. The proposed method is simple, sensitive and convenient, and was successfully applied to the determination of EP, DA, AA and UA in human blood serum and urine samples.
Keywords: Polydopamine, Nanogold, Epinephrine, Dopamine, Ascorbic acid, Uric acid 1. INTRODUCTION
Concentrations of plasma catecholamines and their metabolites are often useful for diagnosis and evaluation of therapeutic and pharmacodynamic effects for neurological, psychiatric and cardiovascular disorders [2]. For instance, EP, also known as adrenaline, plays a central role during physical or mental stress and also stimulates a series of actions of the sympathetic nervous system. Abnormalities of DA concentration levels may lead to several diseases such as Parkinson’s disease and
Schizophrenia. Medically, EP and DA have been used in hypertension, bronchial asthma, cardiac
surgery, myocardial infarction and organic heart disease as common emergency healthcare medicine [3]. Therefore, the ability to determine EP and DA has attracted much attention of biological and electroanalytical researchers. However, the main problem of measuring the monoamines by solid electrodes is the overlapping voltammetric signal of themselves and the large excesses of coexisting substances in biological tissues such as ascorbic acid (AA) and uric acid (UA). Similarly, AA, a vital vitamin in human, is known to take part in several biological reactions, and prevents and treats the scurvy, common cold, mental illness, infertility and cancer [4]. UA is the primary end-product of purine metabolism. Abnormal levels of UA in the body are symptoms of several diseases such as gout, hyperuricemia, Lesch-Nyan syndrome, cardiovascular and kidney diseases [5-6]. Till date, many different strategies have been employed for the modification of the electrode surface in order to detect EP, DA, AA and UA with high selectivity and sensitivity [9-35]. Some reports concentrated on simultaneous determination of AA, UA and either EP or DA [10-31], while others tried to deal with differentiating DA and EP [9, 32-35]. To the best of our knowledge, there is not an electrochemical sensor exploited for simultaneous determination of EP, DA, AA and UA.
The aim of this study is to design an electrochemical sensor for determination of EP, DA, AA and UA simultaneously. Recently, the polydopamine (PDA) film, containing amine groups and phenolic hydroxyl groups, has attracted tremendous attention for the reducibility of DA in the process of self-polymerization, its surface-adherent on bulk material surfaces and permselectivity toward electroactive counterions due to the rich charges [36-38]. On the other hand, gold nanoparticle (nanogold) with high surface-to-volume ratio and surface free energy has been used for the nanoelectronic, biological and bioanalytical applications [30-31]. In this work, combining with above merits of PDA and gold nanoparticles, a PDA-nanogold composites modified GCE was fabricated by a one-pot electropolymerization protocol using DA as a reducing agent and a monomer, while HAuCl4 as an oxidant to trigger DA polymerization and gold nanoparticles production. On the basis of the well separationof reduction peaks of EP and DA and that of oxidation peaks of AA and UA at composites modified electrode, a sensitive and rapid electrochemical method for simultaneous determination of EP, DA, AA and UA was set up for routine analysis.
2. EXPERIMENTAL PART
2.1. Apparatus
glassy carbon electrode (GCE) (diameter is 4.0 mm) was used as a working electrode. A saturated calomel electrode (SCE) and a platinum wire was performed as reference and counter electrode, respectively. The SEM image was recorded on scanning electron microscope (TESCAN VEGA 3 EasyProbe, Czekh). Various buffer solutions were prepared by PHS-3CT pH meter (Kangyi, Shanghai). All measurements were carried out at a constant temperature (25±1°C).
2.2. Chemicals and solutions
Ascorbic acid was obtained from Sinopharm Chemical Reagent Co. Ltd (Shanghai, China). Epinephrine, uric acid and 3-hydroxytyramine hydrochloride, chloroauric acid (HAuCl4) were purchased from Sigma-Aldrich (America). Phosphate buffered solutions (PBS) with various pH were prepared by mixing the stock solutions of 0.1 M KCl, 0.1 M KH2PO4 and Na2HPO4, and used as base solutions for the electrochemical testing. The working solutions of EP, DA, AA and UA were prepared just prior to use. All chemicals used were of analytical grade and doubly distilled water was used throughout.
2.3. Fabrication of the PDA-nanogold composites modified electrode
Prior to modification, the bare GCE was polished with 0.05 μm alumina slurry on the polishing cloth and then rinsed thoroughly with 1:1 HNO3 solution, acetone and distilled water. The modified electrode was fabricated by a one-pot electropolymerization according to the relevant literature [39] with a little modification.
bare GCE
d
ip
-c
o
at
in
g
Electr opoly
meriz ation
the modified GCE
DA
HAuCl4 Au0
PDA
DA HAuCl4 PDAor DA oligomers nano-Au
Scheme 1. Schematic illustration of the construction of the PDA-nanogold composites modified electrode
meanwhile, some of the PDA-nanogold composites were electrochemically codeposited onto the GCE surface during the oxidative polymerization of excess DA monomer. Finally, the resultant composites modified electrode was thoroughly washed with distilled water.
2.4. Procedure
The three-electrode system was immersed into 0.05 M PBS containing different concentrations of EP, DA, AA and UA. Then, The CVs and SWVs were recorded in suitable potential range. The quantitative analysis of these compounds could be achieved on the basis of the anodic peak currents of AA and UA and cathodic peak currents of EP and DA.
3. RESULTS AND DISCUSSION
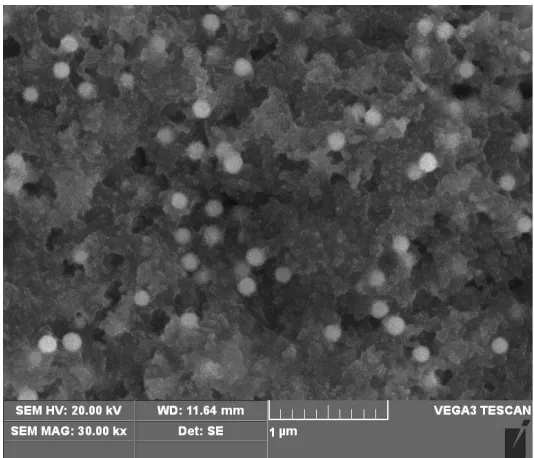
3.1 SEM analysis
Scanning electronic microscopy (SEM) image of the PDA-nanogold composites film was shown in Fig. 1.
Figure 1. SEM micrograph of the PDA-nanogold composites film
[image:4.596.164.431.373.602.2]
3.2 Individual electrocatalytic activity of DA, AA, EP and UA
-0.6 -0.4 -0.2 0.0 0.2 0.4 0.6 -18
-12 -6 0 6 12
AA
E / V
i
/
A
UA
DA EP
7.10 A
A
-0.6 -0.4 -0.2 0.0 0.2 0.4 0.6 -20
0 20 40 60
DA
EP
E / V
i
/
A
EP
18.4 A
AA
UA
DA B
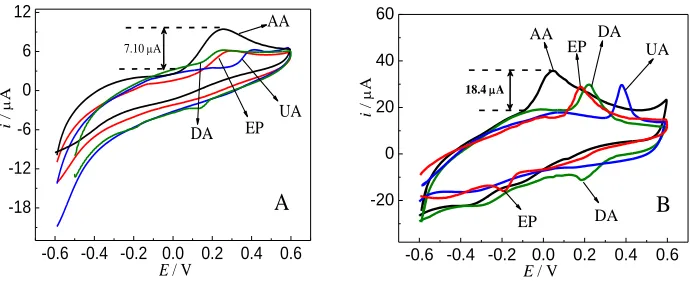
Figure 2. CVs of DA (20.0 μM), EP (30.0 μM), AA (600.0 μM) and UA (30.0 μM) singly at (A) a bare GCE and (B) modified electrode in PBS (pH 7.0).
The individual electrochemical behaviors of DA, AA, EP and UA at bare GCE (Fig. 2A) and PDA-nanogold modified electrode (Fig. 2B) were investigated by CV. At the bare GCE, the CVs of AA, EP and UA show the irreversible electrochemical behavior and a drawn out oxidation peak at 260 mV, 280 mV and 400 mV, respectively. Also, the CV of DA shows quasi-reversible electrochemical behavior with the oxidation and reduction peak potential at 260 mV and 130 mV, respectively. As is clear, the separation of the oxidation peak potentials for DA, AA and EP is not large enough to obtain good selectivity at the bare GCE. In contrast, the CVs of AA, EP, DA and UA at the modified electrode display the lower oxidation over-potentials and exhibits sharp oxidation peaks at 50 mV, 190 mV, 230 mV and 380 mV with greatly enhanced peak currents around 2.6 times higher than that at the bare GCE, suggesting a strong enhancement in the electron transfer rates of these compounds at the modified electrode (Fig. 2B). Additionally, a quasi-reversible redox pair for EP and a pair of symmetric redox peaks with a smaller peak separation (40 mV) for DA were obtained at the modified electrode, implying that the reversibility was notably improved by the PDA-nanogold composites film.
Although EP and DA had similar oxidation potentials at the modified electrode, their reduction peaks appeared at -190 mV and 180 mV, respectively. The results above demonstrated that the PDA-nanogold composites film not only showed excellent catalytic activity for the redox reaction of EP, DA, AA and UA, but also dramatically enlarged the peak separation of the four compounds, hence indicating that individual or simultaneous determination of EP, DA, AA and UA in mixture was feasible.
3.3 Effects of pH on the electrochemical response of EP, DA, AA and UA
[image:5.596.128.473.110.252.2]
that protons have taken part in their electrode processes [12]. Although separations between their oxidation peaks diminished slightly with the increasing of pH, the resolution was large enough to distinguish them. In addition, DA and EP had good current responses in weak alkaline solution, but the current responses for AA and UA oxidation were better under acid conditions. Considering the influence of pH on the peak currents mentioned above and pH of physiological condition, pH 7.0 was chosen for the test.
3.4 Electrochemical oxidation of mixture of AA, DA, EP and UA at modified electrode
-0.4 -0.2 0.0 0.2 0.4 0.6 0.8
-15 0 15 30 45
b
i / AE / V DA+EP UA AA
a
DA EP-0.4 -0.2 0.0 0.2 0.4 0.6 0.8
-20 0 20 40 60 b d DA EP i / A
E / V DA EP
DA+EP
UA AA
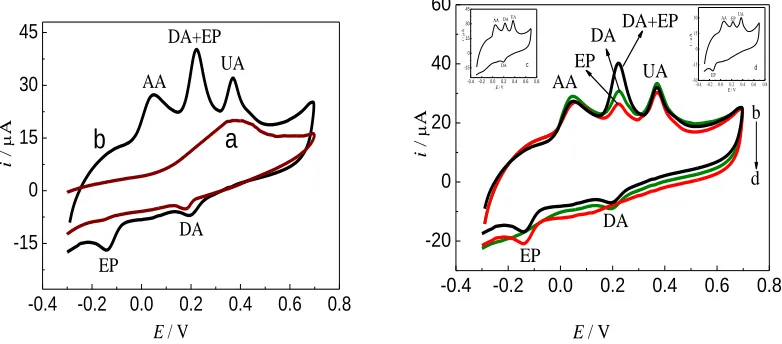
Figure 3. CVs of a mixture containing (a) and (b) EP (20.0 μM)+DA (20.0 μM)+AA (500.0 μM)+UA(30.0 μM); (c) DA (20.0 μM)+AA (500.0 μM)+UA(30.0 μM); (d) EP (20.0 μM)+AA (500.0 μM)+UA(30.0 μM) at the bare GCE (a) and the modified electrode (b, c, d). Scan rate: 50 mV/s.
Fig. 3 shows the CV responses of the bare GCE and the modified electrode in mixture of EP, DA, AA and UA. As seen from Fig. 3a, the bare GCE gives a single broad oxidation peak at around 400 mV and a small reduction peak at 180 mV with poor sensitivity, and fails to distinguish EP, DA, AA and UA in their mixture. In comparison, the modified electrode exhibited high current signals and well-defined three oxidation peaks for AA, DA/EP and UA at 50, 230 and 380 mV, respectively (Fig. 3b). The CVs of EP and DA illustrated both oxidation and reduction peaks in the redox process. Although oxidative peaks overlapped at the same potential for EP and DA, the reduction peaks for EP (-150 mV) and DA (190 mV) were clearly separated from each other. The oxdation peak separations between AA and DA/EP (180 mV), DA/EP and UA (150 mV), coupling with the reduction peak separation between EP and DA (340 mV), are sufficient enough to selective or simultaneous detection of EP, DA, AA and UA in their mixture.
Moreover, the CVs of a mixture of AA, DA and UA (Fig. 3c) and that of AA, EP and UA (Fig. 3d) at the modified electrode are also given. It can be seen that the oxidation peak current of the mixture of EP and DA (Fig. 3b) was equal to the sum of individual peak current of EP and DA. Thus,
-0.4-0.20.00.20.40.60.8
-30 -15 0 15 30 EP d EPUA i / A
E / V AA
-0.4 -0.20.00.20.40.60.8 -15 0 15 30 45 DA i / A
E / V
DA UA AA
[image:6.596.103.494.246.418.2]
based on this phenomenon, the concentrations of EP and DA could also be determined simultaneously according to the reference [9] which was relatively complicated comparing to this work.
3.5 Selective and Simultaneous determination of AA, DA, EP and UA
-0.4 -0.2 0.0 0.2 0.4 0.6 0.8 -40 -20 0 20 40 A EP f a UA EP AA i / A
E / V -0.2 0.0 0.2 0.4 0.6
-20 0 20 40 DA h a DA UA AA i / A
E / V
B
-0.2 0.0 0.2 0.4 0.6
-20 0 20 40 60 DA f a UA DA AA i / A
E / V
C
-0.2 0.0 0.2 0.4 0.6
-40 -20 0 20 40 60 DA j a UA DA AA i / A
E / V
D
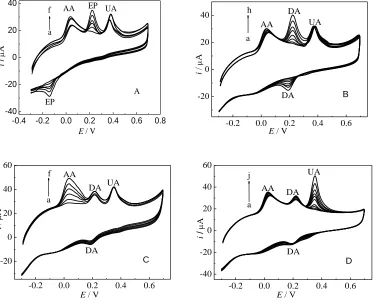
Figure 4. CVs of the mixture containing AA, UA and either EP or DA with different concentrations in PBS (pH 7.0) at the modified electrode. Scan rate: 50 mV/s.(A) Containing 600.0 μM AA, 30.0 μM UA and different concentrations of EP (from a to f): 0.8, 4.0, 10.0, 20.0, 30.0, 50.0 μM.(B) Containing 600.0 μM AA, 30.0 μM UA and different concentrations of DA (from a to h): 0.8, 1.0, 4.0, 10.0, 20.0, 30.0, 40.0, 60.0 μM. (C) Containing 30.0 μM UA, 20.0 μM DA and different concentrations of AA (from a to f): 40.0, 100.0, 300.0, 600.0, 1000.0, 1500.0 μM. (D) Containing 600.0 μM AA, 20.0 μM DA and different concentrations of UA (from a to j): 0.6, 1.0, 2.0, 5.0, 10.0, 20.0, 30.0, 50.0, 80.0, 100.0 μM
[image:7.596.116.489.174.478.2]
above, the modified electrode could be applied to the simultaneous determination of AA, DA, EP and UA mixture by means of the oxidation peak currents of AA and UA and the reduction peak currents of EP and DA.
-0.4 -0.2 0.0 0.2 0.4
-20 -15 -10 -5 0
E / V
i / A h a A EP DA
-0.4 -0.2 0.0 0.2 0.4 0.6 0.8
-20 0 20 40 60 80 100
E / V
i / A UA DA+EP AA h a B
Figure 5. SWVs of the simultaneous determination of EP, DA AA and UA using the modified electrode in PBS (pH 7.0). The concentrations of EP, DA, AA and UA (from a to h) were in the linear range of EP (1.0, 2.0, 4.0, 8.0, 10.0, 20.0, 50.0, 80.0 μM), DA (1.0, 5.0, 10.0, 20.0, 30.0, 40.0, 60.0, 80.0 μM), AA (40.0, 100.0, 200.0, 300.0, 400.0, 500.0, 800.0, 1000.0 μM), and UA (0.8, 2.0, 10.0, 20.0, 30.0, 50.0, 80.0, 100.0 μM). Inset: the plot of peak current vs. the concentrations of EP, DA, AA and UA.
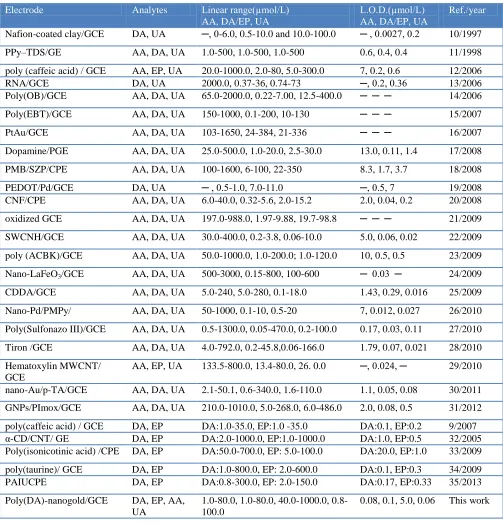
The SWV was used for the simultaneous determination of EP, DA, AA and UA. Fig. 5 illustrates the SWV responses of the proposed electrode towards EP, DA, AA and UA when the concentrations of the four species increase synchronously. It can be seen that the oxidation peak currents for EP and DA and the reduction peak currents for AA and UA increase linearly with their concentrations. The SWV responses of the modified electrode towards the simultaneous determination of these four species are listed in Table 1. The relative standard deviation (RSD) of the peak currents was less than 2.9% for these four species at modified electrode (n = 10). In comparison with other electrochemical sensors, the proposed modified electrode exhibited improved analytical performance as shown in Table 2.
Table 1. Analytical characteristics for the simultaneous determination of EP, DA, AA and UA by the proposed method
Analyte Linear range
(μM)
Linear regression equation
(i: μA, C: μM)
Correlation coefficient Detection limit
(μM)
EP 1.0 -80.0 ipc, EP =0.1272 C+ 0.9978 0.9990 0.1
DA 1.0 -80.0 ipc, DA = 0.1613 C+ 0.7967 0.9988 0.08
AA 40.0 -1000.0 ipa, AA = 0.0037C+ 9.0066 0.9977 5.0
UA 0.8 -100.0 ipa, UA =0.3547C+ 3.2452 0.9988 0.06
0 200400600800 1000 0 10 20 30 40 UA AA ipa / A
C / M
0 20 40 60 80 0 3 6 9 12 15 EP DA
C / M ipc
/
[image:8.596.114.484.148.283.2] [image:8.596.45.552.626.733.2]
Table 2. Comparison of the proposed method with other electrochemical methods for the simultaneous determination of AA, UA, EP and/or DA.
Electrode Analytes Linear range(µmol/L)
AA, DA/EP, UA
L.O.D.(µmol/L) AA, DA/EP, UA
Ref./year
Nafion-coated clay/GCE DA, UA ─, 0-6.0, 0.5-10.0 and 10.0-100.0 ─ , 0.0027, 0.2 10/1997
PPy–TDS/GE AA, DA, UA 1.0-500, 1.0-500, 1.0-500 0.6, 0.4, 0.4 11/1998
poly (caffeic acid) / GCE AA, EP, UA 20.0-1000.0, 2.0-80, 5.0-300.0 7, 0.2, 0.6 12/2006
RNA/GCE DA, UA 2000.0, 0.37-36, 0.74-73 ─, 0.2, 0.36 13/2006
Poly(OB)/GCE AA, DA, UA 65.0-2000.0, 0.22-7.00, 12.5-400.0 ─ ─ ─ 14/2006
Poly(EBT)/GCE AA, DA, UA 150-1000, 0.1-200, 10-130 ─ ─ ─ 15/2007
PtAu/GCE AA, DA, UA 103-1650, 24-384, 21-336 ─ ─ ─ 16/2007
Dopamine/PGE AA, DA, UA 25.0-500.0, 1.0-20.0, 2.5-30.0 13.0, 0.11, 1.4 17/2008
PMB/SZP/CPE AA, DA, UA 100-1600, 6-100, 22-350 8.3, 1.7, 3.7 18/2008
PEDOT/Pd/GCE DA, UA ─ , 0.5-1.0, 7.0-11.0 ─, 0.5, 7 19/2008
CNF/CPE AA, DA, UA 6.0-40.0, 0.32-5.6, 2.0-15.2 2.0, 0.04, 0.2 20/2008
oxidized GCE AA, DA, UA 197.0-988.0, 1.97-9.88, 19.7-98.8 ─ ─ ─ 21/2009
SWCNH/GCE AA, DA, UA 30.0-400.0, 0.2-3.8, 0.06-10.0 5.0, 0.06, 0.02 22/2009
poly (ACBK)/GCE AA, DA, UA 50.0-1000.0, 1.0-200.0; 1.0-120.0 10, 0.5, 0.5 23/2009
Nano-LaFeO3/GCE AA, DA, UA 500-3000, 0.15-800, 100-600 ─ 0.03 ─ 24/2009
CDDA/GCE AA, DA, UA 5.0-240, 5.0-280, 0.1-18.0 1.43, 0.29, 0.016 25/2009
Nano-Pd/PMPy/ AA, DA, UA 50-1000, 0.1-10, 0.5-20 7, 0.012, 0.027 26/2010
Poly(Sulfonazo III)/GCE AA, DA, UA 0.5-1300.0, 0.05-470.0, 0.2-100.0 0.17, 0.03, 0.11 27/2010
Tiron /GCE AA, DA, UA 4.0-792.0, 0.2-45.8,0.06-166.0 1.79, 0.07, 0.021 28/2010
Hematoxylin MWCNT/ GCE
AA, EP, UA 133.5-800.0, 13.4-80.0, 26. 0.0 ─, 0.024, ─ 29/2010
nano-Au/p-TA/GCE AA, DA, UA 2.1-50.1, 0.6-340.0, 1.6-110.0 1.1, 0.05, 0.08 30/2011
GNPs/PImox/GCE AA, DA, UA 210.0-1010.0, 5.0-268.0, 6.0-486.0 2.0, 0.08, 0.5 31/2012
poly(caffeic acid) / GCE DA, EP DA:1.0-35.0, EP:1.0 -35.0 DA:0.1, EP:0.2 9/2007
α-CD/CNT/ GE DA, EP DA:2.0-1000.0, EP:1.0-1000.0 DA:1.0, EP:0.5 32/2005
Poly(isonicotinic acid) /CPE DA, EP DA:50.0-700.0, EP: 5.0-100.0 DA:20.0, EP:1.0 33/2009
poly(taurine)/ GCE DA, EP DA:1.0-800.0, EP: 2.0-600.0 DA:0.1, EP:0.3 34/2009
PAIUCPE DA, EP DA:0.8-300.0, EP: 2.0-150.0 DA:0.17, EP:0.33 35/2013
Poly(DA)-nanogold/GCE DA, EP, AA,
UA
1.0-80.0, 1.0-80.0, 40.0-1000.0, 0.8-100.0
0.08, 0.1, 5.0, 0.06 This work
3.6 Interferences, Repeatability and Recovery
The repeatability of the modified electrode was good. The electrochemical activity of the modified electrode remained 97% after 50 times’ measurements. It was also found that the modified electrode showed only about 8% current decrease after 30 days for the storage in dry state at 4 °C. The used modified electrode could be regenerated in PBS of pH 7.0 by CV from -1.0 to +1.0 V at 50 mV/s and the renewed electrode was found to give the stable response for the four components within the error limits.
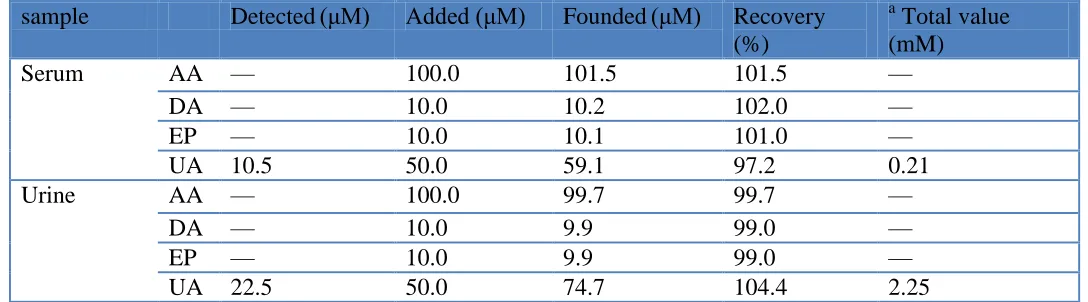
3.7 Sample analysis
[image:10.596.26.570.385.536.2]Human serum and urine samples were selected as real samples for analysis by the proposed method. Human serum samples were centrifuged before the experiment. To ascertain the correctness of the results, the standard addition method was applied to the quantitative analysis of EP, DA, AA and UA in real samples. Appropriate amount of samples were diluted to 10 mL mark with 5 mL PBS (0.1 mol/L, pH 7.0) and distilled water for test. The average recoveries of the spiked standard substances ranged between 97 % and 105 %. The results were presented in Table 3.
Table 3. Determination of EP, DA, AA and UA in real samples using SWV (n=6)
sample Detected(μM) Added (μM) Founded(μM) Recovery (%)
a
Total value (mM)
Serum AA — 100.0 101.5 101.5 —
DA — 10.0 10.2 102.0 —
EP — 10.0 10.1 101.0 —
UA 10.5 50.0 59.1 97.2 0.21
Urine AA — 100.0 99.7 99.7 —
DA — 10.0 9.9 99.0 —
EP — 10.0 9.9 99.0 —
UA 22.5 50.0 74.7 104.4 2.25
a Total value was obtained by multiplying the detected value by the appropriate dilution factor (20 for serum and 100 for urine samples)
4. CONCLUSIONS
ACKNOWLEDGEMENTS
This project is supported by the Scientific Research Fund of SiChuan Provincial Education Department (No.10ZB102), the Opening Project of Key Laboratory of Green Catalysis of Sichuan Institutes of High Education (No.LYJ1103), Material Corrosion and Protection Key Laboratory of Sichuan Province (No.2011CL07), and the Science and Technology Project of Sichuan University of Science and Engineering (No. 2010XJKYL004、2011KY04), and all authors here express their deep thanks.
References
1. D. J. Michael, R. M. Wightman, J. Pharm Biomed Anal., 19 (1999) 33.
2. R.Webster, C.Jordan, Neurotransmitters, Drugs and Disease, Blackwell, Oxford (1989).
3. M.H. Sorouraddin, J.L. Manzoori, E. Kargarzadeh, A. M. Haji Shabani, J. Pharm. Biomed. Anal.,
1998, 18, 877.
4. O. Arrigoni, M. C. De Tullio, Biochim. Biophys. Acta., 1569 (2002) 1. 5. V. V. S. Eswara Dutt, H. A. Mottola, Anal. Chem., 46 (1974) 1777.
6. E. Miland, A.J.M. Ordieres, P. T. Blanco, M. R. Smyth, C. O. Fagain, Talanta., 43 (1996) 785. 7. X.H. Jiang, X.Q. Lin, Analyst., 130 (2005) 391.
8. N. F. Atta, A. Galal, F. M. Abu-Attia , S. M. Azab, J. Mater. Chem., 21 (2011) 13015. 9. N. B. Li, W. Ren, H. Q. Luo, Electroanalysis., 19 (2007) 1496.
10.J. M. Zen, P. J. Chen, Anal. Chem., 69 (1997) 5087. 11.Z. Q. Gao, H. Huang, Chem. Commun., (1998) 2107.
12.W. Ren, H. Q. Luo, N. B. Li, Biosens. Bioelectron., 21 (2006) 1086. 13.G. F. Kang, X.Q. Lin, Electroanal., 18 (2006) 2458.
14.H. R. Zare, N. Rajabzadeh, N. Nasirizadeh, M. M. Ardakani, J. Electroanal. Chem., 589 (2006) 60. 15.H. Yao, Y. Y. Sun, X. H. Lin, Y. H. Tang, L. Y. Huang, Electrochim. Acta., 52 (2007) 6165. 16.S. Thiagarajan, S.M. Chen, Talanta., 74 (2007) 212.
17.R. P. da Silva, A. W. O. Lima, S. H. P. Serrano, Anal. Chim. Acta., 612 (2008) 89.
18.J. Argüello, V. L. Leidens, H. A. Magosso, R. R. Ramos, Y. Gushikem, Electrochim. Acta, 4 (2008) 560.
19.S. Harish, J. Mathiyarasu, K. L. N. Phani, V. Yegnaraman, J. Appl Electrochem., 38 (2008) 1583. 20.Y. Liu, J. S. Huang, H. Q. Hou, T. Y. You, Electrochem. Commun., 10 (2008) 1431.
21.S. Thiagarajan, T.H. Tsai, S.M. Chen, Biosens. Bioelectron., 24 (2009) 2712. 22.S. Y. Zhu, H. J. Li, W. X. Niu, G. B. Xu, Biosens. Bioelectron., 25 (2009) 940. 23.R. Zhang, G. D. Jin, D. Chen, X. Y. Hu, Sensor. Actuat. B, 138 (2009) 174.
24.G. F. Wang, J. A. Sun, W. Zhang, S. F. Jiao, B. Fang, Microchim. Acta., 164 (2009) 357. 25.A. A. Ensafi, M. Taei, T. Khayamian, J. Electroanal. Chem., 633 (2009) 212.
26.N. F. Atta, M. F. El-Kady, A. Galal, Anal. Biochem., 400 (2010) 78.
27.A.A. Ensafi, M. Taei, T. Khayamian, A. Arabzadeh, Sensor. Actuat. B, 147 (2010) 213. 28.A.A. Ensafi, M. Taei, T. Khayamian, Int. J. Electrochem. Sci., 5 (2010) 116.
29.H. R. Zare, N. Nasirizadeh, Sensor. Actuat. B., 143 (2010) 666.
30.C. Wang, R. Yuan, Y.Q. Chai, Y. Zhang, F. X. Hu, M. H. Zhang, Biosens. Bioelectron., 30 (2011) 315.
31.C. Wang, R. Yuan, Y. Q. Chai, S. H. Chen, F. X. Hu, M. H. Zhang, Anal. Chim. Acta, 741 (2012) 15.
32.G. Y. Wang, X.J. Liu, G. A. Luo, Z.H. Wang, Chin. J. Chem., 23 (2005) 297.
33.Y. Z. Zhou, L. J. Zhang, S. L. Chen,S. Y. Dong, X. H. Zheng, Chin. Chem. Lett., 20 (2009) 217. 34.Y. Wang, Z. Z. Chen, Colloid. Surface, B74 (2009) 322.
35.J. E. Huo, J. Li, Q.M. Li, Mat. Sci. Eng., C33 (2013) 507.
37.Q. Ye, F. Zhou, W.M. Liu, Chem. Soc. Rev., 40 (2011) 4244.
38.B. Yu, J.X. Liu, S.J. Liu , F. Zhou, Chem. Commun., 46 (2010) 5900.
39.Y. C. Fu, P. H. Li, Q. J. Xie, X. H. Xu, L. H. Lei, C. Chen,C. Zou, W. F. Deng, S. Z. Yao, Adv. Funct. Mater., 19 (2009) 1784.