Article
Hydraulics, Dimensional Analysis and Visualization
of Flow through Unpressurized Gating Systems Using
Water Models
Venkataramani Jaiganesh
a,*and Kalakkath Prakasan
bDepartment of Production Engineering, PSG College of Technology, Coimbatore, India. E-mail: a[email protected](Corresponding author), b[email protected]
Abstract. During recent years, foundry industry has witnessed an increasing awareness about the importance of the filling stage for the production of metallurgically sound and dimensionally stable castings. The metallurgical soundness of a casting is strongly influenced by the way the liquid metal flows through various parts of the gating system and fills the mould cavity. Owing to the importance of filling stage, extensive research has been directed towards the determination of optimum filling conditions as well as on the influence of gating parameters. In this study, the hydraulics and flow behaviour of an aluminium alloy in a pressurized, horizontal gating system with a gating ratio of 1:2:1 incorporating multiple ingates attached to a horizontally cast plate mould is investigated using transparent water models. Similitude considerations between water and aluminium were invoked in the design of water models so that the conclusions drawn from water model experiments become applicable to real casting. Runners with two different aspect ratios and four different types of ingates were examined for their influence on hydraulics and flow behaviour. Flow behaviour was visualized using a high speed camera capable of capturing images up to 10,000 frames per second. Comparison of the filling patterns between water model experiments and real time experiments with molten metal in sand moulds provided useful insights into the performance of pressurized, horizontal gating system with multiple ingates and on the utility of flow visualization using water models.
Keywords: Pressurized gating system, flow visualization, water models, similitude.
ENGINEERING JOURNAL Volume 20 Issue 1 Received 2 March 2015
1.
Introduction
A gating system is essentially a plumbing network through which the molten metal is introduced into the mold cavity. The requirements that a gating system should satisfy have frequently been reviewed and may be briefly summarized as follows:
1. The metal should flow through the gating system with a minimum of turbulence and aspiration of mold gases.
2. The metal should be introduced into the mold cavity so that the temperature gradients, produced on the surface of the mold cavity and in the melt within the mold cavity, will facilitate directional solidification towards the riser.
3. The gating practice should be feasible and economical.
It is evident that, if the first requirement is met, dross, gas entrapment, solution and reprecipitation of soluble gas will be reduced or avoided. If the second requirement is met, castings will be substantially free of defects resulting from shrinkage or inadequate feeding. If the third requirement is met, castings are free of defects resulting from incorrect gating practice.
2.
Literature Review
process and need not be considered in the design of water models. Runyoro, et al. [9] studied the effect of melt entry velocity on mold filling pattern into a vertically-cast plate mold that was bottom gated. Their results indicate that there exists a critical entry velocity during mold filling. Xue, et al. [10, 11] reported that the gating system ratio plays a more significant role than the sizes of gates on mold filling pattern. Bjorklund [12] provided a basis for systematic analysis of dimensions of gating systems. Masoumi, et al. [13, 14] studied the effect of gating design on melt entry velocity by pouring molten aluminum alloy A413 into a sand mould. Their results indicate that gating system ratio, geometry and size of gate have great influence on the entry velocity of the molten metal into the mould. Also, in unpressurised gating systems, deviation of melt flow from the centerline of the mould or incomplete gate filling tends to appear. Mezoff, et al. [15] discussed the influence of gating system on the degree of turbulence which occurred during the pouring of magnesium alloy castings. It was found that improper sprue design may lead to casting defects by the entrainment of gases in the metal stream. The degree of turbulence led to three defects namely, skins, blows and microporosity. Flemings, et al. [16] illustrated the importance of a good gating design for aluminum castings. The functionality of every element of gating system was elaborated. Salient features involved in the design of elements of gating system were discussed systematically. Van der Graff, et al. [17] studied the mold filling profiles for vertical, thin, plate shaped cavities, with a vertical ingate system connected to the bottom of the cavity. The authors concluded that the visual observations of molten liquids, CFD simulations, and DPIV results were in good agreement. Jeancolas, et al. [18] made a comparative study of the pouring of foundry alloys through gating systems formed in sand moulds and the pouring of various fluids at room temperature into hydraulic models of the same dimensions. It was determined that, provided certain precautions are taken, the use of hydraulic models for the study of the flow of molten metals through gating systems is justified and that the roughness of the mould walls had a negligible influence on the flow characteristics. Johnson, et al. [19] investigated the effects of various modifications to the design of the runner. This study was confined to systems in which the gate area was twice the sprue area. It was pointed out that momentum effects were important in gating systems since in the early stages of pouring the gating system is not completely full and as a result the flow is governed by the momentum of the stream. It was also suggested that momentum effects are more marked in the flow of metals than in the flow of water owing to the high density of the metal and that the use of water models or analogies is therefore dangerous in the early stages of metal flow.
Although literatures pertaining to flow of molten metals through gating systems abound, experimental work, in particular, the visualization of the effect of horizontal bottom gating system design with multiple gates on the flow behavior through the running system and in the cavity is limited in the open literature. Therefore, a study in which hydraulics and flow behavior of an aluminum alloy Al 308 through a horizontal bottom gated pressurized system with a ratio of 1:2:1 attached to a horizontally cast plate mold is taken up for the benefit of industry.
3.
Objectives
Objectives of this study are to
1. Understand the conditions that must be met if filling simulations using water is to be a reliable indicator of the pattern of flow that would prevail in a real casting.
2. To conduct experiments using water models to determine the discharge and velocity through various gates.
3. Understand the influence of hydraulic and geometric variables on the performance of various runner-gate combinations and their influence on mould filling.
4. To develop simple regression equations that could be of use to practical foundryman during rigging design for correlating velocity of flow with gate positions for some simple runner-gate combinations. 5. To conduct real time experiments with molten metal for some selected runner-gate combinations to
validate the observations made during water model experiments.
4.
Methodology
complete interchangeability between the runner and ingate was carried out. The water model was modularized so as to facilitate investigation of various runner ingate combinations. On the basis of similitude, scaling factors to be applied for water models are calculated. Acrylic models of gating systems with gating ratios 1:1.5:0.75, 1:2:1 and 1:4:4 are designed and fabricated. Experiments are conducted with water models using water as the filling medium to obtain the velocities and discharges through various gates for different gating ratios. A digital stop watch and a calibrated measuring jar are used to measure the time and discharge respectively. Velocity at various gates obtained from experiments is expressed as a function of non-dimensionalized distance of the gate from spruebase for different values of head in the pouring basin. Flow visualization experiments are carried out for systems with different gating ratios for various runner-gate combinations fabricated. High speed camera capable of capturing images up to 10,000 frames per second is used to record the flow behavior. Real time experiments with sand mould-molten metal combination are carried out for selected runner gate combinations. Flow is simulated using software for selected runner gate combinations. 3D model of the gating system is created using FLOW Cast software for analyzing the flow through various parts of the gating system. The necessary thermo-physical data are specified for the analysis along with the initial and boundary conditions. The manner of filling as observed during experiments and that during simulation were compared so as to draw some useful conclusions on the utility of flow visualization using water models and the capability of software to predict the filling pattern during casting process accurately.
4.1. Similitude and Scaling Factor for Water Models
In the present study, water is used to simulate the flow behavior of aluminum alloy Al 308. Fluid flow during mold filling can be characterized by a set of non-dimensional numbers. To obtain maximum similitude between the real casting and water model experiment, it is essential that certain non-dimensional numbers are same in both situations. The non-dimensional numbers pertaining to casting process, in general, are Weber number (We), Reynolds number (Re), Froude number (Fr) and Euler number (Eu). Cuesta [1] mentioned that Weber number and Euler number are insignificant and hence could be neglected for the case of gravity casting. The relevant non-dimensional numbers for the proposed water model experiments are Reynolds number (Re) and Froude number (Fr). These two non-dimensional numbers must be equal at homologous points if maximum similitude is to be expected between the water model and real casting.
The expression for scaling factors that ensure complete similitude [16] are given by Eq. (1) and (2). KV = (υ2/υ1)1/3 (velocity scaling) (1) KL = (υ2/υ1)2/3 (length scaling) (2) where υ1 and υ2 represent the kinematic viscosities of molten metal and water respectively. The above equations indicate that any difference in the kinematic viscosities of water at room temperature and the molten metal at its pouring temperature will imply the application of scaling factor for the water model. The kinematic viscosities of water and Al 308 are 1.004 x 10⁻⁶ m2/s and 0.55 x 10⁻⁶ m2/s respectively [16]. Inserting these values in the expression for length scaling, the value of linear scaling factor (KL) turns to be 1.49. This implies that all the linear dimensions of the water model must be greater than the corresponding dimensions in the real casting by 49% so as to obtain complete similitude.
5.
Experimental Details
It was proposed to study the hydraulics and flow behavior of Aluminum alloy Al 308 considering its potential applications and gating ratio of 1:4:4 is normally employed in foundries casting this alloy. Experiments in this work are divided into two categories, the first category being flow measurement and the second category, flow visualization.
5.1. Flow Measurement
w=0.5h) and three different types of ingates (rectangular, convergent and divergent) as shown in Fig. 1 were used in the study. The runner is of length 600mm for both the aspect ratios and of cross section 76.22 x 38.11mm and 38.11 x 76.22mm respectively for w=0.5h and w=2h runners. All the gates were of 50mm length and 9.53mm height (inner). Holes of diameter 5mm were drilled at equal distances on the top face of runner plate to facilitate inserting piezometer tubes that act as vents.
(a) (b) (c)
(d) (e) (f)
Fig. 1. Acrylic models of various components of a gating system. (a) Runners with different aspect ratios (b) Rectangular, convergent and divergent gates (c) downsprue (d) pouring basin (e) Cavity (f) spruebase.
The modular experimental set up for flow measurement is shown in Fig. 2. (Scale 1:2.5)
Fig. 2. Experimental set up for flow measurement.
[image:5.595.77.540.150.438.2] [image:5.595.233.367.507.682.2]that steady state conditions are attained. Once the steady state conditions were attained, the cork was removed. Water coming through each gate was then collected using reservoirs that were fabricated specially for flow measurement. The water collected in each reservoir was measured using calibrated measuring jars. A digital stop watch was used to record the time for which water flows through each gate. Each experiment was repeated thrice to ensure repeatability. The experimental results are given in Table 1 for runner aspect ratio of 0.5 for the sake of brevity.
Table 1. Velocity and discharge values for Runner aspect ratio w = 0.5h and rectangular gate.
Type of ingate
Head in the pouring basin (mm)
Ingate
designation (x 10Volume -3 m3)
% of discharge Std.Dev of % Discharge Velocity (m/s) Std.Dev of Velocity (m/s) Rectangular 420
G1 2.060 17.843
7.019
0.267
0.053
G2 2.420 20.961 0.290
G3 3.190 27.631 0.366
G4 3.875 33.564 0.371
TOTAL 11.545
450
G1 2.220 16.116
8.435
0.233
0.049
G2 2.860 20.762 0.278
G3 3.810 27.659 0.335
G4 4.885 35.463 0.332
TOTAL 13.775
480
G1 2.480 16.162
8.428
0.282
0.057
G2 3.145 20.495 0.336
G3 4.310 28.087 0.421
G4 5.410 35.256 0.343
TOTAL 15.345
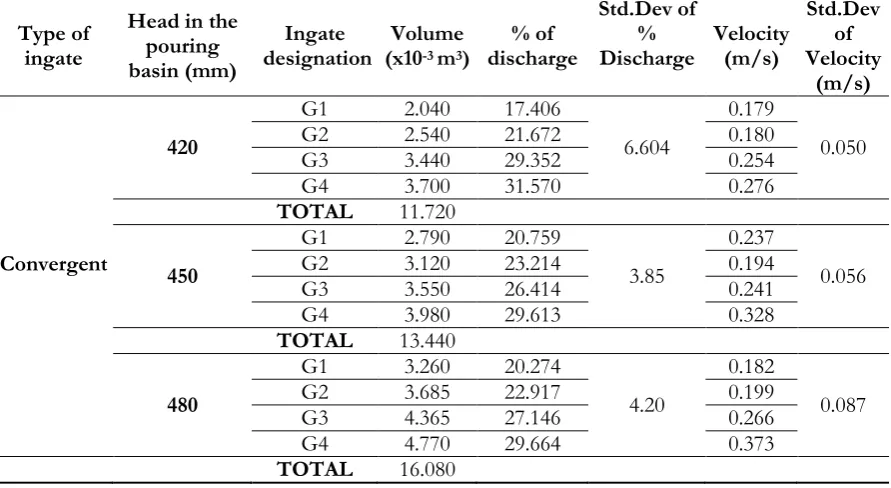
Table 2. Velocity and discharge values for Runner aspect ratio w = 0.5h and convergent gate.
Type of ingate
Head in the pouring basin (mm)
Ingate
designation (x10Volume -3 m3)
% of discharge
Std.Dev of %
Discharge Velocity (m/s)
Std.Dev of Velocity (m/s) Convergent 420
G1 2.040 17.406
6.604
0.179
0.050
G2 2.540 21.672 0.180
G3 3.440 29.352 0.254
G4 3.700 31.570 0.276
TOTAL 11.720
450
G1 2.790 20.759
3.85
0.237
0.056
G2 3.120 23.214 0.194
G3 3.550 26.414 0.241
G4 3.980 29.613 0.328
TOTAL 13.440
480
G1 3.260 20.274
4.20
0.182
0.087
G2 3.685 22.917 0.199
G3 4.365 27.146 0.266
G4 4.770 29.664 0.373
Table 3. Velocity and discharge values for Runner aspect ratio w = 0.5h and divergent gate.
Type of ingate
Head in the pouring basin (mm)
Ingate
designation (x10Volume -3 m3)
% of discharge
Std.Dev of %
Discharge Velocity (m/s)
Std.Dev of Velocity
(m/s)
Divergent
420
G1 1.930 17.763
7.28
0.209
0.107
G2 2.320 21.353 0.258
G3 2.860 26.323 0.224
G4 3.755 34.561 0.440
TOTAL 10.865
450
G1 2.660 19.487
5.73
0.170
0.107
G2 2.950 21.612 0.297
G3 3.620 26.520 0.229
G4 4.420 32.381 0.420
TOTAL 13.650
480
G1 2.785 18.407
7.29
0.158
0.161
G2 2.945 19.465 0.241
G3 4.330 28.619 0.342
G4 5.070 33.510 0.532
TOTAL 15.130
5.1.1. Analysis and interpretation of flow measurement experiment results
The discharge through various gates for the various heads and types of gate for various runner aspect ratios and gates are plotted in Figs. 3 and 4.
(a) (b)
Fig. 3. Variation of discharge across the gates with runner aspect ratio = 0.5 for different types of gates: (a) H = 480 mm and (b) H = 420mm.
(a) (b)
[image:7.595.71.530.414.727.2] [image:7.595.70.530.592.744.2]From Figs. 3 and 4, it is observed that in this gating system, irrespective of the runner aspect ratio and head, the discharge is maximum in the gate farthest from the sprue and decreases towards the sprue. This is because once the pouring has begun, after falling down the sprue, the fluid travels down the runner to its far end as a result of momentum effects and the absence of pressure without flowing through any side channels or gates. Upon striking the far end of the runner, a pressure wave is generated locally and this causes the flow to take place through the gates farthermost from the sprue. Pressure then builds up along the entire system and flow takes place through other gates. Also, it can be understood that the variation in discharge between the gates is more or less similar for all types of gates. It can be concluded that the variation in head, type of gate and the runner aspect ratio of the runner has no significant influence on the variation of discharge through the gates. Although the variation in discharge across the gates have been shown only for two extreme values of heads (420 mm and 480 mm), similar pattern of variation is observed for all the cases for H = 450 mm.
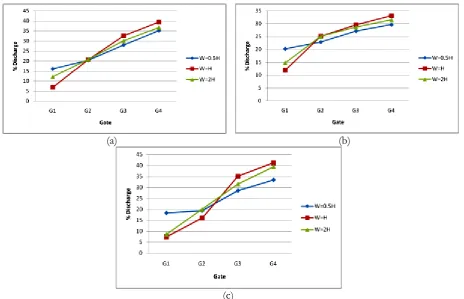
5.1.2. Influence of runner aspect ratio on discharge variation.
The discharge variation across the gates in systems with different runner aspect ratios of the runner was studied for various types of gates and heads and the results are shown in Fig. 5.
(a) (b)
(c)
Fig. 5. Comparison of runner performance for various gating ratios for different types of gates (H = 480 mm): (a) rectangular gate; (b) convergent gate; (c) divergent gate.
From the comparisons it is observed that a square runner with runner aspect ratio (w/h) of 1 gives the maximum variation in discharge for a given type of gate in an unpressurized gating system.
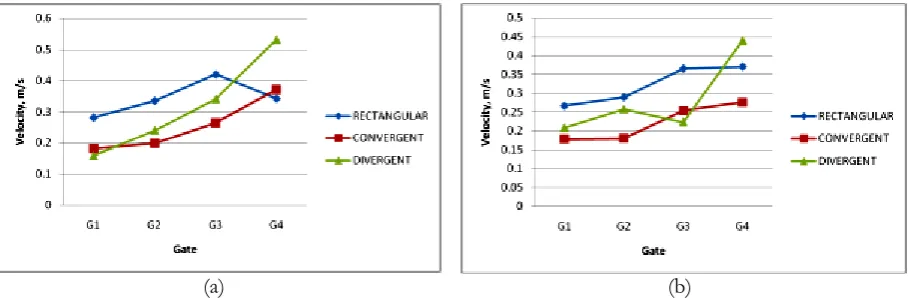
5.1.3. Influence of the type of gate on the velocity variation across the gates
[image:8.595.71.536.311.610.2](a) (b)
Fig. 6. Variation of velocity across the gates for different types of gates for runner aspect ratio = 0.5: (a) H = 480 mm and (b) H = 420mm.
(a) (b)
Fig. 7. Variation of velocity across the gates for different types of gates for runner aspect ratio = 2: (a) H = 480 mm and (b) H = 420mm.
From the Figs. 6 and 7, it is understood that in an unpressurized system, as in the case of discharge, due to momentum effects in the runner maximum velocity is observed in the gate farthest from the sprue and minimum in the gate adjacent to the sprue. This is also in agreement with the Bernoulli’s principle as applied to the runner. Further, the flow velocity of water through the third and fourth gate from the sprue for all the combination of parameters is higher than that corresponding to the entrainment threshold of 0.33 m/s as suggested by Runyoro, et al. [9]. This indicates that the potential for damage in the metallurgical quality of the molten metal is high even in an unpressurized system unless the velocity at the entry to the gates is reduced below that of the threshold value. This can be achieved by a suitable redesign of the running system. Further, it is noted that irrespective of the runner aspect ratio, the velocity across the divergent gates continuously increases with distance from the sprue. Although the variation in velocity across the gates have been shown only for two extreme values of heads (420 mm and 480 mm), similar pattern of variation is observed for all the cases for an intermediary value of 450 mm. It is concluded that in an unpressurized system, it is difficult to achieve uniform discharge and velocity across the various gates.
[image:9.595.76.531.78.227.2]5.1.4. Dimensional analysis of flow through gating systems
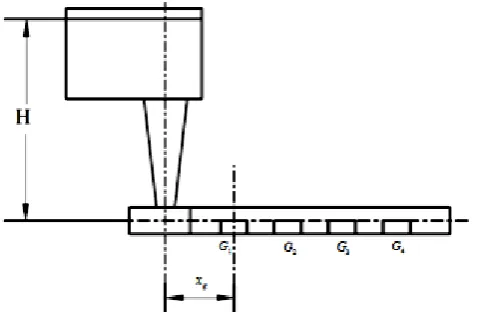
[image:10.595.209.448.167.323.2]Dimensional analysis as applied to a gating system is very much relevant as the results of experiments obtained using water models can be applied to flow of molten metal through real time gating systems. Figure 8 shows a simple schematic of the system under consideration for study.
Fig. 8. Schematic of the gating system for dimensional analysis.
The method of repeating variables is used to determine the Pi terms or dimensionless products for the system under study. The important steps used to obtain the relevant non-dimensional groups are:
i. Listing of variables that are involved in the problem.
In the system under study, the variables identified are the Head (H), distance of the gate from the centre of the sprue (xg), density of the fluid (ρ), dynamic viscosity of the fluid (µ), area of cross section of the runner (A) and acceleration due to gravity (g).
ii. Determination of the required number of Pi terms
The required number of Pi terms is obtained using Buckingham’s Pi Theorem given by Eq. (3).
Number of Pi terms = k – r
(3)
where k - number of variables in the problem and r - number of reference or basic dimensions required to describe these variables. In this study, the number of variables is six and the number of reference dimensions is three (length, mass and time). Therefore the number of Pi terms is three.
iii. Selection of repeating variables
Repeating variables are those that are extracted from the original list of variables several of which when combined with each of the remaining variables gives a Pi term. In this study, head, density and acceleration due to gravity are identified as the repeating variables since each repeating variable is dimensionally independent of others and all the required reference dimensions are included within the group of repeating variables.
iv. Formation of Pi terms
Four Pi terms are involved in this study. The first Pi term is given by Eq. (4).
1
a b c
VH g
(4)
Since this combination is dimensionless, it follows that
1
a b 3b
c 2c
0 0 0Solving for a, b and c, we get a = -1/2, b = 0 and c = -1/2. Substituting these values in Eq. (4), we get the first Pi term as
1 V
gH
Repeating the process for the remaining non-repeating variables, we get the remaining Pi terms as
2 g x
H
3
H gH
which is the Reynolds number.
v. Expressing the result of the dimensional analysis
The result of the dimensional analysis carried out for the problem under study is given by Eq. (6).
,
g x V
H
gH H gH
(6)
As a result of dimensional analysis, the number of variables has been reduced from six to three. Upon examination of these Pi terms, it was observed that a plot of 1 (
V
gH ) against 2(xg/H) could result in a functional relationship that in turn can provide a scientific basis for the design of gating systems. Such a plot was carried out for all combination of parameters for this gating ratio (1:4:4) and plots pertaining to rectangular gate are shown in Figs. 9–11. In all the combinations for this gating ratio, the gates were located at a distance (xg) of 235 mm, 335 mm, 435 mm and 535 mm respectively from the center of the spruebase. Velocity values were taken from the flow measurement experiments (Table 1). Using standard curve fitting techniques, it was found that a second order polynomial fit better explained the variation in the data for all the cases under this ratio. The regression equations corresponding to the various runner aspect ratios for a given type of gate and head are given under the respective sections. In each graph, for ease of correlation, the regression equation for a particular runner aspect ratio is enclosed inside a box having the same colour as that of the corresponding regression curve.
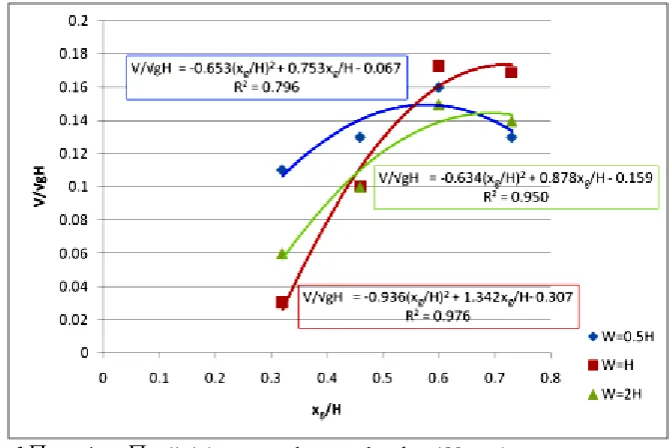
Fig. 9. Plot of 1 against 2 (1:4:4, rectangular gate, head = 480 mm).
[image:11.595.131.466.490.714.2]2
0.653 xg 0.753 xg 0.067
V
H H
gH
(7)
2
r = 0.796 (w = 0.5h) 2
0.936 xg 1.342 xg 0.307
V
H H
gH
(8)
2
r = 0.976 (w = h) 2
0.634 xg 0.878 xg 0.159
V
H H
gH
(9)
2
r
= 0.950 (w = 2h)
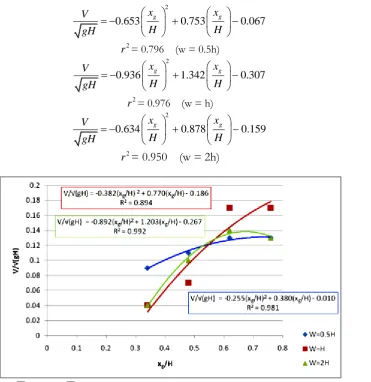
Fig. 10. Plot of 1 against 2 (1:4:4, rectangular gate, head = 450 mm).
The regression equations in this case for the various runner aspect ratios are given by Eq. (10), (11) and (12).
2
0.255 xg 0.380 xg 0.010
V
H H
gH
(10)
2
r = 0.981 (w = 0.5h) 2
0.382 xg 0.770 xg 0.186
V
H H
gH
(11)
2
r = 0.894 (w = h) 2
0.892 xg 1.203 xg 0.267
V
H H
gH
(12)
2
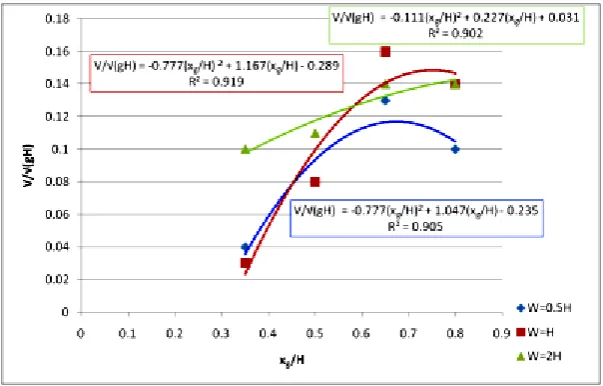
[image:12.595.129.501.78.461.2]Fig. 11. Plot of 1 against 2 (1:4:4, rectangular gate, head = 420 mm).
The regression equations in this case for the various runner aspect ratios are given by Eq. (13), (14), and (15).
2
0.777 xg 1.047 xg 0.235
V
H H
gH
(13)
2
r = 0.905 (w = 0.5h) 2
0.777 xg 1.167 xg 0.289
V
H H
gH
(14)
2
r = 0.919 (w = h) 2
0.111 xg 0.227 xg 0.031
V
H H
gH
(15)
2
r = 0.902 (w = 2h)
Similar Equations can be obtained for other combinations of gates and heads. It can be observed that in some cases, the coefficient of determination (r2) of the regression was found to be as low as 0.79. Although, experiments were repeated for such cases, the same observations were obtained indicating random sources of error during experiments. Some such sources could be the high degree of turbulence and pulsations in the flow through the gates.
The regression equations developed for the various combinations of gates, runner aspect ratios and head relate the velocity and the position of the gate in non-dimensional form. For a given position of the gate along the runner, it is possible to predict the velocity of flow through the gate, provided the total head is known. This could in turn shed light on the possibility of the incidence of entrainment, splashing, erosion or other filling related defects in a casting leading to a possible repositioning of the gates if required. On the other hand, if a particular velocity is desired, then the head required to achieve the velocity could be predicted from these equations that in turn could lead to a rational decision on the sprue and pouring heights to be employed for the casting.
[image:13.595.149.451.78.271.2]5.2. Flow Visualization in Gating Systems
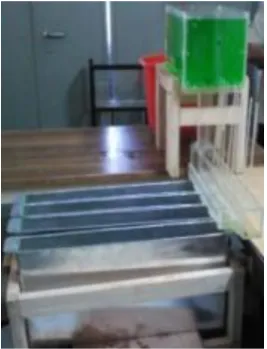
The experimental set up for flow visualization in shown in Fig. 12.
(a) (b)
Fig. 12. Experimental set up for flow visualization.
The aim of flow visualization is to permit direct observation of the flow behaviour as the fluid flows through various parts of the gating system. The setup for flow visualization experiments is shown in Fig. 12. Flow visualization experiments were conducted with the cavity attached to the desired runner-gate combination as shown in Fig. 12(a). Colour powder was added to water to improve the visualization effects. These experiments were conducted for all combinations of head, runner aspect ratio and type of gate. As in the case of flow measurement experiments, prior to the start of experimentation, the sprue entrance was closed with a cork so that water in the basin attained steady state conditions. A high speed camera shown in Fig. 12(b) was used for visualization of flow. Flow visualization experiments were carried out for all the combination of parameters and observations were made concerning the flow behaviour in critical sections of the gating system and mould cavity. In all the cases, the total head at the sprue base was maintained at 480 mm.
5.2.1. Flow visualization in the spruebase
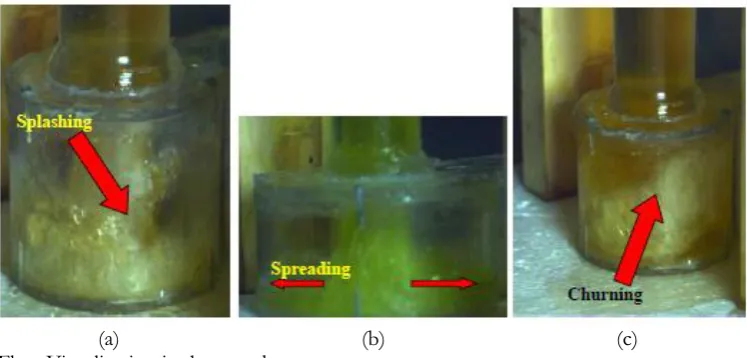
Typical Flow visualization frames for the sprue base are shown in Fig. 13 (a) to (e).
[image:14.595.91.273.128.318.2] [image:14.595.113.487.554.733.2]As the fluid enters the sprue base and hits the bottom, violent splashing was observed leading to intensive churning motion that persisted till the end of flow. Splashing at the bottom was followed by spreading towards the walls of the sprue base as shown in Fig. 13(b). The constraining effect of the walls of the sprue base resulted in a folding action of the stream upon itself as indicated by arrows resulting in severe swirling motions of the fluid inside the sprue base. Although the function of the sprue base is to provide a quiescent entry of the molten metal into the runner, by absorbing some of the kinetic energy of the falling metal, it was found that the transport of turbulence into the runner was inevitable, for all runner aspect ratios. In the case of real casting, although the degree of damage suffered by the molten metal inside the spruebase due to splashing and turbulence may be less than that of the molten metal (surface tension of the molten metal is several orders of magnitude greater than that of water), the damage is found to be inevitable. Also, the erosion of the mould cavity at the bottom of the sprue is evidently greater when pouring molten metal than in the case of water due to differences in density and the associated momentum effects.
5.2.2. Flow Visualization in the runner
Some typical flow visualization extracts pertaining to the runner are shown in Fig. 14 (a) to (f).
(a) (b)
(c)
(d)
(f)
Fig. 14. Flow visualization in a narrow and deep runner (a), (b) at the entry to the runner.
As discussed in the previous section, the fluid enters the runner in a highly turbulent manner as shown in Fig. 14(a) and (b). The entry of the fluid into the runner can be characterized as “ghostly” with full of splashes. There is no well defined flow front as shown in Fig. 14(c). Such a profile is retained by the fluid for nearly half the length of the runner after which a thin tongue of fluid develops that slides past the runner at a high velocity, hits the end of the runner and furls back before it merges with the oncoming wave front indicating the possibility of air and gas entrapment. The distance to which the return wave can propagate upstream before it loses its identity should necessarily depend on the head available for the flow since head provides the driving force for the flow through the runner. This is followed by an intensive momentum exchange between the return and the upcoming streams leading to pressure buildup upstream of the runner. The mometum exchange and pressure buildup can be correlated with sequence and the amount of flow through various gates in the runner. Although only a feeble flow is observed through the gates when the fluid flows down the runner, substantial flow through the gates particularly the second and third gates from the sprue, could be realized only when the oncoming and the returning streams meet each other. Further, the exchange of momentum between the return wave and the oncoming steam resulted in sloshing in the runner that manifested as pulsations in the flow through the third and fourth gates and sometimes the second gate. Large number of airbubbles were also observed in the stream during its flow through the runner which could be attributed to the aspiration of air in the sprue and sprue base. Another important observation is that the runner is not full as the stream flows through the runner. This may facilitate air and gas pickup and oxidation of the metal that may finally lead to oxide inclusions in the casting. Also, intense turbulence in the runner enhances the rate of heat dissipation of the molten metal that may lead to reduction in the fluidity of the metal as it enters the cavity thereby producing misrun or coldshuts. All these observations indicate the importance of geometry in the design of the various critical sections in the running system and flow velocity in the runner. The observations discussed were common for all the gating ratios.
5.2.3. Flow visualization in the cavity
In the case of flow through an unpressurized gating system with a runner aspect ratio of 0.5, typical flow visualization extracts pertaining to cavity are shown in Fig. 15(a) to (d).
[image:16.595.137.462.81.173.2](c) (d)
Fig. 15. Flow visualization in the cavity with rectangular gate (Runner aspect ratio = 0.5 and gating ratio 1:4:4).
As the flow takes place through the runner, the fluid first flows out of the gate nearest to the sprue and then sequentially through the other gates as shown in Fig. 15(a). Although this is seen as a violation of the Bernoulli’s principle, a closer examination of the events indicated that the motion of the fluid during its entry into the runner could probably be a superimposition of two components namely the forward motion along the runner and the rotational component imparted to the fluid particles due to the swirling and churning motion in the sprue base. This combination of splashing and swirling enables some of the fluid to enter the gate nearest to the sprue with the bulk of the fluid travelling down the runner as indicated in Fig. 15(a). As the fluid hits the end of the runner and returns back, the back pressure generated at the end of the runner pushes the fluid into the cavity through the farthest gate. The return wave travels backs along the runner until its energy is completely balanced by the oncoming stream at midway (approximated) between the second and third gates. The transmission of back pressure along the runner then enables flow to be realized through the third and fourth gate from the sprue. Deviation of flow from the centerline of the gate was observed in all the gates and continued till the end of filling. It was also observed that in the case of first and second gates, the entire cross-section of the gates was not utilized during a major portion of the time of flow.
5.3. Real Time Experiments with Molten Metal
For the sake of brevity, the results of real time experiment incorporating a wide and shallow runner with rectangular gate is discussed. Some typical visualization extracts are shown in Fig. 16 (a) to (l).
[image:17.595.151.503.78.225.2](c) (d)
(e) (f)
(g) (h)
(i) (j)
Fig. 16. Comparison of flow behaviour in water model experiments and real time casting (Rectangular gate, runner aspect ratio = 2, gating ratio 1:4:4) (a), (c), (e), (g) and (i) water model experiments; (b), (d), (f), (h) and (j) real time casting.
[image:18.595.96.503.77.662.2]entire cross-section of the first and second gates were not completely utilized during a major portion of the filling cycle. This is clearly indicated by non-uniformity in the width of the molten metal streams emerging from the various gates in Fig. 16 (j). An excellent agreement between the results of water model experiment and real time casting experiment as regards the filling characteristics in the cavity and the gates indicated the utility of water models in understanding the flow of molten metal through real time gating systems.
Summarizing, the following are the similarities and differences observed between real time experiments with molten metal and water model experiments.
Similarities
1. The sequence in which the flow takes place through the various gates is the same in both the experiments. This is indicated in Fig. 16 (c) and (d).
2. No deviation was observed in the flows issuing from the various gates in both the cases. 3. Maximum discharge was observed in the gate farthest from the sprue.
4. Non-utilization of the entire cross-section of the gates nearest to the sprue (first and second) during the entire filling cycle.
5. The pattern with the return flow takes place towards the gates is similar in both the experiments.
Differences
The amount of lateral spreading observed in the streams issuing out of the gates in water model experiments was more than that observed with the molten metal streams during real time experiments. This is attributed to the high surface tension of the molten metal.
6.
Conclusions
The following are the conclusions drawn out of this study:
1. Applications of the principles of dimensional analysis and similitude to the problem of flow of molten metal through gating systems indicated the application of scaling factor for water model if filling experiments using water are to be a reliable indicator of the flow of molten metal through gating systems in real time castings. The scaling factor depends on the kinematic viscosities of water and the molten metal at its pouring temperature.
2. In the case of unpressurized gating system (gating ratio 1:4:4), irrespective of the runner aspect ratio and head, the discharge is maximum in the gate farthest from the sprue and decreases towards the sprue. Further, maximum velocity is observed in the gate farthest from the sprue and minimum in the gate adjacent to the sprue.
3. It is observed that a square runner with runner aspect ratio (w/h) of 1 gives the maximum variation in discharge for a given type of gate in unpressurized and mildly pressurized systems. 4. Using standard curve fitting techniques, it was found that a second order polynomial fit better
explained the variation in the data for all the cases.
5. Flow behaviour inside the sprue base is characterized by violent splashing and intensive churning motion that persisted till the end of flow.
6. It is observed that the transport of turbulence into the runner is inevitable irrespective of the runner aspect ratio.
7. The furling and folding of the stream upon itself after hitting the end of the runner suggests a strong possibility of air and gas entrapment in the molten metal.
8. The sequence with which flow takes place through various gates is found to vary with the aspect ratio and the type of gate.
9. Flow visualization studies reveal high degree of bulk and surface turbulence in the runner during the initial stages of filling. Further, the degree of turbulence varies significantly with the aspect ratio of the runner. With increasing aspect ratios, the flow becomes less turbulent i.e., a narrow and deep runner shows excessive turbulence whereas a wide and shallow runner shows less turbulence.
11. All these observations indicate the importance of geometry in the design of the various critical sections in the running system and flow velocity in the runner. The observations discussed were common for all aspect ratios of the runner.
12. When the ratio of the total gate area and the sprue area is four (unpressurized system), the filling was observed to be quiescent compared to the other two cases, although turbulence persisted throughout the filling process. No specific pattern could be identified when the streams impinged on the opposite wall of the cavity since the stream velocities are very low.
13. It was observed that the entire cross-section of the gates was not utilized during a major portion of cavity filling time. This could lead to aspiration of air and gas from the walls and also reduces the efficiency of the gate. The problem could be remedied by positioning the gates on the runner in such a way that they branch off at an angle corresponding to that observed during entry through the gates.
14. In the case of unpressurized systems, under low hydrostatic heads, flow into the cavity was found to be relatively sluggish, with low flow velocities. At high heads, relatively high flow velocities were observed. But these are relatively smaller than that observed in pressurized gating systems. 15. In unpressurized systems, the streams emerging from the gates show a strong tendency for lateral
spreading and merging with the adjacent streams.
16. The final stages of cavity filling are characterized by intensive mixing and turbulence inside the cavity.
17. The observations made during real time experiments were in good agreement with that of the water model experiments.
References
[1] M. J. Berger and C. Locke, “A theoretical basis for the design of gates,” Foundry, vol. 79, pp. 112–117, 237–242, 1951.
[2] R. Fuoco and E. R. Correa, “The effect of gating system design on the quality of aluminum gravity castings,” in Proceedings of the AFS International Conference on Structural Aluminum Casting, Orlando, 2003, pp. 205–224.
[3] D. S. Richins and W. O. Wetmore, “Fluid mechanics applied to founding,” AFS Symposium on Principles of Gating, pp. 1–24, 1951.
[4] W. H. Johnson, H. F. Bishop, and W. S. Pellini, “Velocities and volume rates of metal flow in gating systems,” AFS Transactions, vol. 61, pp. 439–449, 1953.
[5] M. N. Srinivasan and V. Kondic, “Progress in the hydraulics of gating,” The British Foundryman, pp. 426–432, 1963.
[6] P. D. Webster, “Study of the flow of metals in runners,” The British Foundryman, pp. 314–319, 1967. [7] W. H. Johnson, W. O. Baker, and W. S. Pellini, “Principles of gating design: Factors influencing
molten steel flow from finger gating system,” AFS Transactions, vol. 58, pp. 661–668, 1950.
[8] R. Cuesta, J. A. Marato, D. Morinigo, I. de Castro, and D. Mozo, “Water analogue experiments as an accurate simulation method of the filling of gravity castings,” AFS Transactions, vol. 114, pp. 137–149, 2006.
[9] J. Runyoro, S. M. A. Buotorabi, and J. Campbell, “Critical gate velocities for film-forming casting alloys: A basis for process specification,” AFS Transactions, vol. 100, pp. 225–234, 1992.
[10] X. Xue, S. F. Hansen, and P. N. Hansen, “Water analog study of effects of gating designs on inclusion separation and mold filling control,” AFS Transactions, vol. 101, pp. 199–209, 1993.
[11] X. Xue, S. F. Hansen, and P.N. Hansen, “Numerical simulation and experimental verification of mold filling processes through depressurized and less-depressurized gating systems,” AFS Transactions, vol. 101, pp. 549–558, 1994.
[12] E. Bjorklund, “Calculating ingate dimensions for gray iron castings,” AFS Transactions, vol. 70, pp. 193–205, 1962.
[13] M. Masoumi, H. Hu, J. Hedjazi, and M. A. Boutorabi, “Effect of gating design on mold filling,” AFS Transactions, vol. 113, pp. 185–196, 2006.
[16] M. C. Flemings and H. F. Taylor, “Gating aluminum castings,” Foundry, vol. 80, pp. 72–78, 1960. [17] G. B. Van Der Graff, H. E. A. Van Der Akker, and L. Katgermann, “A computational and
experimental study on mold filling,” Metallurgical and Materials Transactions B, vol. 32B, pp. 69–78, 2001. [18] M. Jeancolas, G. C. de Lara, and H. Hanf, “Hydrodynamics study of horizontal gating systems,” AFS
Transactions, vol. 70, pp. 503–512, 1962.