Article
Stabilized Oily-Emulsion Separation Using Modified
Induced Air Flotation (MIAF): Factor Analysis and
Mathematical Modeling
Nattawin Chawaloesphonsiya
1,a, Kritchart Wongwailikhit
1,2,b, Saret Bun
1,3,c,
and Pisut Painmanakul
1,4,5,d,*1 Department of Environmental Engineering, Faculty of Engineering, Chulalongkorn University, Bangkok
10330, Thailand
2 LISBP, Université de Toulouse, CNRS, INRA, INSA, 135 Avenue de Rangueil, F-31077 Toulouse, France
3 Faculty of Hydrology and Water Resources Engineering, Institute of Technology of Cambodia, Cambodia 4 Research Unit on Technology for Oil Spill and Contamination Management, Chulalongkorn University,
Bangkok 10330, Thailand
5 Research Program in Remediation Technologies for Petroleum Contamination, Center of Excellence on
Hazardous Substance Management (HSM), Bangkok 10330, Thailand
E-mail: a[email protected], b[email protected], c[email protected], d[email protected] (Corresponding author)
Abstract. The objective of this work was to study the treatment of oily-wastewater by the
combination of induced air flotation and coagulation or the modified induced air flotation (MIAF). Effects of bubble hydrodynamics and mixing were analyzed along with the treatment performance for separation different stable oily wastewaters, including cutting oil, lubricant oil, palm oil. The results suggested the necessity of coagulation for the efficient separation of these emulsions. Different alum concentrations were required for good separation due to the variation of oil concentration. The maximum efficiencies of higher than 85% can be attained under the optimal air flow rate of 0.3 L/min for 10 minutes with appropriate alum dosage. Moreover, the result from factor analysis indicated the importance of coagulant dosage, mean droplet size, and hydrodynamic condition in term of a/G ratio on the treatment performance. Finally, a good correspondence was obtained from the experimental data and the mathematical modeling at which identified the correlation between the treatment efficiency and these key factors with the mean absolute percentage error (MAPE) of at 14%.
Keywords: Stabilized oily emulsion, modified induced air flotation, alum concentration, a/G ratio, factor
analysis.
ENGINEERING JOURNAL Volume 23 Issue 5
1.
Introduction
Due to the prevalent usage of petrochemical products, oily wastewater has become one of serious worldwide problems. The presence of oil causes odor, fuming, and other nuisances. Stabilized oily-emulsion, one form of oily-wastewater with presence of surfactant, is commonly found in discharged wastewater. Such small oil droplets size, smaller than 50 µm, in oily emulsion could cause problems for conventional separation techniques based on the gravitational force [1]. Flotation is one of advanced separation process relies on the attachment of gas bubbles on the dispersed oil droplets [2, 3]. It has been shown a great potential and suitable approach for suspended particles and oil removal from various applications [4]. Furthermore, various advantages (e.g. small footprint, low sludge generation, short hydraulic detention time, and high loading capacity) have been stated [4–6]. In general, dissolved air flotation (DAF), the well-known flotation technique which generates micro-sized bubbles (30 - 100 µm) in elevated pressure, provides very high treatment efficiency [6–8]. However, there are some limitations of this process such as high investment cost, operational complexity, and large footprint [9]. Therefore, other techniques should be studied to overcome disadvantages of DAF. As a result, the simpler flotation by mean of induced air flotation (IAF) is chosen as an alternative for oily emulsion treatment in this study.
Generally, IAF provides larger bubbles than DAF those may lower the separation performance. Some modifications on IAF have been studied in various studies as a result to achieve high separation performance. Several techniques were applied for improving the IAF performance. Coagulation, for example, was used to enhance the separation efficiency of the IAF by destabilizing colloidal particles in wastewater [10, 11]. It was reported that the main effective parameters of IAF process were the coagulant dosage and the retention time in flotation cell [12]. Furthermore, size and number of bubbles also impact the flotation performance, which are governed by air flow rate and air inducing apparatus [12–15]. Bubbles in millimeter range generated in IAF can also provoke mixing inside the flotation cell, which can affect the mechanisms between particles and bubbles those governing separation performance of flotation.
Due to the fact that studies focusing on the application of IAF in oily water treatment were limited in number, this work aims to determine the performance of IAF on separation of stable oily emulsion. Effects of coagulation on the efficiency as well as the hydrodynamic conditions, i.e. bubble hydrodynamic and mixing, in the flotation cell were analyzed. Moreover, a correlation was proposed to demonstrate the relation between treatment efficiencies and significant factors in the operation found in this study. The outcome of this work can provide the guideline for operating IAF to achieve the efficient separation of oil from stabilized emulsion with the understanding in effects of hydrodynamic inside the flotation cell on the performance.
2.
Materials and Methods
2.1. Experimental Set-up
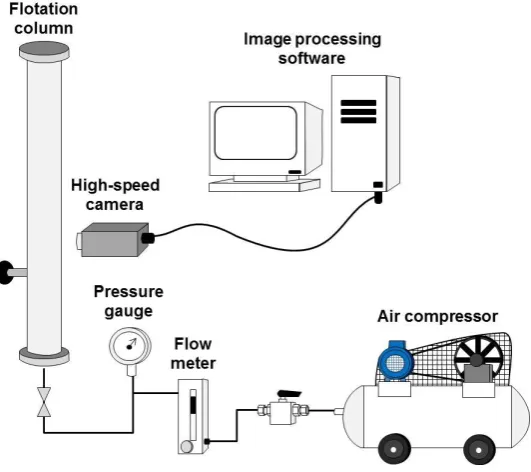
The experiments were conducted in a clear acrylic column with 5 cm-diameter and 2 m-height. The working volume of this flotation column was 3 liters with 1.5 m of liquid phase during operation. Air was introduced from an air compressor through a porous rigid gas diffuser installed at the bottom of the flotation cell for generating bubbles. The air flow rate was regulated by a gas flow meter (New Flow FBC, Golden Mountain Enterprise Co., Ltd.) and an electronic pressure gauge (BIOBLOCK 915PM247). Emulsions were fed at 0.1 m above the diffuser to encounter air bubbles for separating while the sampling point is at 0.2 m above the diffuser as illustrated in Fig. 1, where the schematic diagram is depicted. All experiments were carried out under room temperature (28°C).
2.2. Oily Wastewater Preparation
Fig. 1. Experimental set-up of induced air flotation process.
In this work, chemical oxygen demand (COD) was selected for representing the oil concentration in the emulsions since it has been suggested as the useful parameter to indicate the amount of oil in the wastewater [17, 18]. The oil concentration range was chosen to match the average concentrations of oily wastewater reported in Thailand [15]. The characteristics of different stabilized oily-wastewaters can be summarized in Table 1. As can be seen, these wastewaters contained very much different COD corresponding to the prepared concentration. Furthermore, dissimilar droplet sizes can be noticed as the cutting oil with the presence of co-surfactants had the smallest average droplet size of 0.5 µm. On the other hands, other two prepared emulsions with single surfactant provided larger size of droplets. Note that the average droplet sizes in this work were calculated in term of surface-volume diameter. Apart from the stability due to small droplet size, the zeta potential of these emulsions indicated the presence of highly negative surface charge. They can be classified as stable since emulsions with zeta potential higher than |30| mV are generally classified as stable emulsion [19]. Repulsive interactions between droplets can be expected; as a result, no separation by gravity settling was obtained in the cases of cutting oil and lubricant oil as well as limited separation (12.3% oil removal) for palm oil emulsion.
Table 1. Characteristics of three types of stabilized oily-wastewaters.
Parameter Unit Analytical Method Cutting oil Lubricant oil Palm oil
Oil concentration g/L - 1.0 3.0 5.0
COD mg/L Closed reflux 2,846 1,010 10,190
pH - pH meter 8.8 8.1 7.6
Mean droplet size µm Optical microscope 0.5 2.0 8.0
Zeta potential mV Electrophoretic mobility -48.4 -37.9 -31.2
2.3. Coagulation and Flotation Experiments
[image:3.595.166.432.95.331.2] [image:3.595.68.530.576.653.2]Alum dosage was varied from 50 to 1000 mg/L, depending upon oily-wastewater types. The experiments were conducted by a series of rapid mixing (120 rpm) for 1 minutes followed by 20 minutes of slow mixing (30 rpm) before 30 minutes decantation.
In regard to IAF experiment, the flotation study was carried out in batch operation. Varied alum concentrations were added in the flotation system denoted as the modified induced air flotation or MIAF. Air flow rates (QG) and aeration times were applied in the ranges of 0.3 to 1.0 L/min and 0 to 50 minutes, respectively. Note that the result of each experiment presented in this paper was the average value of triplicate experiments at which good reproducibility can be obtained from every experiment.
2.4. Analytical Method
The oil removal efficiency in this work can be determined by mean of COD removal efficiency as in Eq. (1).
%Eff = (CODin- CODout)
CODin ×100 (1)
Mixing in the flotation cell due to bubbles motion was indicated by a global velocity gradient (G), Eq. (2), with the imparted power to water similar to bubble flocculator as in Eq. (3) [2], where C1 and C2 are constants with the values of 1.896 and 10.33, respectively.
G= √ P
μV (2)
P = C1QGlog(h + C2
C2
) (3)
Bubble hydrodynamic condition in this process was examined through several parameters. Bubble size (db) and its terminal rising velocity (Ub) were analyzed from samples of 180 to 200 bubbles by a photographic technique [20, 21] using a 120-frames/s high-speed camera (Basler Inc.) and image processing software (ImageJ). The bubble interfacial area (a) and bubble formation frequency (fb) can be determined from Eqs. (4) and (5), respectively [15].
a=Nb
Sb
Vtotal=fb
HL
Ub
πdb2
AHL+NbVb
(4)
fb= QG
Vb (5)
2.5. Factor Analysis using ANOVA
In order to analyze the influences of each parameter on the dependent variable as well as their interactions, Analysis of Variance method (ANOVA) was introduced. This method is a useful statistical technique that can determine both separated and jointed effects of each parameter. In this work, up to 3-ways ANOVA was calculated using MATLAB. The method evaluates the influences of the parameters and their interactions based on the hypothesis that all the data obtained from the same population having the same population mean. Therefore, when analyzing the means and variances of each parameter level, the significant difference can be identified when at least one of the means is highly deviated from the others, leading to the rejection of the same population mean. Consequently, the parameter was identified as the one having a strong effect [22].
ST=∑yi2 (6)
ST=SA+SB+SC+SAB+SAC+SBC+SABC+SE (7)
The degree of freedom for each parameter is also considered along with the sum of squares. After all ANOVA variables are prepared. The Fisher test (F-test) is used to determine the significance of each parameter and their interactions. The F-test is calculated according to the ratio of Si/SE where its significance level can be identified by using the F-distribution. This type of distribution can reflect in percent contribution (P) showing the relative power of a factor or interaction. Normally, when the P value is smaller than 0.05, the parameter has a highly effect on the dependent variable. The lower value of P also indicates the higher significance level.
2.6. Mathematical Modeling
The model was introduced in order to understand the results in the mathematically point of view. The dependent variable for modeling was the treatment efficiency while the independent variables consisted of the bubble interfacial area (a), velocity gradient (G), chemical coagulant dosage (Ca), oil concentration (Co), and mean droplet size of oil (d). The function of the model is expressed in Eq. (7).
%Eff of model = yi = f(a, G, Ca, Co, d) (8)
The methodology to develop of the model was based on the non-linear regression for the optimization of the model. The groups of variables were arranged and adjusted their functions on the equation. The optimum model was obtained when achieving the minimum mean absolute percentage error (MAPE), which can be calculated via Eq. (8), where fi is the treatment efficiency from experiment, yi is the treatment efficiency calculated from the model, and n is the number of data used for developing the model.
MAPE=1
n∑ |
fi-yi (fi+yi)/2 |
n
i=1
(9)
3.
Result and Discussion
3.1. Preliminary Treatment
From the preliminary experiments, three stabilized oily-emulsions cannot be effectively separated by gravity or decantation after 360-minutes test since oil-droplets are very fine in sizes [23]. No separation can be observed in the cases of cutting oil and lubricant oil. However, limited removal efficiency by decantation was found from the palm oil emulsion. This result can be directly related to the difference in droplet sizes as palm oil droplets were larger than those of other emulsions (Table 1). Higher separating velocity and efficiency of larger droplets can be expected [24]. Furthermore, the presence of surfactants in these emulsions played a role in their stabilities that prevents the aggregation among droplets due to the electrostatic repulsive forces between charged oil surfaces [25, 26]. Breaking of an emulsion including layering, flocculation, and coalescence is therefore important for enhancing the removal efficiency.
In summary, gravity separation was ineffective when applying with these stabilized oil emulsions; however, the removal efficiency can be enhanced through chemical coagulation. In an attempt to minimize the chemical employed and improve the separation performance, flotation was considered for dealing with these stable oil emulsions.
3.2. Separation of Oily Emulsions by Induced Air Flotation (IAF)
Firstly, induced air flotation (IAF) was applied for oil separation under various gas flow rates (QG) of 0.1–1.0 L/min. The maximum removal efficiencies can be obtained from the low gas flow rate of 0.3 L/min for all oil types, which were better than that of decantation. Though, limited efficiency was acquired in the case of cutting oil emulsion due to the stability of the emulsion itself. Higher separation efficiencies of lubricant and palm oils can be noticed. This can directly relate to the droplet sizes as the maximum removal efficiencies of 8%, 33%, and 47% were obtained after 15-minutes operation for cutting oil, lubricant, and palm oil, respectively. The lowest removal efficiency obtained from cutting oily-emulsion with the smallest oil droplet size (0.5 µm) followed by lubricant oily-wastewater with 2.0 µm and palm oily-wastewater with 8.0 µm of average oil droplet size as shown in Table 1 [24]. Moreover, electrostatic repulsion can hinder the contact between bubbles and oil droplets since bubbles also contained negative surface charge with the reported zeta potential of -20 mV to -60 mV in the pH range of 2–10 [30, 31]. It can be suggested that physical process alone, IAF in this case, was insufficient for treating these oily wastewaters. The combination with other processes had to be considered for improving the separation performance. As indicated from the coagulation results, addition of coagulant could enhance the oil separation efficiencies of flotation. Therefore, the combination of physical and chemical treatment techniques, denoted as the modified induced air flotation (MIAF) in this work, was then tested.
3.3. Separation of Oily Emulsions by Modified Induced Air Flotation (MIAF)
In this MIAF process, alum was introduced into the system through a 6-inch length static mixer installed after the pressure gauge. Due to the fact that the sizes of the generated bubbles in IAF process were in the millimeter range, they can create mixing inside the column that could be sufficient for flocculation before separation as in a bubble flocculator [2]. For the given oily-wastewater types, the removal efficiency from MIAF process were greater than the single IAF process (i.e. 0 mg/L alum concentration) similarly to that reported in other study [32]. As exhibited in Fig. 2, the improved efficiencies of 85% can be achieved in all cases at the proper alum dosages, which were similar to the optimal concentrations from the jar test experiments, i.e. 150 mg/L, 400 mg/L, and 800 mg/L for cutting oil, lubricant oil, and palm oil, respectively. Increasing the alum concentration beyond these dosages had very slight effects on the efficiencies. The addition of coagulant played a major role in the reduction of repulsive interactions among droplets themselves and between bubbles and droplets, which led to the formation of aggregates or droplet-bubble agglomerates. It should be noticed that the difference in coagulant dosage requirement is mainly caused by the different oil concentration used. However, other characteristics as shown in Table 1 also affect the destabilization. As can be seen, lubricant and palm oils at the alum dosages of 100 or 150 mg/L at which the removal efficiencies of palm oil were higher than those of lubricant oil even palm oil contains higher concentration. It can be explained by the fact that the lubricant has larger zeta potential than the palm oil wastewater. The same can be observed for 50 mg/L of alum dosage as the cutting oil (lowest concentration) has slightly lower efficiency compared to the other two.
Fig. 2. Removal efficiencies with gas flow rates by MIAF of (a) cutting oil; (b) lubricant oil; and (c) palm oil.
As indicated from the result, bubbles played an important role in both flocculation and separation. The proper mixing and sufficient available bubbles were required in order to attain the good treatment performance. Therefore, the analysis in term of hydrodynamics inside the system should be conducted. The obtained information can provide better understanding on effects of bubbles in the oil separation by flotation as well as for application in the appropriate process control.
3.4. Bubble Hydrodynamics, Mixing Parameters
To analyze this process in terms of bubble hydrodynamic and mixing, data of bubble size and rising velocity were collected by the high-speed camera in every experimental condition (varied oil types and air flow rates). The results of average bubble diameter (db) and rising velocities (Ub) by the photographic method are displayed in Table 2. Effects of gas flow rate on bubble size can be seen as larger bubbles were observed at higher QG. This trend was similar to those reported in other works [15, 34]. As a result, the variation of rising velocity also had the same trend. These generated bubbles remained spherical in shape suggested by Weber number (Web= ρfUb2db⁄γwg) <1 [35]. It is worth noting that no effects of oil types and concentration on bubble size and its velocity can be seen both oil droplets and bubbles contain negative surface charges. No aggregation that could lead to bubble enlargement can be observed. Due to the fact that bubbles in IAF and MIAF played a role in both separation and mixing, parameters for analyzing their effects were calculated in terms of specific interfacial area of bubble (a) and gradient velocity (G) to represent both roles of bubbles, respectively. The results are displayed in Table 2.
The specific bubble interfacial area (a) can be defined as the ratio of total bubble surface area to overall volume of the flotation cell, Eq. (4), which indicates available bubble surface area within the system. Since flotation performance is governed by efficiencies of three sub-processes including collision, attachment, and stability [36]; higher available surface can lead to greater probability of collision and attachment resulting in
0 20 40 60 80 100
0.0 0.2 0.4 0.6 0.8 1.0 1.2
E ff ic ie ncy ( % )
QG(L/min)
0 mg/L 50 mg/L
100 mg/L 150 mg/L
(a) 0 20 40 60 80 100
0.0 0.2 0.4 0.6 0.8 1.0 1.2
E ff ic ie ncy ( % )
QG(L/min)
0 mg/L 50 mg/L
100 mg/L 150 mg/L
300 mg/L 400 mg/L
(b) 0 20 40 60 80 100
0.0 0.2 0.4 0.6 0.8 1.0 1.2
Eff ic ie nc y ( % )
QG(L/min)
0 mg/L 50 mg/L
100 mg/L 150 mg/L
300 mg/L 400 mg/L
600 mg/L 800 mg/L
[image:7.595.74.521.78.419.2]efficiency but leads to higher operating cost. On the contrary, turbulence in the system must be controlled in the proper range since it can have both positive and negative impacts on the performance. Mixing can enhance the collision probability by mean of turbulent diffusion but reducing the stability of bubble-particle aggregations.
From this reason, the ratio between these two key parameters was constructed in term of a/G as proposed in other works [15, 37]. This ratio has to be controlled in the appropriate range as low a/G indicates the insufficient bubble surface or excess turbulence, which could hinder the separation performance of flotation. In contrast, high a/G suggests the generation of surplus bubble generation or insufficient mixing in the flotation cell that could limit the bubble-particle collision. The relation between a/G ratios and gas flow rates is also shown in Table 2.
Table 2. Bubble parameters in IAF process.
QG
(L/min) (mm) db (mm/s) Ub (ma -1)
G (s-1)
a/G (s/m)
0.1 0.84 140 42.3 93 0.46
0.3 0.93 167 95.2 160 0.59
0.5 1.02 197 121.8 207 0.59
0.7 1.10 204 138.4 245 0.56
1.0 1.25 280 138.7 293 0.47
It can be found that a/G was gradually increased until reaching the highest value at the gas flow rates between 0.3 to 0.5 L/min. Then, a/G value declined after 0.5 L/min of QG. In detail, raising the QG increased the interfacial area due to the increased amount of bubble; however, it provoked higher velocity gradient. At high QG regime, the gradient was enlarged contrasting with the slightly increase of the interfacial area due to bubbles coalescence [38]; subsequently, a/G ratio was reduced. Note that the maximum of the a/G values can be found at the QG of 0.3 to 0.5 L/m that corresponded to the flow rate providing the highest removal efficiency in both IAF and MIAF (Fig. 2). Therefore, the a/G ratio can be used as one of significant parameter in order to select the optimum operating condition of flotation. Moreover, the increase of a/G ratio will relate to the gas flow rates not only high interacting opportunity/surface between oil droplets and bubbles, but also proper mixing condition between generated bubbles and droplets.
Fig. 3. Treatment efficiency versus a/G ratio for three oily-wastewaters at optimum coagulant dosages.
Effects of a/G ratio on the treatment efficiency at the optimum coagulant dosage was shown in Fig. 3. It can be found that the treatment efficiencies obtained from MIAF for all types of oily-wastewater were increased linearly with the a/G values, where the presumption mention earlier was confirmed. In addition, at the same a/G value, the differences of removal efficiencies obtained with the MIAF processes were clearly observed. These results confirm that not only the interacting and mixing phenomena control the overall removal efficiency, but also the chemical dosages applied in the MIAF process as well as their mean droplet
60 70 80 90 100
0.4 0.45 0.5 0.55 0.6 0.65
E
ff
ic
ie
ncy
(
%
)
a/G (s/m) Cutting
[image:8.595.68.530.239.329.2] [image:8.595.174.423.483.656.2]sizes can affect the associated performances. The mean droplet size of each oil type had a significant effect on the treatment efficiency due to the fact that the small droplets required longer time to separate as already discussed in section 3.1. However, at this point it can be seen that the effect of a/G ratio on the treatment efficiency of every oil were not exactly the same, as the palm oil treatment efficiency increased sharply with a/G ratio comparing with other oils. Hence, it can be presumed that the mean droplet sizes not only affected the treatment efficiency directly but also had an influence on the effect of a/G ratio on the treatment efficiency. From these reasons, oil droplets and applied chemical agents, in addition, were stated as other two key parameters in both flotation processes (IAF and MIAF). In order to understand effects of a/G mathematically, ANOVA of the treatment efficiency as a function of a/G ratio, coagulant concentration, and mean droplet sizes was conducted.
3.5. Factor Analysis using ANOVA
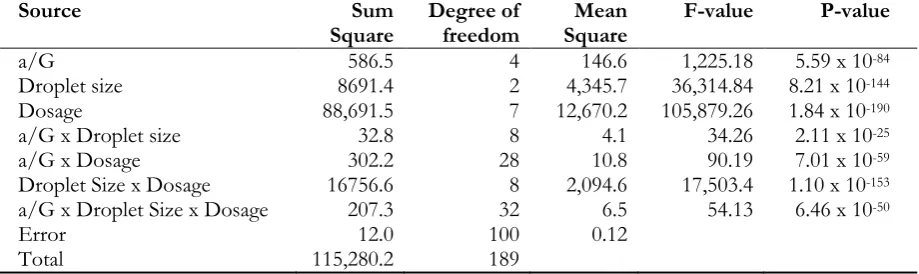
The 3-ways ANOVA result determined using MATLAB is shown in Table 3. The total degree of freedom of the error was 100 indicating the sufficient numbers of experiment used in ANOVA. It can be seen in the table that each single parameter has a strong effect on the treatment efficiency. Among all, the droplet size and chemical dosage yield the lowest p-value suggesting that the treatment efficiency was highly dependent on the droplet size and the chemical dosage. The coagulant dosage had the greatest effects on the efficiency suggested by the highest F value. This corresponded to the experimental results at which the dosage played a key role on the separation performance of flotation as well as the finding in other work [12]. The size of oil droplets was also one key factor. This can be explained by the fact that the sizes of droplet and bubble in the system are the factors governing the collision in several mechanisms (i.e. interception, inertial effect, and sedimentation), which affects the overall efficiency of flotation as discussed in the previous section. The discussion in details on the bubble-particle collision can be found elsewhere [39]. The factor analysis also emphasized the influence of a/G ratio on the separation effectiveness. Without the suitable condition of a/G, the promising treatment efficiency could not be obtained. These three factors, therefore, should be further examined in order to determine their impacts on the performance of flotation as well as optimize the process for efficient oil separation.
Table 3. Result of 3-ways ANOVA for treatment efficiency as functions of a/G, droplet size, and dose.
Source Sum
Square Degree of freedom Square Mean F-value P-value
a/G 586.5 4 146.6 1,225.18 5.59 x 10-84
Droplet size 8691.4 2 4,345.7 36,314.84 8.21 x 10-144
Dosage 88,691.5 7 12,670.2 105,879.26 1.84 x 10-190
a/G x Droplet size 32.8 8 4.1 34.26 2.11 x 10⁻²⁵
a/G x Dosage 302.2 28 10.8 90.19 7.01 x 10-59
Droplet Size x Dosage 16756.6 8 2,094.6 17,503.4 1.10 x 10-153
a/G x Droplet Size x Dosage 207.3 32 6.5 54.13 6.46 x 10-50
Error 12.0 100 0.12
Total 115,280.2 189
[image:9.595.68.528.465.602.2]point, it can be seen that all the parameters (a/G, dosages, droplet sizes) had relatively powerful influences between each other. The p-value of the 3-ways ANOVA of all the parameters at 6.46 x 10-50 also confirmed the incidence.
Although ANOVA was able to determine the significance level of each parameter on the treatment efficiency, it could not identify how the parameters affected the efficiency. Hence, the mathematical model using non-linear regression was developed in the next section in order to investigate the effect of each parameter mathematically.
3.6. Prediction of Flotation Performance by a/G Ratio
The mathematic modeling concerning overall treatment efficiency as dependent variable and other variables as independent variables was constructed. The independent variables were consisted of a/G ratio, Al(OH)3 dosage, as well as, characteristics of each oily-wastewater which mentioned in Table 1. The modeling utilized the optimization function for extracting the variable relation and proposed the prediction model. From the modeling methodology described in section 2.5, it was found that the treatment efficiency was appropriately depending on 3 major variables including a/G ratio, alum to oil concentration ratio (Ca/Co), and mean oil droplet size (d) as expressed in Eq. (10) for the ranges of Al(OH)3 concentration and a/G ratio within the boundary of this research. Note that the alum to oil concentration ratio was used as the representative of dosage concentration because not only it becomes a dimensionless group but it also represents the dosage used in the experiment at different initial concentration of oil where the equation can be further used in other solutions.
%Eff = 1474.2(d0.3) [(a
G)
2
+0.7]+ 28.8 d0.135(
Ca
Co
)0.58 (10)
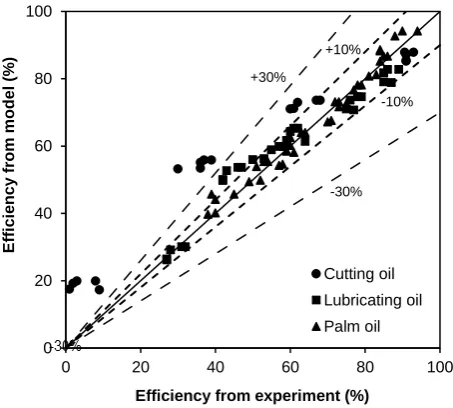
Figure 4 exhibits the treatment efficiencies of the model in comparing with the experiments, where a relatively good agreement was obtained. Most of the predicted efficiency was less than 30 % discrepancy; however, the large deviation occurred due to the limitation of the model at low coagulant dosage. This limitation of the correlation can be explained by the fact that the coagulant dosage had the great impact on the efficiency as indicated in the factor analysis (section 3.5). The predicted efficiencies at low coagulant dosages were then overestimated comparing to the experimental results. Therefore, the used dosage has to be optimized before applying flotation for separation. Under the optimal range of coagulant concentrations, this model was valid with a good agreement between the predicted and experimental efficiencies, particularly for the removal efficiencies higher than 85% where 10% discrepancy was obtained (Fig. 4). The MAPE of the model calculated with Eq. (9) is 14.05%, which can be indicated that the model has a promising accuracy.
Fig. 4. Treatment efficiency of the constructed model compared to the experimental results.
0 20 40 60 80 100
0 20 40 60 80 100
E
ff
ic
ie
ncy
f
rom
m
odel
(
%
)
Efficiency from experiment (%) Cutting oil Lubricating oil Palm oil +30%
-30% +10%
[image:10.595.181.408.537.741.2]Furthermore, Eq. (10) confirms the factor analysis result in section 3.5 that all the parameters had strong influences on each other. Most of the terms in the equation are the combination between a/G, dosage, and droplet size. In the model, it can be seen that if there was no coagulant addition and bubbles. The efficiency depends only on the mean droplet size. The larger droplet size results in higher treatment efficiency, which is consistent with the experiment results. Moreover, the effects of a/G ratio as well as the Ca/Co ratio on the treatment efficiency were also involved by the mean droplet size. The last term in the equation also indicates the necessary for the coagulant dosage, where large amount of treatment efficiency can be increased.
In summary, using ANOVA along with the mathematical modeling gave the promising result. The techniques had capability to identify the level of significance not only the individual ones but also their interactions. The mathematical modeling supported ANOVA as it could express how each parameter affects to the treatment efficiency, in term of the prediction equation. This equation can be further used to predict treatment efficiency of IAF and MIAF process which is very useful especially for a design purpose. Further works can be conducted to improve the prediction of the model by having a larger set of experiment data. A larger column should also be investigated in order to identify the effect of the column size. A neural network as well as other prediction techniques might be introduced in order to improve the performance of the prediction model.
4.
Conclusion
The objective of this work is to study the treatment mechanism of three stabilized oily emulsion types. For this purpose, Coagulation, induced air flotation (IAF) and also their combination by mean of modified induced air flotation (MIAF) were applied and analyzed in terms of treatment efficiency, chemical dosage, bubble hydrodynamic, and also mixing conditions. The performances of MIAF process were greater than those of decantation, IAF, and coagulation alone. The ratio of interfacial area to velocity gradient (a/G) has been proved as the important parameter in process control in order to achieve the good performance in the treatment of oily wastewater by flotation. The factor analysis using ANOVA indicated highly influences between chemical dosage and a/G ratio as well as droplet size on the treatment efficiency. The influence of droplet size and chemical dosage was the greatest one, indicating that the coagulant concentration played a key role in the treatment efficiency improvement. Other characteristics such as zeta potential of different oil emulsion also affected the destabilization mechanism at varied coagulant dosage through their surface charge property. Moreover, effects of a/G in the flotation performance were emphasized from the analysis.
In order to understand effects of each parameter and their interaction mathematically, the model has been proposed for predicting the overall treatment efficiency with those main factors. A good agreement between the experimental and the predicted treatment efficiencieswas obtained with the mean absolute percentage error (MAPE) of 14.05%. The model suggested that the effect of a/G ratio on the treatment efficiency depends on the mean size of oil droplet. In addition, the coagulant dosage has to be considered when different droplet sizes of oil were used since there was a strong effect of mean oil droplet size on the coagulant concentration. In the future, it is essential to continue studying oily water separation by flotation with different types of chemical agents and gas diffusers in order to extend the operating condition ranges and validate the proposed correlation. In addition, the results should be compared and validated with those tested in a large bubble column operating at higher gas flow rates for process analysis in more practical scenario.
Acknowledgement
Nomenclature
% Eff Treatment efficiency (%)
a Bubble interfacial area (m-1)
A Cross-sectional area of reactor (m2)
C1 Constant (1.896)
C2 Constant (10.33)
Ca Concentration of coagulant dosage (mg/L)
Co Concentration of oil (mg/L)
CODin Initial COD (mg/L)
CODout COD after treated (mg/L)
d Mean oil droplet size (m)
db Bubble diameter (m)
fb Bubble formation frequency (s-1)
fi Treatment efficiency of experiment (%)
G Velocity gradient (s-1)
HL Liquid height (m)
h Depth of diffuser (m)
n number of experiment used to develop the model (-)
P Power imparted in water (watt, J/s)
QG Gas flow rate (m3/min)
Ub Bubble terminal rising velocity (m/s)
V Water volume in reactor (m3)
Vb Volume of bubble (air) in reactor (m3)
Vtotal Total volume (m3) = V + Vb
yi Treatment efficiency of the model (%)
Greek letters
µ Liquid phase viscosity (Nm/s)
γwg Interfacial tension between gas and liquid phases (mN/m)
References
[1] M. Santander, R. T. Rodrigues, and J. Rubio, “Modified jet flotation in oil (petroleum) emulsion/water separations,” Colloids Surf. Physicochem. Eng. Asp., vol. 375, pp. 237–244, 2011. doi:10.1016/j.colsurfa.2010.12.027
[2] Metcalf & Eddy, Inc., G. Tchobanoglous, F. L. Burton, and H. D. Stensel, Wastewater Engineering:
Treatment and Reuse. McGraw-Hill Education, 2003.
[3] M. D. LaGrega, P. L. Buckingham, J. C. Evans, Hazardous Waste Management, 2nd ed. Waveland Press, 2010.
[4] W. J. Bartz, “Lubricants and the environment,” Tribol. Int., vol. 31, pp. 35–47, 1998. [5] Y. Aurelle, “Treatments of oil-containing wastewater,” Chulalongkorn University, 1985.
[6] J. Rubio, M. L. Souza, and R. W. Smith, “Overview of flotation as a wastewater treatment technique,”
Miner. Eng., vol. 15, pp. 139–155, 2002. doi:10.1016/S0892-6875(01)00216-3
[7] M. L. Hami, M. A. Al-Hashimi, and M. M. Al-Doori, “Effect of activated carbon on BOD and COD removal in a dissolved air flotation unit treating refinery wastewater,” Desalination, vol. 216, pp. 116– 122, 2007. doi:10.1016/j.desal.2007.01.003
[8] A. A. Al-Shamrani, A. James, and H. Xiao, “Destabilisation of oil–water emulsions and separation by dissolved air flotation,” Water Res., vol. 36, pp. 1503–1512, 2002. doi:10.1016/S0043-1354(01)00347-5 [9] L. A. Féris and J. Rubio, “Dissolved air flotation (DAF) performance at low saturation pressures,” Filtr.
Sep., vol. 36, pp. 61–65, 1999. doi:10.1016/S0015-1882(99)80223-7
[10] G. Rı́ os, C. Pazos, and J. Coca, “Destabilization of cutting oil emulsions using inorganic salts as coagulants,” Colloids Surf. Physicochem. Eng. Asp., vol. 138, pp. 383–389, 1998. doi:10.1016/S0927-7757(97)00083-6
[11] A. Pinotti and N. Zaritzky, “Effect of aluminum sulfate and cationic polyelectrolytes on the destabilization of emulsified wastes,” Waste Manag., vol. 21, pp. 535–542, 2001. doi:10.1016/S0956-053X(00)00110-0
[12] C. A. I. Leech, S. Radhakrishnan, M. J. Hillyer, and V. R. Degner, “Performance evaluation of induced gas flotation machine through mathematical modeling,” J. Pet. Technol., vol. 32, pp. 48–58, 1980. doi:10.2118/7246-PA
[13] B. Meyssami and A. B. Kasaeian, “Use of coagulants in treatment of olive oil wastewater model solutions by induced air flotation,” Bioresour. Technol., vol. 96, pp. 303–307, 2005. doi:10.1016/j.biortech.2004.04.014
[14] K. Bensadok, M. Belkacem, and G. Nezzal, “Treatment of cutting oil/water emulsion by coupling coagulation and dissolved air flotation,” Desalination, vol. 206, pp. 440–448, 2007. doi:10.1016/j.desal.2006.02.070
[15] P. Painmanakul, P. Sastaravet, S. Lersjintanakarn, and S. Khaodhiar, “Effect of bubble hydrodynamic and chemical dosage on treatment of oily wastewater by Induced Air Flotation (IAF) process,” Chem.
Eng. Res. Des., vol. 88, pp. 693–702, 2010. doi:10.1016/j.cherd.2009.10.009
[16] P. Painmanakul, K. Loubière, G. Hébrard, M. Mietton-Peuchot, and M. Roustan, “Effect of surfactants on liquid-side mass transfer coefficients,” Chem. Eng. Sci., vol. 60, pp. 6480–6491, 2005. doi:10.1016/j.ces.2005.04.053
[17] R. F. de Sena, R. F. P. M. Moreira, and H. J. José, “Comparison of coagulants and coagulation aids for treatment of meat processing wastewater by column flotation,” Bioresour. Technol., vol. 99, pp. 8221– 8225, 2008. doi:10.1016/j.biortech.2008.03.014
[18] M. Tir and N. Moulai-Mostefa, “Optimization of oil removal from oily wastewater by electrocoagulation using response surface method,” J. Hazard. Mater., vol. 158, pp. 107–115, 2008. doi:10.1016/j.jhazmat.2008.01.051
[19] J. D. Clogston and A. K. Patri, “Zeta potential measurement,” in Characterization of Nanoparticles Intended for Drug Delivery. Humana Press, 2011, pp. 63–70. doi:10.1007/978-1-60327-198-1_6
[20] W. Kracht, C. O. Gomez, and J. A. Finch, “Controlling bubble size using a frit and sleeve sparger,” Miner. Eng., vol. 21, pp. 660–663, 2008. doi:10.1016/j.mineng.2007.12.009
[22] D. Montgomery and G. Runger. Applied Statistics and Probability for Engineers, 6th ed. Wiley, 2013. Available: https://www.wiley.com/en-us/Applied+Statistics+and+Probability+for+Engineers%2C +6th+Edition-p-9781118539712 [Accessed: June 18, 2018].
[23] M. J. Schick, “Encyclopedia of emulsion technology, volume 1, basic theory,” J. Polym. Sci. Part C: Polym.
Lett., pp. 680–682, 1983. doi:10.1002/pol.1983.130210820.
[24] W. J. Souza, K. M. C. Santos, A. A. Cruz, E. Franceschi, C. Dariva, A. F. Santos, C. C. Santana, W. J. Souza, K. M. C. Santos, A. A. Cruz, E. Franceschi, C. Dariva, A. F. Santos, and C. C. Santana, “Effect of water content, temperature and average droplet size on the settling velocity of water-in-oil emulsions,” Braz. J. Chem. Eng., vol. 32, pp. 455–464, 2015. doi:10.1590/0104-6632.20150322s00003323
[25] Q. Chang, Colloid and Interface Chemistry for Water Quality Control. Boston, MA: Elsevier, 2016.
[26] M. L. S. Welz, N. Baloyi, and D. A. Deglon, “Oil removal from industrial wastewater using flotation in a mechanically agitated flotation cell,” Water SA, vol. 33, pp. 453-458, 2007. doi:10.4314/wsa.v33i4.52939
[27] U. Tezcan Un, A. S. Koparal, and U. Bakir Ogutveren, “Electrocoagulation of vegetable oil refinery wastewater using aluminum electrodes,” J. Environ. Manage., vol. 90, pp. 428–433, 2009. doi:10.1016/j.jenvman.2007.11.007
[28] J. Duan and J. Gregory, “Coagulation by hydrolysing metal salts,” Adv. Colloid Interface Sci., vol. 100, pp. 475–502, 2003. doi:10.1016/S0001-8686(02)00067-2
[29] N. Chawaloesphonsiya, P. Guiraud, and P. Painmanakul, “Analysis of cutting-oil emulsion destabilization by aluminum sulfate,” Environ. Technol., vol. 39, pp. 1450–1460, 2018. doi:10.1080/09593330.2017.1332101
[30] C. Yang, T. Dabros, D. Li, J. Czarnecki, and J. H. Masliyah, “Measurement of the zeta potential of gas bubbles in aqueous solutions by microelectrophoresis method,” J. Colloid Interface Sci., vol. 243, pp. 128– 135, 2001. doi:10.1006/jcis.2001.7842
[31] C. Li and P. Somasundaran, “Reversal of bubble charge in multivalent inorganic salt solutions—Effect of aluminum,” J. Colloid Interface Sci., vol. 148, pp. 587–591, 1992. doi:10.1016/0021-9797(92)90193-P [32] D. S. J. AlMaliky, H. A. AlAjawi, and N. A. AlBayati, “Study of induced air flotation for the removal
of oils from the effluents of sweets and dairy industries,” Iraqi J. Mech. Mater. Eng. C, pp. 535–542, 2009. [33] A. Bunturngpratoomrat, O. Pornsunthorntawee, S. Nitivattananon, J. Chavadej, and S. Chavadej, “Cutting oil removal by continuous froth flotation with packing media under low interfacial tension conditions,” Sep. Purif. Technol., vol. 107, pp. 118–128, 2013. doi:10.1016/j.seppur.2013.01.024
[34] K. Loubière and G. Hébrard, “Bubble formation from a flexible hole submerged in an inviscid liquid,”
Chem. Eng. Sci., vol. 58, pp. 135–148, 2003. doi:10.1016/S0009-2509(02)00468-2
[35] R. Clift, J. R. Grace, and M. E. Weber, Bubbles, Drops, and Particles. Mineola, NY: Dover, 2013.
[36] J. Ralston and S. S. Dukhin, “The interaction between particles and bubbles,” Colloids Surf. Physicochem.
Eng. Asp., vol. 151, vol. 3–14, 1999. doi:10.1016/S0927-7757(98)00642-6
[37] S. S. Mohammed, “Effect of hydrodynamics characteristics on flotation treatment process of oily wastewater,” M.S. thesis, Department of Chemical Engineering, University of Technology, 2012. [38] P. Painmanakul, J. Wachirasak, M. Jamnongwong, and G. Hebrard, “Theoretical prediction of
volumetric mass transfer coefficient (kLa) for designing an aeration tank,” Eng. J., vol. 13, no. 3, pp. 13–28, 2009. doi:10.4186/ej.2009.13.3.13