I
Trends and patterns in the climate of Libya
(1945-2010)
Thesis submitted in accordance with the requirements of
the University of Liverpool for the degree of Doctor of
Philosophy
ISMAIL MASSOUD AGEENA
November 2013
II
CONTENTS
CONTENTS Page
Title Page I
Contents II
List of Figures XIII
List of Tables XXI
Acknowledgements XXVII
Declaration XXVIII
Abstract XXIX
CHAPTER 1: INTRODUCTION 1
1.1 Introduction 1
1.2 The climate of Libya 1
1.3 Climate and climate change 3
1.3.1 Global climate change 4
1.3.2 Climate change across North Africa and the Mediterranean 4
1.4 Thesis aims and objectives 6
1.5 Thesis structure 8
1.6 Summary 9
CHAPTER 2: LITERATURE REVIEW 11
2.1 Introduction 11
III
2.2.1 Lengthof record 11
2.2.2 Resolution 13
2.2.2.1Temperature 13
2.2.2.2 Precipitation 15
2.2.2.3 Wind speed and direction 15
2.2.2.4 Relative humidity 15
2.2.2.5 Air pressure 16
2.2.2.6 Sun-shine duration 16
2.3 Climatic variability 16
2.2.1 Temperature variations 16
2.3.1.1 Global variations of temperature 17 2.3.1.2 Regional variations of temperature 19 2.3.1.3 Local variations of temperature 22
2.3.2 Precipitation variations 23
2.3.2.1 Global variations of precipitation 23 2.3.2.2 Regional variations of precipitation 24 2.3.2.3 Local variations of precipitation 25
2.2.3 Evapotranspiration variations 26
2.3.3.1 Global variations of evapotranspiration 26 2.3.3.2 Regional variations of evapotranspiration 27
2.3.3.3 Local variations of evapotranspiration 27
2.4 Climate projection models and reanalysis 28
2.4.1 Reanalysis data 28
2.4.2 Variability in observations and model
data of temperature and precipitation 28
IV
CHAPTER 3 DATA SETS AND METHODS 31
3.1 Introduction 31
3.2 Data type and availability across Libya 31
3.3 Meteorological station selection 32
3.3.1 Data quality and management 34
3.3.2 Localized data quality and checks 35
3.4 Data analysis 38
3.4.1 Statistics (descriptive statistic tests) 38
3.4.1.1 Normalized and Percentiles 38
3.4.2 Graphical method 38
3.4.2.1 Histogram 38
3.4.2.2 Box plot 39
3.4.3 Measures of association 39
3.4.3.1 Correlation coefficient 39
3.4.3.2 Time series plots 40
3.4.4 Statistical trend detection methods 41
3.4.4.1 Regression 41
3.4.4.2 T- test 41
3.4.4.3 Standard error bars 42
3.4.4.4 Mann-Kendall trend test 42
3.4.4.5 Sen’s slope estimator 44
3.4.4.6 The Mann-Whitney test 44
3.5 Potential evapotranspiration 45
3.5.1 Penman-Monteith method (PETP-M) 45
3.5.2 The Thornthwaite approach (PET-TW) 46
V
3.6 Reanalysis methodology 48
3.6.1 Site selection 48
3.7 Summary 49
CHAPTER 4: TEMPERATURE 50
4.1 Study area 51
4.2 Data quality (source) and management 52
4.3 Maximum temperature 55
4.3.1 Multi-decadal variations and trends 55
4.3.2 Daily variations and trends 55
4.3.3 Monthly variations and trends 58
4.3.4 Seasonal and sub-seasonal variations 61
4.3.5 Annual variations and trends 65
4.3.6 Decadal variations 68
4.4 Minimum temperature 69
4.4.1 Multi-decadal variations and trends 69
4.4.2 Daily variations and trends 69
4.4.3 Monthly variations and trends 71
4.4.4 Seasonal and sub-seasonal variations 73
4.4.5 Annual variations and trends 77
4.4.6 Decadal variations 80
4.5 Mean average temperature 81
4.5.1 Multi-decadal variations and trends 82
4.5.2 Daily variations and trends 82
4.5.3 Monthly variations and trends 84
VI
4.5.5 Annual variations and trends 90
4.5.6 Decadal variations 93
4.6 Dry bulb temperature 94
4.6.1 Annual variations and trends 94
4.7 Correlation between temperature and regional factors 95
4.7.1 Temperature and population growth 95
4.7.2 Temperature and Carbon Dioxide 97
4.7.3 Temperature and cloud cover 99
4.8 Extremes of temperature 100
4.8.1 Annual variations and trends of warm extremes
temperature 101
4.8.2 Seasonal variations and trends of warm extremes
temperature 105
4.8.3 Annual variation and trends of cold extremes
temperature 106
4.8.4 Seasonal variation and trends of cold extremes
temperature 108
4.9 Discussion 109
4.9.1 Mean maximum temperature 109
4.9.2 Mean minimum temperature 110
4.9.3 Mean average temperature 111
4.9.4 Warm and cold extremes temperature 112
4.10 Summary 112
CHAPTER 5: PRECIPITATION 114
VII
5.2 Data quality (source) and management 115
5.3 Data analysis 119
5.3.1 Temporal variability of precipitation 119 5.3.1.1 Multi-Decadal variation and trends 122
5.3.1.2 Daily variation and trends 122
5.3.1.3 Monthly variation and trends 125
5.3.1.4 Seasonal and sub-seasonal variations and trends 130
5.3.1.5 Annual variations and trends 133
5.4 Spatial variability of precipitation 137
5.4.1 Multi-decadal changes 139
5.4.1.1 Western region 139
5.4.1.2 Central region 139
5.4.1.3 Eastern Stations 140
5.4.1.4 North Sahara region 142
5.4.1.5 South Sahara region 142
5.5 Regional correlation analysis of temperature 144
5.5.1 Analysis of annual total precipitation at adjacent stations 144 5.5.2 Correlation between precipitations and mean temperature 146 5.5.3 Precipitation and Carbon Dioxide (CO2) 147
5.6 Number of rainy days 148
5.6.1 Annual changes and trends of rainy days 148 5.6.2 Seasonal changes and trends of rainy days 151
5.7 Precipitation extremes 153
5.7.1 Intensity of precipitation 153
5.7.1.1 Changes and trends of annual intensity
VIII
5.7.1.2 Seasonal changes and trends in intensity
of precipitation 154
5.7.2 Changes and trends of consecutive dry days 157 5.7.3 Changes and trends of consecutive wet days 158 5.7.4 Changes and trends of heavy precipitation days 159 5.7.5 Changes and trends of maximum 1-day precipitation 160
5.8 Discussion and conclusion 161
5.9 Summary 165
CHAPTER 6: EVAPOTRANSPIRATION 167
6.1 Study area 167
6.2 Data analyses 169
6.3 Variations and trends of annual meteorological variables 170 6.3.1 Mean maximum temperature and minimum
temperature 170
6.3.2 Precipitation 170
6.3.3 Wind speed 171
6.3.4 Relative humidity 174
6.3.5 Sunshine duration 176
6.3.6 Atmospheric pressure 178
6.4 Potential evapotranspiration (PET) 180
6.4.1 The Thornthwaite approach (PET-TW) 180
6.4.1.1 Observation, changes and trends of annual
potential evapotranspiration (PETTW) 181
IX
6.4.2.1 Observation, changes and trends of
potential evapotranspiration (PETP-M) 186
6.4.2.2 Changes and trends of monthly potential
evapotranspiration 189
6.4.2.3 A comparison of two annual potential
evapotranspiration methods of PETT-W 191
6.4.2.4 Relationships between PETP-M and
climate variables 192
6.5 Actual evapotranspiration (AET) 196
6.5.1 Changes and trends in the Reference
evapotranspiration (ETRef) 198
6.5.1.1 Annual changes and trends 198
6.5.1.2 Seasonal reference evapotranspiration (ETRef)
changes and trends 201
6.5.1.3 Monthly reference evapotranspiration (ETRef)
changes and trends 203
6.6 Discussion 206
6.6.1 Climatic variability 206
6.6.2 Potential evapotranspiration 207
6.6.3 Reference evapotranspiration 208
6.7 Summary 209
CHAPTER 7: CLIMATE REANALYSIS 211
7.1 Data and method 212
7.1.1 Stations data 212
X
precipitation dataset 212
7.1.3 ERA-Interim reanalysis temperature and
precipitation dataset 213
7.2 Spatial variability of mean average temperature 214
7.3 Comparison of variability in temperature 215
7.3.1 Comparison of NCEP/NCAR and ERA-Interim with
observation data of annual means average temperature 216 7.3.2 Comparison of NCEP/NCAR and ERA-Interim
with observation data of seasonal and sub-seasonal
means average temperature 219
7.4 Temporal changes and trends in temperature 223
7.4.1 Annual variations and trends 223
7.4.2 Seasonal and sub-seasonal variations and trends 224 7.4.2.1 Variations and trends of NCEP/NCAR and
observed seasonal and sub-seasonal means
average temperature 224
7.4.2.2 Variations and trends of ERA-interim and observation data seasonal means
average temperature 226
7.5 Differences between the observations and modelled
mean average temperature data 227
7.6 Correlation between the observations and modelled
mean average temperature data 230
7.6.1 Annual correlation 230
7.6.2 Seasonal correlation 232
XI
7.8 Comparison of variability in precipitation 234
7.8.1 Comparison of NCEP/NCAR and ERA-Interim with
observation data of annual means total precipitation 234 7.8.2 Comparison of NCEP/NCAR and ERA-Interim with
observation data of seasonal means total precipitation 237
7.9 Temporal changes and trends in precipitation 239
7.9.1 Annual variations and trends 239
7.9.2 Seasonal and sub-seasonal variations and trends 240 7.10 Differences between the observations and modelled total
precipitation data 242
7.11 Correlation between the observations and modelled precipitation
data 244
7.12 Discussion 246
7.12.1 Mean average temperature 246
7.12.2 Precipitation 247
7.13 Summary 249
CHAPTER 8: DISCUSSION AND CONCLUSION 251
8.1 Summary discussions of parameters 252
8.1.1 Temperature 252
8.1.1.1 Causes of increases temperature 254
8.1.2 Precipitation 257
8.1.2.1 Potential causes of variability in Libyan
precipitation 258
8.1.3 Evapotranspiration 260
XII
8.1.4 Other climatic parameters 262
8.1.5 Reanalysis 262
8.2 Implications of future climate change 263
8.2.1 Implications of change in climate on the human health 263 8.2.2 Implications of change in climate on environmental
variables 264
8.3 Recommendations for future study 265
8.4 Review of aims and objectives 267
8.5 Conclusion 269
References 271
XIII
FIGURES
Figure Page
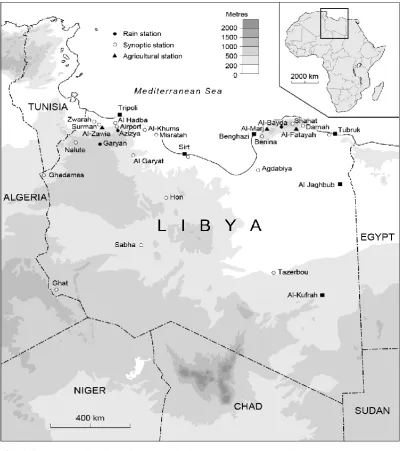
Fig. 1.1: The distribution of meteorological stations across Libya. 3
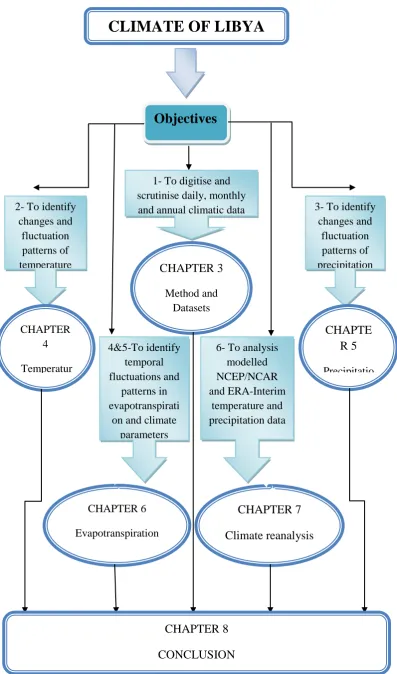
Fig. 1.2: Thesis structure. 10
Fig. 3.1: The distribution of meteorological stations across Libya 34
Fig. 4.1: The distribution of synoptic stations within this study
across Libya. 52
Fig. 4.2: Annual means 11-day moving averages of the mean
daily maximum temperature for the two periods 1956-1982 and
1983-2010 at a) Zwarah and; b) Sabha 57
Fig. 4.3: Mean monthly maximum temperature for the two periods
1945-1977 and 1978-2010 at a) Musratah and; b) Sabha 60
Fig. 4.4: Mean maximum temperature for the two periods 1945-1977
and 1978-2010 at a) autumn; and, b) spring, with error bars
representing two standard errors (95.4% confidence level). 64
Fig. 4.5:Annual means maximum temperature for the two periods
1945-1977 and 1978-2010 of; a) Zwarah and; b) Sabha 66
Fig. 4.6: Mean annual maximum temperature for the two periods
1945-1977 and 1978-2010 at the synoptic stations across Libya, with error bars representing one standard error
(68.4% confidence level). 67
Fig. 4.7: Decadal mean of 11-day moving average of the mean
XIV
over near decadal windows for, a) Binina: and, b) Ghadames. 68
Fig. 4.8: Annual means 11-day moving averages of the mean daily
minimum temperature for the two periods 1956-1982 and
1983-2010 at a) Sirt and; b) Al-Kufrah 70
Fig. 4.9: Mean monthly minimum temperature for the two periods
1945-1977 and 1978-2010 at a) Ajdabyia and; b) Hon 72
Fig. 4.10: Mean minimum temperature for the two periods 1945-1977
and 1978-2009, at a) summer; and b) autumn with error
bars representing two standard errors (95.4% confidence level). 76
Fig. 4.11: Annual mean minimum temperature at a) Binina and; b) Hon. 79
Fig. 4.12: Mean annual minimum temperature for the two periods
1945-1977 and 1978-2010 at the 15 synoptic stations across Libya, with error bars representing two standard errors
(95.4% confidence level). 80
Fig. 4.13: Decadal mean of 11 day moving averages of the mean daily
minimum temperature over near decadal windows for a) Zwarah and; b) Al-Jaghbub for the period 1961-2009, with the curves
from a separate decadal block. 81
Fig. 4.14: Annual means 11-day moving averages of the mean daily
minimum temperature for the two periods 1956-1982 and
1983-2010 at a) Musratah and; b) Ghadames. 83
Fig. 4.15: Mean monthly average temperature for the two periods
1945-1977 and 1978-2010 at a) Tripoli Airport and;
b) Al-Jaghbub. 85
Fig. 4.16: Mean annual average temperature for the period 1945-2010
XV
Fig. 4.17: Mean annual average temperature for the two periods
1945-1977 and 1978-2010 at the 15 synoptic stations across
Libya, with error bars representing two standard errors
(95.4% confidence level). 92
Fig. 4.18: Decadal mean of 11-day moving averages of the mean daily
average temperature over near decadal windows for a) Jalo and; b) Sabha, for the period 1961-2010, with the curves for
each separate decadal block. 93
Fig. 4.19: The total population and changes in annual minimum
temperature for the cities; a) Tripoli Airport; b) Musratah; c)
Binina; d) Sabha (1964-2006). 96
Fig. 4.20: Mean average temperature (°C) and concentration of carbon
dioxide (CO2) in (mill. t.) acrossLibya (1960-2009). 98
Fig. 4.21: The mean average temperature and mean annual total amount
of cloud (Oktas) for the significant stations; a) Ajdabyia; b)
Darnah; c) Shahat and; d) Nalute for the period 1945-2010 100
Fig. 4.22: Regional annual anomalies series during 1961-2010 for a) TXx
(Zwarah); b) TN90 (Shahat); and c) TX90 (Al-Jaghbub). 103
Fig. 4.23: Regional annual anomalies series during 1961-2010 for a) TNn
(Binina); b) TN10 (Al-Jaghbub) and; c) TX10 (Al-Kufrah). 107
Fig. 5.1: The distribution of stations within this study across Libya. 117
Fig. 5.2: Mean annual total precipitation at coastal regions a) western; b)
central; c) eastern stations across Libya. 121
Fig. 5.3: An 11 day, moving mean daily precipitation variation with
differences between two periods(1956-1982 and 1983-2010) at;
XVI
Fig. 5.4: Mean annual precipitation for the 30 year intervals of two
periods 1956-1982 and 1983-2010 for coastal stations, with
error bars representing two standard errors (95.4% confidence level) 124
Fig. 5.5: Histogram and cumulative monthly precipitation (1945-2010),
at; a) eastern-coastal region; b) western-coastal region; c)
central-coastal region and; d) western mountains region 127
Fig. 5.6: Mean monthly precipitation for the 30 year intervals of two
periods 1945-1977 and 1978-2010 for significant months with
one standard error (68.2% confidence level). 129
Fig. 5.7: Mean seasonal precipitation for the two periods 1945-1977 and
1978-2010 for coastal stations, at; a) Spring and; b) winter with error bars representing three standard errors
(68.2% confidence level). 132
Fig. 5.8: Annual means 10-year moving averages of the mean annual total
precipitation during the period 1945-2010 at number of coastal
stations 134
Fig. 5.9: Mean annual total precipitation for the two periods 1945-1977
and 1978-2010); a) coastal stations; and b) inland stations, with error bars representing one standard error
(68.2% confidence level). 136
Fig. 5.10: Ranges in annual total precipitation for the 28 stations
across Libya (1945-2010); a) coastal stations; and b) inland stations, with maximum, minimum, lower quartile (first quartile -25%),
median (50%) and the upper quartile (third quartile –75%). 138
Fig. 5.11: Normalised annual precipitation anomalies and values
XVII
dry (percentile 0.25), normal (percentile 0.50), wet (percentile 0.75) and very wet (> percentile 0.90) for coastal regions (1945-2010) a)
western; b) central; and c) eastern-coastal region. 141
Fig. 5.12: Normalised annual precipitation anomalies and values
corresponding to the limits of very dry (< percentile 0.10), dry (percentile 0.25), normal (percentile 0.50), wet (percentile 0.75) and very wet (> percentile 0.90) for inland regions (1945-2010)
a) North Sahara; and b) South Sahara. 143
Fig. 5.13 Total annual precipitation (mm) and concentration of carbon
dioxidein (parts per billion-ppb) for the inland region (1960-2009) 147
Fig. 5.14: Time series of mean annual number of precipitation days
(NPD) in Shahat, Darnah and Sirt for the period 1945-2010. 149
Fig. 5.15: Time series of meanseasonal number of precipitation days (NPD)
for the period 1945-2010; a) winter; b) autumn and; c) Spring 152
Fig. 5.16: Time series of annual intensity of precipitation at Binina,
Tripoli Airport and Sirt (1961-2010) 154
Fig. 5.17: Time series of maximum number of consecutive days (CDD)
with precipitation less than 1.0 mm at Shahat and Musratah
for the period1961-2010 157
Fig. 5.18: Time series of maximum number of consecutive wet days
(CWD) with precipitation greater than 1.0 mm at Shahat and
Nalute for 1956-2010 159
Fig. 6.1: The distribution of synoptic stations within this study. 168
Fig. 6.2: Year to year variation of annual mean wind speed for significant
changes for the period 1961-2010. 172
XVIII
significant changes at a) coastal stations and; b) inland stations
across Libya for the period 1961-2010. 175
Fig. 6.4: Year to year variation of annual mean daily sunshine duration
1961-2010. 177
Fig. 6.5: Year to year variation of annual mean atmospheric pressure
for significant changes across Libya for the period 1961-2010 at: a)
coastal stations: and b) inland stations 179
Fig. 6.6: Mean monthly PETT-W, with trend rate at a) coastal region
and; b) inland region across Libya (1961-2010). 184
Fig. 6.7: Time series of significant trends in PETP-M for a) coastal stations;
and; b) inland stations during the period 1961-2010. 188
Fig. 6.8: Mean monthly PETP-M, with values of trend rate valuesat a)
coastal region and; b) inland region across Libya (1961-2010) 190
Fig. 6.9: Normalized annual potential evapotranspiration anomalies of
Thornthwait and Penman-Monteith formula at; a) coastal
region and: b) inland region for the period 1961-2010 191
Fig. 6.10: The annual PETP-M as a function on wind speed of the
inland stations for the period 1961-2010 193
Fig. 6.11: The seasonal PETP-M as function of; a) spring T. max for
the coastal region; b) summer T. max; c) autumn RH for
the coastal region for the period 1961-2010. 195
Fig. 6.12: Spatial distribution of annual references evapotranspiration at
stations across Libya, trend values are given as (mm a‾¹). 200
Fig. 6.13: Spatial distribution of seasonal references evapotranspiration at
stations across Libya, trend values are given as (mmM-¹). 204
XIX
NCEP/NCAR and ERA-Interim grid points within this study 213
Fig. 7.2: Ranges in mean annual average temperature for observation
and modelled data (NCEP/NCEP and ERA-Interim) data at Ajdabyia, Hon and Nalute, with maximum, minimum, lower quartile (first quartile -25%), median (50%) and the
upper quartile (third quartile –75%) 215
Fig. 7.3: Normalised annual mean average temperature anomalies of
observation and NCER/NCAR data at; a) Ajdabyia; b) Hon and: c)
Nalute for 1948-2010 217
Fig. 7.4: Normalised annual mean average temperature anomalies of
observation and ERA-Interim data at; a) Ajdabyia; b) Hon and: c)
Nalute for 1979-2010 218
Fig. 7.5: Normalised seasonal mean average temperature anomalies of
observation and reanalysis NCER/NCAR data at; a) Hon
(summer); b) Nalute (spring) and; c) Ajdabyia (winter). 220
Fig. 7.6: Normalised seasonal mean average temperature anomalies of
observation and ERA-Interim data at; a) Nalute (spring); b) Hon
(autumn) and c); Ajdabyia (winter). 222
Fig. 7.7: Mean annual average temperature for a) observation and
ERA-Interim data; b) observation and NCEP/NCAR data with error
bars representing two standard errors (95.4% confidence level). 229
Fig. 7.8: The annual observations mean average temperatures as function
of a) NCEP/NCAR at Ajdabyia; and b) Hon; b) Nalute c)
ERA-Interim at Ajdabyia; and d) Nalute 231
Fig. 7.9: Ranges in annual total precipitation of observation and
XX
Hon and Nalute, with maximum, minimum, lower quartile (first quartile–25%), median (50%) and the upper quartile
(third quartile –75%). 233
Fig. 7.10: Normalised annual precipitation anomalies of observation
and NCEP/NCAR data at; a) Hon and: b) Nalute for the
period 1979-2010. 235
Fig. 7.11: Normalised annual precipitation anomalies of observation
and ERA- Interim data at; a) Ajdabyia and: b) Nalute for the
period 1979-2010. 236
Fig. 7.12: Normalised seasonal precipitation anomalies of observation
and ERA- Interim data at; a) Nalute (autumn), b) Ajdabyia
(spring) and; Hon (winter) for the period 1979-2010. 238
Fig. 7.13: Annual mean total precipitation for a) observation and
NCEP/NCAR data; b) observation and ERA-Interim data with error bars representing two standard errors
(95.4% confidence level). 243
Fig. 7.14: The annual observation total precipitation as function on
modelled data a) Ajdabyia of NCEP/NCAR; b)
XXI
TABLES
Tables Page
Table 2.1: List of meteorological stations in Libya 14
Table 2.2: Rates of changes in temperature identified by previous studies 18
Table 2.3: Rates of change in temperature identified by previous studies 21
Table 3.1: List of the meteorological stations used within this study 33
Table 4.1: The data used within the study, with missing temperature data 54
Table 4.2: a) Values of the Mann-Kendall statistic (Q) for monthly
precipitation, with statistically significant levels at the synoptic stations, with; b) significant changes (95% confidence level)
for the two periods 1945-1977 and 1978-2010 across Libya. 59
Table 4.3: Values of the Mann-Kendall statistic (Q) for seasonal maximum
temperature (° C), with statistically significant levels at 15
synoptic stations across Libya (1945-2010) 62
Table 4.4: Values of the Mann-Kendall statistic (Q) for annual maximum
temperature, with statistically significant levels at the synoptic
stations across Libya 65
Table 4.5: Values of the Mann-Kendall statistic (Q) for monthly minimum
temperature, with statistically significant levels at the synoptic stations, with; b) significant changes (95% confidence level) for
the two periods 1945-1977 and 1978-2010 across Libya. 74
Table 4.6: Values of the Mann-Kendall statistic (Q) for seasonal
XXII
at 15 synoptic stations across Libya (1945-2010) and Mann-Whitney test in 15 stations for two periods
1945-1977 and 1978-2010. 75
Table 4.7: Values of the Mann-Kendall statistic (Q) for annual minimum
temperature, with statistically significant levels at the synoptic
stations across Libya 78
Table 4.8: Values of the Mann-Kendall statistic (Q) for monthly
precipitation, with statistically significant levels at the synoptic stations, with; b) significant changes
(95% confidence level) for the two periods 1945-1977 and
1978-2010 across Libya 86
Table 4.9: Values of the Mann-Kendall statistic (Q) for seasonal
mean average temperature, with statistically significant levels at 15 synoptic stations across Libya (1945-2010) and
Mann-Whitney test in 15 stations for two periods 1945-1977
and 1978-2010. 89
Table 4.10: Values of the Mann-Kendall statistic (Q) for annual mean
average temperature, with statistically significant levels at the
synoptic stations across Libya 90
Table 4.11: Values of the Mann-Kendall statistic (Q) for annual mean
dry bulb temperature (° C), with statistically significant levels
at 15 Libyan synoptic stations 95
Table 4.12: Total carbon dioxide (CO2; million tons), emissions across
Libya for the period 1960-2009 97
Table 4.13: Correlation coefficient between mean annual temperature
XXIII
amount (1945-2010) and carbon dioxide emission
(1960-2009) at stations and the regions across Libya 99
Table 4.14: Definition of six temperature indices used in this thesis
for 1961-2010 101
Table 4.15: Values of the Mann-Kendall statistic (Q) for indices trends
calculating from minimum and maximum temperature, with statistically significant levels at 15 synoptic stations
across Libya for the period 1961-2010 104
Table 4.16: Values of the Mann-Kendall statistic (Q) for Seasonal
extremes maximum (warmest day; TXx) temperature (° C), with statistically significant levels at 16 synoptic stations
across Libya for the period 1961-2010 105
Table 4.17: Values of the Mann-Kendall statistic (Q) for Seasonal
extremes minimum (coldest day; TNn) temperature (° C), with statistically significant levels at 16 synoptic stations
across Libya for the period 1961-2010 108
Table 5.1: The data used within the study, with missing
precipitation data 118
Table 5.2: Total precipitation record length at each station
(all years not necessarily used in this study, see Table 5.1),
number of years of missing data, record duration and annual total precipitation broken down into intervals (with
percentage of precipitation within each interval in brackets). 120
Table 5.3: Values of the Mann-Kendall statistic (Q) for Mean monthly
precipitation (MMP), with statistically significant levels
XXIV
Table 5.4: Values of the Mann-Kendall statistic (Q) for seasonal
precipitation at 15 stations across Libya (1945-2010),
with statistically significant levels 130
Table 5.5: Values of the Mann-Kendall statistic (Q) for annual
precipitation at 28 stations across Libya, with statistically
significant levels 135
Table 5.6: Correlation coefficient between annual total precipitation at
the adjacent stations and the regions across Libya 145
Table 5.7: Correlation coefficient between mean annual temperature and
annual total precipitation at the synoptic stations across Libya 146
Table 5.8: Values of the Mann-Kendall statistic (Q) for annual and seasonal
number of precipitation days (NPD), with statistically significant
levels at 14 stations across Libya (1945-2010) 150
Table 5.9: Values of the Mann-Kendall statistic (Q) for the intensity of
precipitation (IP), with statistically significant levels at 14
stations across Libya (1961-2010) 156
Table 5.10: Values of the Mann-Kendall statistic (Q) for extremes
precipitation; Consecutive dry days (CDD), Consecutive wet days (CWD), Heavy precipitation days (P10), with
statistically significant levels for the period (1961-2010) 158
Table 5.11: Values of the Mann-Kendall statistic (Q) for maximum
1day precipitation (Px1day), with statistically significant
levels for the period (1961-2010) 160
Table 6.1: The data used within the study, with missing climatic
parameter data of maximum (T. max), minimum temperature (T. min), wind speed (SW), relative humidity (RH),
XXV
Table 6.2: Values of the Mann-Kendall statistic (Q) for climatic
parameters; wind speed, relative humidity, sunshine duration
and atmospheric pressure (°C), with mean annual values and
statistically significant levels for the period (1961-2010) 173
Table 6.3: Absolute values of annual and seasonal potential
evapotranspiration (mm a‾¹); Thornthwaite evaporation for the 16 stations, with significant (95% confidence level) for
the period (1961-2010). 182
Table 6.4: Values of the trend rate for mean monthly PETT-W, with
statistically significant levels (mm/month) in coastal and
inland regions for the period 1961-2010 183
Table 6.5: Absolute values of annual and seasonal PETP-M (mm a‾¹)
for the 16 stations, with significant (95% confidence level)
for the period (1961-2010) 187
Table 6.6: Values of the trend rate for mean monthly PETP-M,
with statistically significant levels (mm/month) in coastal and
inland regions for the period 1961-2010 189
Table 6.7: Correlation coefficient (r) between PETP-M and meteorological
Parameters 194
Table 6.8: Values of the Mann-Kendall statistic (Q) for mean annual (mm a-1) and seasonal (mm/seasonal) total of references evapotranspiration, with statistically significant levels at 16
synoptic stations across Libya (1961-2010) 199 Table 6.9: Values of the Mann-Kendall statistic (Q) for monthly references
XXVI
during period 1961-2010 205
Table 7.1: Mann-Kendall statistic (Q) for annual mean average
temperature of observed and modelled NCEP/NCAR and
ERA-Interim data, with statistical significance levels 223
Table 7.2: Mann-Kendall statistic (Q) for seasonal mean average
temperature of observed and modelled NCEP/NCAR and
ERA-Interim data, with statistical significant levels 225
Table 7.3: Significant (95% confidence level *) annual, seasonal
and monthly differences in mean average temperature of
observed and modelled NCEP/NCAR and ERA-Interim data. 228
Table 7.4: Correlation coefficient (r) between observations and modelled
(NCEP and ERA-Interim) data 230
Table 7.5: Values of the Mann-Kendall statistic (Q) for mean annual
total precipitation of Observation and the modelled data of NCEP/NCAR and of ERA-Interim, with statistically significant
levels at Ajdabyia, Hon and Nalute 239
Table 7.6: Values of the Mann-Kendall statistic (Q) for seasonal
precipitation (mm) of observation and reanalysis NCEP/NCAR (1948-2010) and ERA-Interim (1979-2010), with statistically
significant levels at Ajdabyia, Hon and Nalute. 241
Table 7.7: Correlation coefficient (r) between observations and modelled
XXVII
ACKNOWLEDGEMENTS
First I would like kindly to thank my supervisors, Professor Andrew Morse and Dr Neil Macdonald for their support and guidance over the last 48 months for the support and encouragement to me during the critical time since 2011; without whom this thesis would not have been possible, not forgetting Professor Bob Woods who unfortunately passed away during the course of my study.
Thanks are also extended to the staff of Department of Geography and Planning, University of Liverpool and those who helped, in particular Ms Jayne Avies, Ms Suzanne Yee, Dr Cyril Caminade and Dr David Macleod. Thanks must also go to the University of Al-Zawia and Department of Climatology at National Meteorological Centre in Libya, especially Mr Jalal Abu-Khshiam and Mr Khalid Elfadli who helped me to obtain and review the climatic data. My thanks to the Ministry of Higher Education and Scientific Research and Libyan Embassy-Cultural Attaché in London (UK) and in Libya for offering me the opportunity to study for this PhD. Finally, thanks also go to my brothers, sisters and friends they were very helpful at all times.
My special thanks, and gratitude for my family; wife; Mrs Iman, son; Aseal and daughters; Safa, Thana, Buthina and Marwa who have been supporting me for the last 6 years
This work is dedicated to the
XXVIII
DECLARATION
I hereby declare that the following thesis is based on the results of investigations conducted by myself, and that this thesis is of my own composition. This thesis has not, in whole or part, been previously presented for a higher degree. Work other than my own is clearly indicated in the text by reference to the relevant researcher or publications.
Ismail M. Ageena
The work presented in this thesis is the work of the candidate Ismail Massoud Ageena. Conditions of the relevant ordinance and regulations have been fulfilled.
Professor: Andy Morse
Dr: Neil Macdonald
XXIX
ABSTRACT
Trends and patterns in the climate of Libya (1945-2010) Ismail Massoud Ageena
Climate change is one of the most important issues affecting the world at the beginning of the twenty-first century. This thesis explores changes and trends within the principal climatic parameters temperature for 18 synoptic stations, precipitation for 28 meteorological stations and 16 synoptic stations for evapotranspiration inter alia, during the last 66 years (1945-2010) across Libya. Eighteen meteorological stations were selected along the Mediterranean coast where ten inland stations were selected from the North and South Sahara regions. The study period of temperature is divided into two series of equal length (27 years), 1956 to 1982 and 1983 to 2010 are used to assess and provide comparison in rate of change.
XXX
The reanalyses data are applied to compare the results from two commonly used reanalysis datasets, with the station data used to examine the reliability of the gridded products and for the station data to estimate the missing and unreliable data.
- 1 -
Chapter 1
INTRODUCTION
____________________________________________________________________
The purpose of this chapter is to introduce the key themes within this thesis, contextualise the research and present the aims and structure of the thesis.
1.1 INTRODUCTION
There are over 11,000 weather observation stations around the world measuring different weather and climatic parameters over land and sea, as well as satellites, ships and aircraft that also take measurements. According to the World Meteorological Organization (WMO), a large volume of monthly temperature, precipitation and air pressure data from meteorological across the globe have been taken since the late Seventeenth century.
During the late 20th century, natural scientists have increasingly focused on climate change and its implications on the environment. The first World Climate Conference (1979), led to the establishment of the WMO World Climate Programme, followed by the second conference in 1990. The Intergovernmental Panel on Climate Change was initiated in 1988, and published its first four assessment reports in 1990, 1995, 2001 and 2007 respectively; a firth report will be published in 2013. An increasing public awareness of the dangers of pollution in the 1950s coincided with the first evidence of warming temperatures. By the mid-1970s, increasing evidence of human activity influencing the global climate emerged (McMichael et al., 2003).
1.2 THE CLIMATE OF LIBYA
- 2 -
region located in northeast Libya near the cities of Shahat and Al-Bayda (Fig. 1.1). Topography is generally free of steep terrain, with the exception of two regions in the north-west and north-east where the elevation ranges from 500 to ~1000 m above mean sea level (a. m. s. l: Al-Haram 1995). The shoreline extends for roughly 2000 km from the Libyan-Tunisian border in the west to the Libyan-Egyptian border in the east. In the coastal region, the elevation ranges from 47 m below mean sea level at Sabkhat Al-Ghuzayyil to 198 m a.m.s.l in Garyan in the western Mountains. The highest point is Bikku Bitti 2267 m (a.m.s.l) in the Tibesti Mountains in southern Libya. The population of Libya in 2006 was estimated by the General Directorate of Documentation and Information (GDDI) at 5,323,991 and was estimated at 6,901,830 in 2010 with the projected population for the year 2025 near 10 million.
- 3 -
Fig. 1.1: The distribution of meteorological stations across Libya.
1.3 CLIMATE AND CLIMATE CHANGE
Climate refers to the average weather experienced typically over a 30 year period, and can consist of a variety of parameters e.g. temperature, precipitation, humidity, wind, air pressure and dew point temperature. The climate has changed many times during the history of our planet (Pidwirny, 2006), as a result of three principal factors:
i. natural events which have changed the climate, either locally, regionally or globally, such as volcanic eruptions,
- 4 - 1.3.1 Global climate change
The last four decades have witnessed extensive research concerning climatic fluctuations and trends of climatic parameters in different regions and for different time periods. A large number of studies have examined trends and variability of climatic parameters through a wide range of spatial and temporal scales, from the global to the local (e.g. Jones et al. 1999; Easterling et al. 1999; Hansen et al. 2007; Giannini et al., 2008; Giorgi and Lionello, 2008; Tayanc et al., 2009).
According to the Assessment Report of the Intergovernmental Panel on Climate Change (IPCC 2007), the global surface temperature has increased by 0.74 °C ± 0.18 °C (the mean values calculated from 1906-2005) and precipitation has risen north of 30° N (the mean values calculated from 1906-2005), with strongest downward trends in precipitation observed in the Sahel region of African occurring during the period 1950-2005. These tends support the predictions of temperature increases made by the National Oceanic and Atmospheric Administration (NOAA), that global warming during the last 25 years has increased at a rate of about 0.02 °C a-1. The 20th century was the warmest century during the past 1000 years, with rapid changes over Libya in the last 40 years (El-Tantawi 2005), with temperature increases identified in many regions throughout the world (Repapis and Philandras 1988; Karl et al 1993; Jones et al., 1999; Hulme et al 2001; Alexander et al 2006; Domonkos and Tar, 2003; Hansen et al, 2007; IPCC 2007). The United Nation Framework Convention on Climate Change (Parry et al., 2009) estimated that annual spending adapting to some of the worst impacts of climate change could be $49-171bn in developed countries and $22-105bn in developing countries by 2030.
1.3.2 Climate change across North Africa and the Mediterranean
- 5 -
2002; Massoud 2004; El-Tantawi, 2005; El Kenawy et al., 2009; Ageena et al., 2012; Ageena et al., 2013).
A large body of research has been undertaken on Mediterranean and North Africa climate variability particularly focused on temperature (e.g. Repapis and Philandras 1988; Nasrallah and Balling 1993; Ben-Gai et al. 1999; Hasanean 2001; Goubanova and Li, 2007; Bartolini et al 2008; Hatzianastassiou et al., 2008; Dousset et al., 2011; Yu et al., 2011; Boccolari and Malmusi, 2013) and precipitation (Goubanova and Li, 2007; Hatzianastassiou et al., 2008; Caloiero et al., 2011; De Luis, 2009; Reiser and Kutiel, 2011; Unal et al., 2012), with most identifying a general decrease in precipitation across the Mediterranean basin; these changes in precipitation patterns have drastically reduced food production capacity and increase the likelihood of short-run crop failures and long-run production declines (Parry et al., 2004)
A number of studies have identified that climate change could significantly modify existing water resources and balance in the: USA (Loáiciga et al 2000; Croley et al., 2003), Australia (Ducci et al., 2008; Ali et al., 2012), Europe (Eckhardt and Ulbrich, 2003), Africa (Brown et al., 2011) and across the Mediterranean (Ceballos-Barbancho et al., 2008; Polemi and Casarano 2008), with increasing temperature and decreasing precipitation directly and indirectly affecting many factors including groundwater budgets (Loaiciga et al., 2000).
Agriculture is extremely vulnerable to climate change across the Mediterranean; with higher temperatures potentially reducing yields of important crops. A considerable literature exists on the potential implications of climatic change on the productivity of crops and impacts of increased aridity (Emgailee 2005; Huntingford et al., 2005;
- 6 -
Climate change will likely have the strongest effect on developing countries and countries where the agricultural sector is of high importance for the country’s economy; for example, Gonzales (2001) has identified that vegetation zones shifted southwest in the West African Sahel by 25 to 30 km during the period 1945-1993, at an average rate of 500 to 600 ma-1.
A number of studies throughout the world have been undertaken on climatic change and potential implications on the environment (e.g., Al-Adiwish, 2000; Bou-Zeid1 and El-Fadel, 2002; Al-Abidee, 2001; Al-Hasee, 2007; Kafle and Bruins, 2009; Schilling et al., 2012), with the studies by Basu and Samet (2002); Vandentorren et al. (2004); Canouï-Poitrine et al. (2006); Pascal et al. (2006); Robine et al. (2008); Gosling et al. (2009) and Yu et al. (2011) addressing concerns relating to the implication of climatic change to human health. The implications of climate change on the environment and human health are notable, particularly in the North Africa and Mediterranean regions and indicate significant increases in morbidity and mortality. The implications of climate change are worrying for the Mediterranean region as socioeconomic scenarios indicate a rapidly growing population and consequently growing human pressure on natural resources (Thomas, 2008; Sowers et al 2011), with the study by Schilling et al. (2012) suggesting that these pressures may contribute to increased social and political instability.
1.4 THESIS AIMS AND OBJECTIVES
The main aim of this thesis is to investigate the evidence of climate change across Libya and to produce a comprehensive study of climate variability change and trends.
More specifically, the objectives are as follows:
- 7 -
2. To identify temporal fluctuations, patterns and trends in temperature, across Libya based on (a) annual data, (b) seasonal data, (c) monthly data, and (d) daily data; and to identify and examine any spatial changes within the data. Extremes in warm and cold temperature across Libya are also analysed.
3. To identify temporal fluctuations, patterns, and trends in precipitation, across Libya based on (a) annual data, (b) seasonal data, (c) monthly data, and (d) daily data; and to identify and examine any spatial changes within the data. Number of precipitation days, intensity of precipitation and extremes in precipitation across Libya are also analysed.
4. To identify temporal fluctuations and patterns in potential and actual evapotranspiration based on (a) annual data, (b) seasonal data, (c) and monthly data and comparison between two potential evapotranspiration of Penman-Monteith and Thornthwaite across Libya. Relationships between potential evapotranspiration and climatic parameters are also considered during the last 50 years 1961-2010.
5. To identify temporal fluctuations and patterns in climatic parameters; surface wind speed, relative humidity, sun shine duration and atmospheric pressure on annual data across Libya for the last 50years (1961-2010).
6. To analysis modelled NCEP/NCAR (1948-2010) and ERA-Interim (1979-2010) temperature and precipitation data at three stations. Comparison of the observational dataset with the reanalysis NCEP/NCAR and ERA-Interim- is also considered.
- 8 - 1.5 THESIS STRUCTURE
This thesis is presented in eight chapters, addressing the aims and objectives identified previously (Fig. 1.2).
Chapter 2 identifies the data sources and information relating to the meteorological stations across Libya. This chapter includes a review of the literature on the sources of climate data and climatic change mechanisms and provides a detailed examination of the data analysis approaches used in this thesis. A discussion of the key climatic parameters (temperature, precipitation and evapotranspiration) examined in further detail within the thesis are also provided.
Chapter 3 describes the observational climatic data used in this thesis which were provided in a paper based format by the Libyan National Meteorological Centre (LNMC) and digitised for use in this thesis. Data type, observation period and geographical characteristics of the selected meteorological stations are described, as well as the data quality, management and integrity checking. The procedures and techniques of data processing used in this study together with analysis techniques applied are discussed.
Chapter 4 examines temperature variability from 18 synoptic stations across Libya for the period 1945-2010. Temporal and spatial changes and trends in multi-decadal, decadal, annual, seasonal, monthly and daily minimum, maximum and mean average temperature, dry bulb temperature as well as extremes in minimum and maximum temperature have been analysed.
Chapter 5 considers precipitation variability from 27 meteorological stations across Libya for the period 1945-2010. Temporal and spatial changes and trends of multi-decadal, decadal and annual, seasonal, monthly and daily precipitation as well as extremes of precipitation have been analysed in this chapter using a number of statistical tests, with further analysis of the number of rainy days.
- 9 -
spatial changes and trends in potential evapotranspiration (PE) for 13 stations for the period 1961-2010 and for actual evapotranspiration (ET) from 18 synoptic stations for the period 1961-2010 using the Penman-Monteith and Thornthwaite methods are considered.
Chapter 7 undertakes an analysis of the differences between the observed and ERA-Interim (European ECMWF) and NCEP (American) reanalysis datasets, with the ERA-Interim reanalysis spanning the period 1979-2010 at a spatial resolution of about 1.5 degree, while the NCEP reanalysis uses the period 1948-2010 and a spatial resolution of about 2.5 degree. This chapter compares the results from these two common reanalysis dataset, with the station data used within this study to examine the reliability of the gridded products.
Chapter 8 discusses the implications and findings at the three individual climatic parameters: temperature, precipitation and evapotranspiration and compares and assesses the performance of the long and short term changes, fluctuations and trends to the previous researches. This chapter also considers the limitations within the sites, data and methods used, together with an assessment of the objectives identified in Chapter 3.
Finally, the thesis is concluded with a summary of findings and a discussion of the implication of climate change on the environment, with particular reference to human impacts.
1.6 SUMMARY
- 10 -
Fig. 1.2: Thesis structure
CLIMATE OF LIBYA
Objectives
2- To identify changes and
fluctuation patterns of temperature
3- To identify changes and fluctuation patterns of precipitation 4&5-To identify temporal fluctuations and patterns in evapotranspirati
on and climate parameters
- 11 -
Chapter 2
LITERATURE REVIEW
____________________________________________________________________
This chapter will address past literature and review sources of climatic parameters data for the identification of global, regional and local climate changes, terminology relating to climate and the mechanisms of regional climate change and its implications.
2.1 INTRODUCTION
Climate change is one of the most important issues of the twenty-first century; increasing extremes of temperature, precipitation and evaporation have been identified in recent decades (McMichael et al., 2003). Changes in climate and extreme weather are considered as the most serious environmental challenge that threatens developed or developing countries; Libya is one of the driest countries in the world with significant changes recorded in temperature and precipitation during the last couple of decades, with serious impacts on the environment, human welfare, and socio-economic systems. This is being taken seriously by international authorities and has been received considerable attention from the Libyan government.
2.2 REGIONAL LONG DATA SERIES
2.2.1 Length of record
- 12 -
The scientific academy (Accademia del Cimento) was established by the Grand Duke of Tuscany Ferdinand II and his brother Prince Leopold de’ Medici in 1657, was providing the first network of meteorological observation in the world, it was closed by the Inquisition in 1697 (Camuffo et al., 2013). The earliest recorded rainfall records in the UK come from Burnley, Lancashire and start in 1677 (Craddock, 1976). In Southern France, the earliest weather observations were recorded by the Royal Company excavating the Canal du Midi in 1681. In Italy, daily series of precipitation at Padua and Bologna were initiated in 1716 by Giovanni Battista Poleni and Jacopo Bartolomeo Beccari, respectively. The observation of temperature, precipitation and air pressure data in Spain were initiated in Funchal on the Island of Madeira, between 1747 and 1753 by the English doctor Thomas Heberden.
The World Meteorological Organization (WMO) is a specialized agency of the United Nations, and originates from the International Meteorological Organization (IMO), which was founded in 1873. The WMO has established in 1950 and became the specialized agency of the United Nations in 1951 for meteorology, operational hydrology and related geophysical sciences with 191 Member States and Territories (on 1 January 2013). The WMO started collecting climatic data in 1923 from hundreds of weather observations around the world.
- 13 -
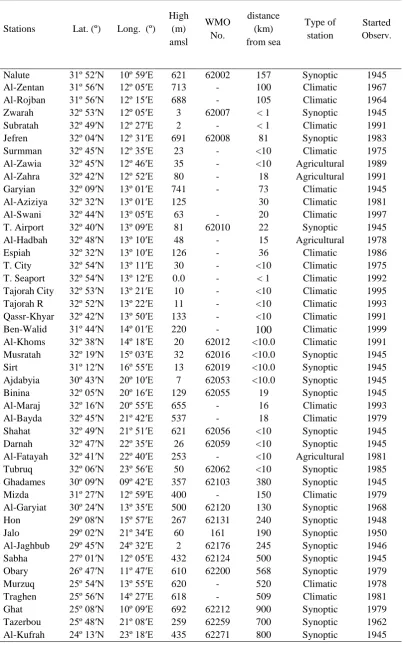
The names and reference numbers (WMO) of the meteorological stations are provided in Table 2.1, which includes altitudes, details of record length and resolution, station type and distance from the sea. The geographical distribution of the meteorological network across Libya is focused on the coast reflecting the distribution of densely populated communities in the western and eastern coastal regions.
The meteorological stations are included in Table 2.1 and consisted of synoptic and climatic stations that are set up to observe the general weather observations, where the synoptic stations are have a unique WMO reference number. Agricultural stations are mainly established to observe the agricultural parameters such as soil temperature and pan evaporation in addition to the basic weather observations.
2.2.2 Resolution
The Libyan meteorological stations are classified according to the observational weather parameters, with 21 synoptic, 16 climatic and 5 agricultural stations (Table 2.1). The synoptic and climatic stations observe nine weather parameters: temperature, precipitation, relative humidity, air pressure, dew point temperature, water vapour pressure, duration of sun-shine, cloud, wind speed and wind direction. In addition, the number of days with mist, fog, frost, snow, sand, haze, dust storm and thunder storms are observed. Four agricultural stations are located along the coastline: Al-Zawyia, Al-Zahra, Al-Hadbah and Al-Fatayah which were established in the 1990s to measure weather parameters, pan-evapotranspiration, wind speed at various heights and soil temperatures at various depths between 5 cm-150 cm.
2.2.2.1 Temperature
- 14 -
Table 2.1: List of meteorological stations in Libya
Stations Lat. (º) Long. (º)
High (m) amsl WMO No. distance (km) from sea Type of station Started Observ.
Nalute 31º 52′N 10º 59′E 621 62002 157 Synoptic 1945
Al-Zentan 31º 56′N 12º 05′E 713 - 100 Climatic 1967
Al-Rojban 31º 56′N 12º 15′E 688 - 105 Climatic 1964
Zwarah 32º 53′N 12º 05′E 3 62007 < 1 Synoptic 1945
Subratah 32º 49′N 12º 27′E 2 - < 1 Climatic 1991
Jefren 32º 04′N 12º 31′E 691 62008 81 Synoptic 1983
Surmman 32º 45′N 12º 35′E 23 - <10 Climatic 1975
Al-Zawia 32º 45′N 12º 46′E 35 - <10 Agricultural 1989
Al-Zahra 32º 42′N 12º 52′E 80 - 18 Agricultural 1991
Garyian 32º 09′N 13º 01′E 741 - 73 Climatic 1945
Al-Aziziya 32º 32′N 13º 01′E 125 30 Climatic 1981
Al-Swani 32º 44′N 13º 05′E 63 - 20 Climatic 1997
T. Airport 32º 40′N 13º 09′E 81 62010 22 Synoptic 1945
Al-Hadbah 32º 48′N 13º 10′E 48 - 15 Agricultural 1978
Espiah 32º 32′N 13º 10′E 126 - 36 Climatic 1986
T. City 32º 54′N 13º 11′E 30 - <10 Climatic 1975
T. Seaport 32º 54′N 13º 12′E 0.0 - < 1 Climatic 1992
Tajorah City 32º 53′N 13º 21′E 10 - <10 Climatic 1995
Tajorah R 32º 52′N 13º 22′E 11 - <10 Climatic 1993
Qassr-Khyar 32º 42′N 13º 50′E 133 - <10 Climatic 1991
Ben-Walid 31º 44′N 14º 01′E 220 - 100 Climatic 1999
Al-Khoms 32º 38′N 14º 18′E 20 62012 <10.0 Climatic 1991
Musratah 32º 19′N 15º 03′E 32 62016 <10.0 Synoptic 1945
Sirt 31º 12′N 16º 55′E 13 62019 <10.0 Synoptic 1945
Ajdabyia 30º 43′N 20º 10′E 7 62053 <10.0 Synoptic 1945
Binina 32º 05′N 20º 16′E 129 62055 19 Synoptic 1945
Al-Maraj 32º 16′N 20º 55′E 655 - 16 Climatic 1993
Al-Bayda 32º 45′N 21º 42′E 537 - 18 Climatic 1979
Shahat 32º 49′N 21º 51′E 621 62056 <10 Synoptic 1945
Darnah 32º 47′N 22º 35′E 26 62059 <10 Synoptic 1945
Al-Fatayah 32º 41′N 22º 40′E 253 - <10 Agricultural 1981
Tubruq 32º 06′N 23º 56′E 50 62062 <10 Synoptic 1985
Ghadames 30º 09′N 09º 42′E 357 62103 380 Synoptic 1945
Mizda 31º 27′N 12º 59′E 400 - 150 Climatic 1979
Al-Garyiat 30º 24′N 13º 35′E 500 62120 130 Synoptic 1968
Hon 29º 08′N 15º 57′E 267 62131 240 Synoptic 1948
Jalo 29º 02′N 21º 34′E 60 161 190 Synoptic 1950
Al-Jaghbub 29º 45′N 24º 32′E 2 62176 245 Synoptic 1946
Sabha 27º 01′N 12º 05′E 432 62124 500 Synoptic 1945
Obary 26º 47′N 11º 47′E 610 62200 568 Synoptic 1979
Murzuq 25º 54′N 13º 55′E 620 - 520 Climatic 1978
Traghen 25º 56′N 14º 27′E 618 - 509 Climatic 1981
Ghat 25º 08′N 10º 09′E 692 62212 900 Synoptic 1979
Tazerbou 25º 48′N 21º 08′E 259 62259 700 Synoptic 1962
- 15 -
The maximum and minimum temperatures are measured at all stations once per day, in the early morning at 0600 GMT for minimum temperature and in the late afternoon at 1800 GMT for the maximum temperature. Soil temperatures at five agricultural stations are measuring at eight fixed times each day. Measurement of dry and wet bulb temperature and minimum and maximum temperature using specific types of thermometers and thermographs is undertaken at selected stations, with equipment sourced from either the UK or Denmark. At agricultural stations, soil temperatures are measured at multiple depths below the surface (5, 10, 20, 50, 100 and 150 cm; LNMC).
2.2.2.2 Precipitation
Precipitation is measured in mm/day at two fixed schedule times per day at all rain gauges and meteorological stations (synoptic, climatic and agricultural) across Libya; at 06:00 GMT and the second at 18:00 GMT; and at additional times during the day during heavy rainfall, particularly during the winter at coastal stations. Precipitation in Libya is measured by using three different types of graduated cylinder rain gauges from Italy, Germany, and the UK, with three different forms of graduated cylinders.
2.2.2.3 Wind speed and direction
Wind speed (m s-1) and direction observations are required for weather monitoring and forecasting. According to the WMO, wind speed should be measured regularly, with hourly measurements at the airports of Tripoli, Binina, Sirt and Sabha and eight times a day (00:00, 03:00, 06:00, 09:00, 12:00, 15:00, 18:00, 21:00) at other stations. A combined sensor (IM 146) is one of the most common instruments used in Libya, which consists of a direction vane cup anemometer.
2.2.2.4 Relative humidity
- 16 -
Air humidity measurements are made eight times a day (00:00, 03:00, 06:00, 09:00, 12:00, 15:00, 18:00, 21:00) at synoptic stations except, for Tripoli Airport and Binina were observations are made hourly.
2.2.2.5 Air pressure
Air pressure is one of the most important weather parameters observed at synoptic and climatic stations across Libya, using both aneroid and mercury barometers to observe sea level pressure (hPa). Air pressure are measured at synoptic stations on an hourly basis at the airport stations of Tripoli, Sirt, Binina and Sabha and at eight times a day (00:00, 03:00, 06:00, 09:00, 12:00, 15:00, 18:00, 21:00) at other stations. The mean monthly air pressure of sea level (stations level) across Libya ranges from approximately 980 to 1016 hPa (from 964 to 1035 hPa).
2.2.2.6 Sun-shine duration
Sun-shine duration is one of the most important weather parameters observed at meteorological stations: synoptic, agricultural and climatic stations across Libya, daily at 18:00 GTM. Bright sun-shine duration data is measured by the Campbell Stokes recorder in Libya. The mean total daily sun-shine duration across Libya varied spatial and through the year, with an average rate ranging between 4-10 hours (coastal stations) to 8-13 hours (inland regions).
2.3 CLIMATIC VARIABILITY
Temperature, precipitation and evapotranspiration are the main climatic parameters covered within this thesis and are investigated to examine the climate and changes in climate.
2.3.1 Temperature variation
- 17 -
regional and locally, with evidence of increasing/decreasing temperatures, cold/warm phases, identified throughout the last 150 years.
In the last few decades, Kostopoulou et al. (2013) identified increases in annual minimum temperature of 0.4-0.5 °C over the Mediterranean region. This finding is comparable to Ben-Gai et al. (1999) in Israeli with 0.01-0.53 ° C/decade, but indicate a faster rate of warming compared to previous studies examining Libya (El-Kenawy et al., 2009). Previous research e.g. El-Tantawi (2005) identified increases in maximum, minimum and mean average temperature ranged across Libya (1946-2000). The findings are supported by Ben-Gai et al. (1999) in Israel trends with an average rate of 0.21 °C/decade. Several heat waves have occurred in regions of the Mediterranean, western and Central Europe (2003, 2006 and 2007; Dousset et al., 2011). To document and assess temperature variability and changes at smaller scales (i.e. regional), to better understanding long-term temperature variability and change, and its associated mechanisms of forcing, at regional scales is required.
2.3.1.1 Global variation of temperature
A large number of previous studies have described global changes and trends in temperature (e.g. Mitchell, 1966; Folland et al., 1990; Hansen, 2001 and 2002; Jones and Kelly, 1983; Jones et al., 1982 and1999; Alexander et al., 2006; Brown et al., 2008). Several studies have described changes and trends in temperature through from the global to the local scale in the north hemisphere (Jones and Kelly, 1983; Repapis, 1984), in African, (Hulme et al., 2001) for Europe (Klein Tank and Konnen, 2003; Kington, 1988, Kelly et al., 1982) and over the Arctic regions (Przybylak, 2000).
- 18 -
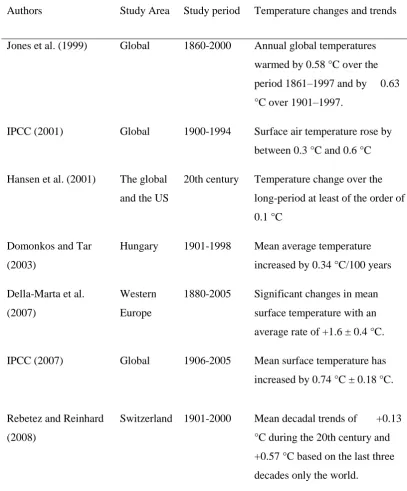
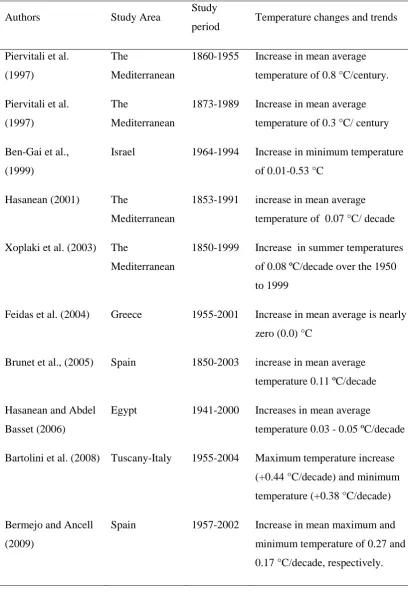
[image:48.595.112.520.152.644.2]globally with some areas warming at greater rates than others; while other regions have even cooled or show no evidence of change (Table 2.2).
Table 2.2: Rates of changes in temperature identified by previous studies
Authors Study Area Study period Temperature changes and trends
Jones et al. (1999) Global 1860-2000 Annual global temperatures warmed by 0.58 °C over the period 1861–1997 and by 0.63 °C over 1901–1997.
IPCC (2001) Global 1900-1994 Surface air temperature rose by between 0.3 °C and 0.6 °C Hansen et al. (2001) The global
and the US
20th century Temperature change over the long-period at least of the order of 0.1 °C
Domonkos and Tar (2003)
Hungary 1901-1998 Mean average temperature increased by 0.34 °C/100 years Della-Marta et al.
(2007)
Western Europe
1880-2005 Significant changes in mean surface temperature with an average rate of +1.6 ± 0.4 °C. IPCC (2007) Global 1906-2005 Mean surface temperature has
increased by 0.74 °C ± 0.18 °C.
Rebetez and Reinhard (2008)
Switzerland 1901-2000 Mean decadal trends of +0.13 °C during the 20th century and +0.57 °C based on the last three decades only the world.
- 19 -
al., 2008; Politano, 2008; Wang et al., 2012; Zhou1 and Ren, 2011; Kruger and Sekele, 2013). Monthly mean maximum and minimum temperature indicate that minimum temperature increasing with three times that of the global maximum temperature, with rate average of 0.84 °C versus 0.28 °C for the period 1951-1990 (Karl et al., 1993), this finding supported by Jones et al., (1999), who identified that global minimum temperatures have warmed by 0.188 °C per decade and maximum temperatures have warmed by 0.088 °C per decade during the period 1950-1993, and be with Folland et al., 2002 who identified considerable variability in temperature range, as minimum temperatures have risen twice as fast as maximum temperature over the Northern Hemisphere, with the rate of temperature increase (1950-1993) has been 0.2 °C and 0.1 °C for the minimum and maximum, respectively. The study by Alexander et al. (2006) analysed globally extremes temperature of 200 stations for the period 1901-2003, they have identified that all indices exhibit a significant change between 1951-1958 and 1979-2003 at all stations, with general warming in all seasons. The study by Della-Marta et al., (2007) analysed daily summer maximum temperature at 54 stations selected from 15 Western Europe countries during the last 126 years (1880-2005), they identified that the length of summer heat waves has doubled and the frequency of hot days has almost tripled. Bermejo and Ancell (2009) investigated variability of daily extreme temperatures across Spain during the period 1957-2002; they showed that maximum temperatures have increase at faster rate than minimum temperatures.
2.3.1.2 Regional variations of temperature
- 20 -
Camuffo et al., 2013) and for stations distributed around the Mediterranean (Arseni-Papadimitriou & Maheras, 1991; Goubanova and Li, 2007).
A number of studies have identified trends in temperature across the Mediterranean basin and North Africa (Table 2.2) over the last 30 years (e.g. a study by Juan and Antonio (1996), Aesawy and Hasanean (1998), Ben-Gai et al. (1999), Hasanean (2001), Turkes and Sumer (2004), Hasanean and Abdel Basset (2006), Brunet et al, 2007, Goubanova and Li, 2007, Chaouche et al., 2010).
During the last few decades, a large body of work has been undertaken assessing temperature variations and trends in single countries in the Mediterranean region: Egypt (Domroes and El-Tantawi, 2005, Hasanean and Abdel Basset, 2006), Israel (Goldreich, 1995, Ben-Gai et al., 1999, Kafle and Bruins 2009), Greece (Xoplaki et al., 2002, Feides et al., 2004, Philandras et al., 2008), Turkey (Tayanc et al., 1997, Kahya and Kalayc, 2004, Tayanc et al., 2009), Spain (Onate and Pou, 1996; Brunet et al., 2007, Bermejo and Ancell, 2009, Pablo Campra et al., 2008, El-Kenawy et al., 2012) and Italy (Brunetti et al., 2004, Toreti and Desiato, 2008). Whilst other studies have focused on regional temperature variations and trends at single cities/regions around the Mediterranean basin during the last 40 years: Athens (Arseni-Papadimitriou, 1973, Repapis, 1984, Katsoulis, 1987, Founda et al., 2004), Tuscany (Colacino and Rovelli 1983), Rome (Bartolini et al., 2008), Modena (Boccolari and Malmusi, 2013) and Istanbul (Karaburun et al., 2011).
- 21 -
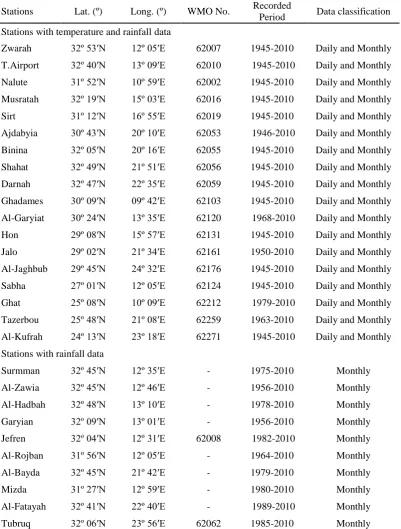
Table 2.3: Rates of change in temperature identified by previous studies
Authors Study Area Study
period Temperature changes and trends Piervitali et al.
(1997)
The
Mediterranean
1860-1955 Increase in mean average temperature of 0.8 °C/century. Piervitali et al.
(1997)
The
Mediterranean
1873-1989 Increase in mean average temperature of 0.3 °C/ century Ben-Gai et al.,
(1999)
Israel 1964-1994 Increase in minimum temperature of 0.01-0.53 °C
Hasanean (2001) The
Mediterranean
1853-1991 increase in mean average temperature of 0.07 °C/ decade Xoplaki et al. (2003) The
Mediterranean
1850-1999 Increase in summer temperatures of 0.08 ºC/decade over the 1950 to 1999
Feidas et al. (2004) Greece 1955-2001 Increase in mean average is nearly zero (0.0) °C
Brunet et al., (2005) Spain 1850-2003 increase in mean average temperature 0.11 ºC/decade Hasanean and Abdel
Basset (2006)
Egypt 1941-2000 Increases in mean average temperature 0.03 - 0.05 ºC/decade Bartolini et al. (2008) Tuscany-Italy 1955-2004 Maximum temperature increase
(+0.44 °C/decade) and minimum temperature (+0.38 °C/decade) Bermejo and Ancell
(2009)