R E S E A R C H A R T I C L E
Open Access
How should social mixing be measured: comparing
web-based survey and sensor-based methods
Timo Smieszek
1,3*†, Victoria C Barclay
1†, Indulaxmi Seeni
1, Jeanette J Rainey
2, Hongjiang Gao
2, Amra Uzicanin
2and Marcel Salathé
1Abstract
Background:Contact surveys and diaries have conventionally been used to measure contact networks in different settings for elucidating infectious disease transmission dynamics of respiratory infections. More recently, technological advances have permitted the use of wireless sensor devices, which can be worn by individuals interacting in a particular social context to record high resolution mixing patterns. To date, a direct comparison of these two different methods for collecting contact data has not been performed.
Methods:We studied the contact network at a United States high school in the spring of 2012. All school members (i.e., students, teachers, and other staff) were invited to wear wireless sensor devices for a single school day, and asked to remember and report the name and duration of all of their close proximity conversational contacts for that day in an online contact survey. We compared the two methods in terms of the resulting network densities, nodal degrees, and degree distributions. We also assessed the correspondence between the methods at the dyadic and individual levels. Results:We found limited congruence in recorded contact data between the online contact survey and wireless sensors. In particular, there was only negligible correlation between the two methods for nodal degree, and the degree distribution differed substantially between both methods. We found that survey underreporting was a significant source of the difference between the two methods, and that this difference could be improved by excluding individuals who reported only a few contact partners. Additionally, survey reporting was more accurate for contacts of longer duration, and very inaccurate for contacts of shorter duration. Finally, female participants tended to report more accurately than male participants.
Conclusions:Online contact surveys and wireless sensor devices collected incongruent network data from an identical setting. This finding suggests that these two methods cannot be used interchangeably for informing models of infectious disease dynamics.
Keywords:Contact networks, Social network, Proximity network, Droplet transmission, Contact survey, Wireless sensor network
Background
Contact network data are useful for parameterizing models that aim to understand and predict infectious disease dynamics. For example, the dynamics of sexually trans-mitted diseases [1-5] and droplet transtrans-mitted diseases [6-10] in humans, in addition to various infectious diseases
of livestock and wild animals [11-15], are all better under-stood because of monitoring and modeling the interaction between the respective hosts.
Various network statistics can be computed to investigate how disease might spread across networks, some of which correlate very well with the behavior of host-pathogen systems. For instance, individuals who have many different contact partners (also known as degree) per period of time are more likely to become infected, to infect others, and to become infected earlier during an epidemic than individ-uals with fewer contact partners [5,16,17]. Moreover, even pathogens with low infectiousness can cause epidemics in * Correspondence:[email protected]
†Equal contributors
1
Center for Infectious Disease Dynamics, Department of Biology, The Pennsylvania State University, University Park, PA 16802, USA 3
Current address: Modelling and Economics Unit, Public Health England, London NW9 5EQ, UK
Full list of author information is available at the end of the article
networks with a highly disperse degree distribution, as opposed to - otherwise similar - networks with a narrow degree distribution [18]. In highly clustered contact net-works, the local depletion of hosts results in decreased disease spread [19,20], and disease incidence growth is polynomial rather than exponential, as observed in unclustered networks [21]. Finally, in networks with a very strong community structure (i.e., networks that can be easily separated into densely connected groups), indi-viduals that connect different communities play a more important role for infectious disease spread than highly connected individuals within communities [22].
Several methods have been employed for measuring epidemiologically relevant contact data of host popula-tions, including direct observapopula-tions, videotaping, contact diaries and surveys, as well as wireless sensor network technologies [23]. In this paper, we focus on contact surveys and wireless sensor networks, both of which capture contacts that are sufficient for droplet transmis-sion. Contact surveys for droplet transmitted infections were first introduced in 1997 [24], and have become a popular method for measuring the structure of potentially contagious contacts [25-30]. In contact surveys or contact diaries, study participants attempt to recall all contacts which meet a given definition and record these contacts on a paper or web-based survey form. More recently, wireless sensor networks have become available as a method for measuring contact networks [8,31-35]. Currently, these sensors all use similar technologies, are small, and can be easily worn by persons of all ages. The devices emit electromagnetic signals, which are detected and recorded by other sensors within a predefined distance.
The merits and drawbacks of various methods of contact network data collection, including surveys and sensors, have recently been reviewed [23]. Furthermore, several methodological contributions have assessed the features of the survey method. For example, one study compared retrospective and prospective survey designs [28], another study compared a web-based mode of data collection with a paper-based one [36], and a third study compared paper-based diaries with data collection on personal digital assistants (PDAs) [37]. Additionally, a recent study assessed reporting errors and biases in contact survey studies [38].
While both contact surveys and wireless sensor networks have their own particular strengths and weaknesses, a direct empirical comparison to understand whether these frequently applied methods can be used interchangeably has not yet been done. Here, we present the first study to our knowledge that compares contact surveys and wireless sensor networks as methods for collecting contact network data during a single school day at a United States (US) high school.
Methods
Ethics statement
This study was part of a bigger project [39]. The Pennsylvania State University Institutional Review Board (IRB) approved this project (IRB #37640), and the project was also ap-proved under the US Centers for Disease Control and Prevention (CDC) IRB authorization agreement.
The project consisted of two parts, (1) a survey and wireless sensor network part (here) as well as (2) a disease surveillance part (including swabbing; data not used in this paper). Informed consent was obtained from all partici-pants for the survey and wireless sensor network part, and all personal identifying information was removed after contact partner reports were matched with sensor IDs. Additionally, parental consent was obtained for the disease surveillance part for all participants younger than 18.
Data collection
Setting
The contact network study was carried out at a US high school in the spring of 2012. When the data were collected, the entire school population was 974, which included 715 students as well as 259 teachers and other staff. The school was a full-time school and school days had between four and seven periods of 50 or 75 minutes duration. The student population was split in two halves for lunch break, one half having an early, one having a late break. Further, there were time slots assigned for school meetings, advisor meeting, and school clubs.
We did not offer individual incentives to participating students, teachers, or other staff. We did, however, involve the school community by offering scientific projects related to the study, in which students could participate and gain new skills.
Wireless sensor network
Wearable wireless sensor devices, herein referred to as motes, store close proximity records (CPR), which are a detection events between two motes. We used TelosB motes that were programmed to detect each other if the distance between them was two meters or less and only during face-to-face interactions (see Figure S4 in [8]). A distance cut-off of two meters was used in previous contact studies [30,38], and it corresponds well with theoretical work on droplet travel distances [40]. The mote beacon frequency was set to three per minute (i.e., every 20 seconds).
on a paper form their full names and provided an e-mail address if they wanted to complete a web-based contact survey. Because we were interested in directly comparing the contact data collected by the motes to self-reported contact survey data, we only used mote data retrieved from the third mote deployment day, Tuesday, March 13, 2012, which was the same day for which the study partici-pants were asked to report contacts in the web-based survey.
CPRs are concordant, if two motes record each other’s signal at the same time. Discordance means that only one mote recorded another mote’s signal, but not vice versa. Discordances were resolved by imputing missing CPRs.
Contact survey
Following close collaboration with school administrators to assess the appropriate timing, we distributed the web-based contact survey to participants by email on Wednesday, March 14, one day after the third mote deployment day. The school population was repeatedly informed when the contact survey would be sent by email and what day participants would be requested to remember their contact partners.
The online survey asked participants to recall and report all contacts that they had while at school the previous day, Tuesday, March 13. A contact in the survey was defined as a person with whom the participant had one or more interactions that (i) were a maximum of two arms-lengths apart, (ii) more than a 10-word conversation, and (iii) occurred only while at school. The distance cut-off of two arms-lengths was chosen as an easier-to-use proxy for the two meters cut-off that was defined for the wireless sensor network.
Contacts were entered in rows that consisted of two free text fields, where participants could enter the first and last name of their contact partners (or only one of the two if the other was unknown), and radio buttons to report the approximate aggregate contact duration (choice of 5 options: less than 5 minutes, 5 to 15 minutes, 15 to 60 minutes, 1 to 4 hours, longer than 4 hours). Initially, there was one empty row for the first contact. Participants could generate an unlimited number of further rows by pressing a clearly visible button labeled “add another contact”. Reminder emails were sent four days later, before the survey closed on Sunday, March 18.
Linking survey and sensor data
As described above, survey participants were requested to report the names of all contact partners among the school population in the web-based contact survey. These names had to be matched with names associated with sensor ID numbers to make the two sources of data comparable. To do this, we developed a partly automated
computer program to match the survey contacts with a list that linked participant names to sensor IDs.
For every contact partner reported by a study participant in the survey, we assessed the similarity of the contact’s name to the names of all individuals who participated in the mote study. We calculated average similarity scores for the first and last names combined, as well as similarity scores for both first and last names separately. The simi-larity scores could take values between 0 (totally different) and 1 (perfect match) and were defined as (2×M)/T, where Tis the total number of elements in both text sequences andMis the number of matches [41]. Similarity scores
were calculated using the ratio() method of the
SequenceMatcher class of the difflib Library for Python 2.7.3 that is included in the Enthought Python Distribution 7.3-1 (32 bit).
A reported name was automatically replaced by the sensor ID if a perfect match between a mote study par-ticipant and a reported contact partner was found. The name was also automatically replaced by the sensor ID if all three of the following conditions were fulfilled: (i) either the first or the last name was a perfect match; (ii) the other part (i.e., either first or last) of the name had to have a similarity score of at least 0.9; (iii) there was only one match with a maximal similarity score and no additional names had the same score. If a matching problem could not be solved automatically, the names were manually reconciled by study staff, who were provided with the reported name and (i) the five mote study participants’ names with the highest average similarity score, (ii) the five names with the highest last name similarity scores, and (iii) the five names with the highest first name similarity scores. Study staff could then decide if one of the provided names matched the reported name, if the reported name was clearly a person who did not participate in the mote study (recode value was 999 instead of an ID), or if the matching problem could not be solved unambiguously (recode value 888 instead of an ID). To ensure that all personal identifying information was removed from the contact data, each individual was given a new randomly allocated ID number.
Analyses
Nodal degree comparisons
between survey- and mote-based degree, we calculated the Kendall’s Tau rank correlation coefficient and estimated the corresponding 2-sided p-value. Finally, we visualized degree distributions for both survey- and mote-based contact data with kernel density plots. All plots were rendered using ggplot2 (version 0.9.3) that we linked into our main code (written in Python) with rpy2 (version 2.3.1, R version 2.15.2).
Average reporting probabilities
Having both contact survey and mote data collected from exactly the same setting, we analyzed whether differences in the two methods were a result of (i) underreporting of survey participants, or (ii) differences in the contact defini-tions underlying the two methods.
We used a previously developed method [38] to estimate reporting probabilities from the web-based contact survey. Briefly, the method is based on the premises that each contact should ideally be reported by two individuals, and that concordant and discordant contact reports can be used to estimate reporting probabilities.
There are three possible combinations of reports: (i) both participants reported contact with each other (the number of such reports is labeled Nss1), (ii) contact was reported by only one of the two involved participants (Nss2þ3), and (iii) neither of the two involved participants reported the contact (Nss4, which is unknown).
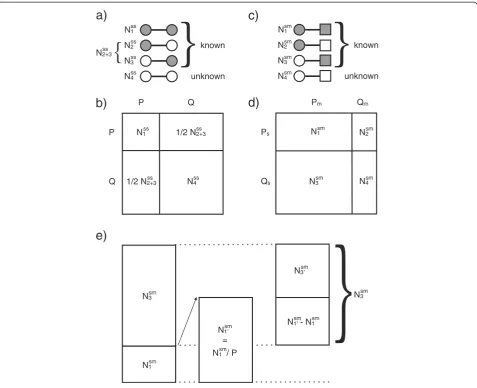
The average probability estimate that a contact of a spe-cific durationtis reported by a member of the population is then given by the equationP ¼ Nss1= Nss1 þ 12 Nss2þ3. The complementary probability,Q, of not reporting a con-tact of durationtisQ= 1 -P. Figures 1a and b provide an il-lustration of how we calculated survey reporting probabilities. Probabilities were calculated for four types of contact durations: (a) 5 minutes or less; (b) 5 to 15 mi-nutes; (c) 15 to 60 mimi-nutes; (d) 1 to 4 hours. Thereby, we assumed the higher contact duration value of every pair of contact reports to be true. Very few contacts lasted more than 4 hours; therefore, these contacts were ex-cluded from the analysis.
We expanded on the method described above [38] by cal-culating differences between contact survey reporting and mote recordings. The probability that a contact is reported in the survey study,Ps, conditional on being detected by the
motes, Pm, is defined as Ps ¼ N1sm= Nsm1 þ Nsm3
. Survey reporting is expected to be incomplete and, hence, Ps< 1 andQs> 0, whereQsis the probability of a contact
detected by a mote but not reported in the survey. Fig-ures 1c and d provide an illustration of the methods we used to calculate the probability that a mote detec-tion is reported as a contact in the survey. Differences in reporting between the surveys and motes were calculated independently for each of the four contact duration
categories described above. Thereby, we assumed the con-tact duration measured by the wireless sensor network to be true.
The non-reporting of contacts that were detected by the motes, represented by Nsm3 , can have two causes: (i) underreporting by study participants (probability Q), or (ii) differences in the contact definitions underlying both the mote and the survey study. Regarding the latter: motes measure all face-to-face collocation events with a maximal distance of two meters between any two study participants, while the survey’s contact definition only includes conversational contact. Hence, even with perfect reporting, we would expect legitimately fewer survey contact reports than mote detections. Figure 1e illustrates the relationship between differences in both contact datasets (i) due to underreporting (Nsm10 − Nsm1 ), (ii) due to differences in contact definitions (Nsm30 ), and relative to
the total difference between both datasets (Nsm3 ).
The proportion of the difference between mote measure-ments and survey data that is caused by underreporting is given by Nsm10 − Nsm1 =Nsm3 ; the proportion of the
difference that is caused by differing contact definitions is given byNsm30 =Nsm3 ¼ 1− Nsm10 − Nsm1
=Nsm
3
.
Individual differences in reporting quality
Individual differences in reporting probabilities cannot be estimated using only survey contact data (see supple-mentary material in [38]); however, our data allow us to calculate differences in individual reporting probabilities between contact survey data and the mote data, as we assumed that all motes record data with the same accuracy. To assess individual reporting differences, we determined individual Psvalues for each participant and also for each of the four time duration categories. Individual differences in reporting quality could then be specifically attributed to differences at the individual level.
We assessed individual differences in reporting quality for all participants together, but also for groups defined by gender and by age. Differences between the mean individual reporting probabilities of these groups were tested for significance using a permutation test [42] with 99999 permutation resamples.
Results
Descriptive statistics
178 participants (18.3%) for whom we had demographic information, at least one matchable contact report, and mote data. Of those, for whom we had all information, 109 (61.2%) were female and 69 (38.8%) were male. Fur-thermore, 138 (77.5%) were students and 40 (22.5%) were teachers or other staff.
Of the 1935 contact reports (i.e., directed ties) in the web-based survey, 253 (13.1%) were reported to have
lasted less than 5 minutes, 507 (26.2%) were from 5 to 15 minutes, 986 (51.0%) were from 15 to 60 minutes, 179 (9.3%) were from 1 to 4 hours, and 10 (0.5%) were reported to have lasted more than 4 hours. Of these 1935 contact reports, 1475 (76.2%) could be clearly linked to mote study participants, 32 (1.7%) were not clearly identifiable and were given the ID value 888, and 428 (22.1%) referred to members of the school population who
}
}
knownunknown N1
N2
N3
N4
{
N2+3N1 1/2 N2+3
1/2 N2+3 N4
P Q
P
Q
known
unknown N1
N2
N3
N4
N1
N4
Pm Qm
Ps
Qs
N2
N3
a)
c)
e)
ss ss
ss ss
sm
sm sm
sm ss
ss ss ss
ss
sm sm sm sm
N1sm N3sm
Nsm
}
N3sm
N - N1sm sm Nsm
N1 / Psm =
[image:5.595.60.538.88.476.2]b)
d)
Figure 1Models of contact reporting probabilities. (a)Contact reporting probabilities based on pairs of survey reports (ss), where a circle stands for a contact reported (grey) or not reported (white) by a survey participant. There are four possible combinations: (i)Nss
1where both contact partners report the contact, (ii)Nss
2 and (iii)Nss3 where only one of the contact partners report the contact (sinceNss2 andNss3are indistinguishable, we use their sumNss2þ3), and (iv)Nss4 where none of the two contact partners report the contact.(b)All possible combinations of survey reporting statuses, whereP stands for the probability of reporting a contact andQis the complement.(c)Survey reports and mote detections of contacts combined (sm), where a rectangle stands for a contact detected (grey) or not detected (white) by a pair of motes. There are four possible combinations: (i)Nsm
1 where a contact pair is reported in the survey and recorded by motes, (ii)Nsm
2 and (iii)Nsm3 where only the survey or motes recorded the contact, and (iv)Nsm4 where a contact that actually took place was neither reported nor detected by a mote.(d)PsandPmstand for average survey and mote reporting
probabilities, andQsandQmare the average probability of a survey or mote not recording a contact respectively.(e)The estimated
proportion of the difference between survey and mote data that can be attributed to survey underreporting, based on the models (b) and (d). Here,Nsm
10 is the estimated amount of contacts detected by the motes and also reported by the study participants if there was no underreporting
(estimate is based onP),Nsm
did not participate in the study. Three of the 32 not clearly identifiable names were from contacts with a duration of less than 5 minutes, 7 were from contacts with a duration between 5 and 15 minutes, 19 were from contacts with a duration between 15 and 60 minutes, and 3 were from contacts with a duration between 1 and 4 hours.
Most survey participants - 154 or 60.2% - submitted contact reports on the first day of data collection (March 14), and the degree distribution had a mean of 8.0. On the second day of data collection, 31 (12.1%) participants submitted contact reports; the mean degree was 10.4. On the third day, 61 (23.8%) participants submitted contact reports; the mean degree was 5.3. Ten additional par-ticipants submitted reports on the following days with a mean degree of 3.8. The degree distributions for the different report submission days are shown in Figure 2.
The motes detected a total of 13972 unique contacts. The vast majority of these contacts (11698 contacts or 83.7%) had an accumulated duration of less than 5 minutes; 1334 (9.5%) lasted 5 to 15 minutes, 899 (6.4%) 15 to 60 minutes, 38 (0.3%) 1 to 4 hours, and 3 (< 0.1%) longer than 4 hours.
Nodal degree comparisons
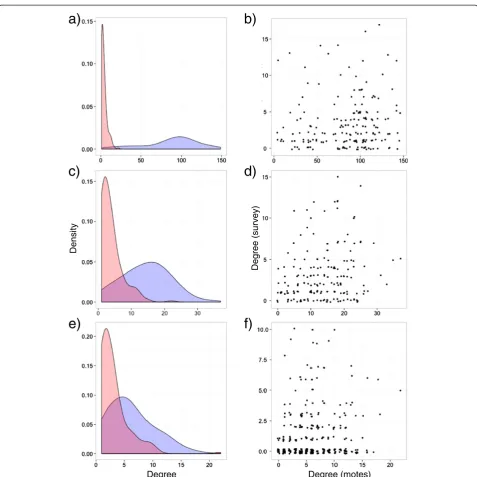
The scale of the mote-based nodal degree distribution was approximately one order of magnitude higher than the scale of the survey-based nodal degree distribution when all contact durations were included in the analysis (Figure 3a). The scale of the mote-based degree distribution moved closer to the scale of the survey-based distribution when contacts with short durations were successively excluded from the analysis (Figures 3c and e). Further, there was no statistically significant correlation (at an alpha level of 0.05) between nodal degrees measured by the motes compared to nodal degrees measured by the web-based contact survey when all contacts were included (Figure 3b;τ= 0.097, p = 0.067), whereas we could detect significant, but rather weak correlation (i) when contacts shorter than 5 minutes were excluded (Figure 3d;τ= 0.142, p = 0.008), and (ii) when contacts shorter than 15 minutes were excluded (Figure 3f;τ= 0.206, p = 0.000).
Average survey reporting probabilities
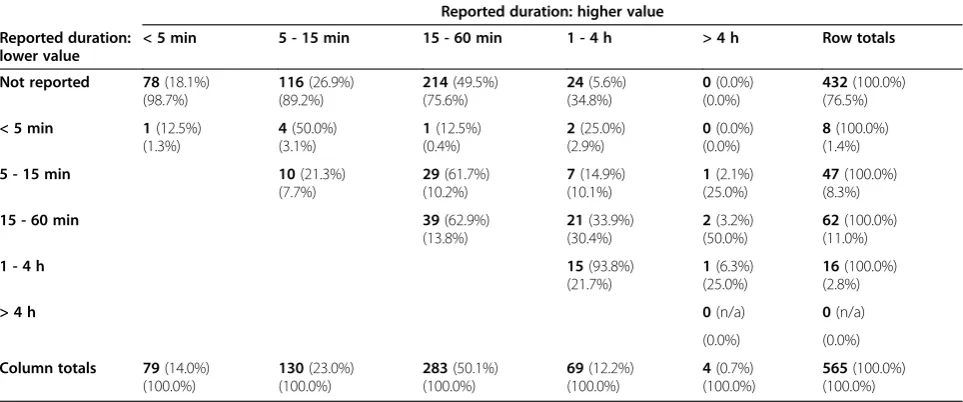
In total, 133 (23.5%) web-based survey contacts had concordant reports (i.e., the contact was reported by both participants) and 432 (76.5%) contacts were reported by only one study participant, but not by the other. Furthermore, 536 (3.5%; see Table 1: 15523 contacts in total – 14893 mote-recorded, but not reported – 94 reported, but not mote-recorded) survey contact reports corresponded to a mote-recorded contact and 14893 (96.5%) mote-recorded contacts were not reported by the respective participant. Table 2 shows a cross-tabulation for concordant and discordant records only from the survey
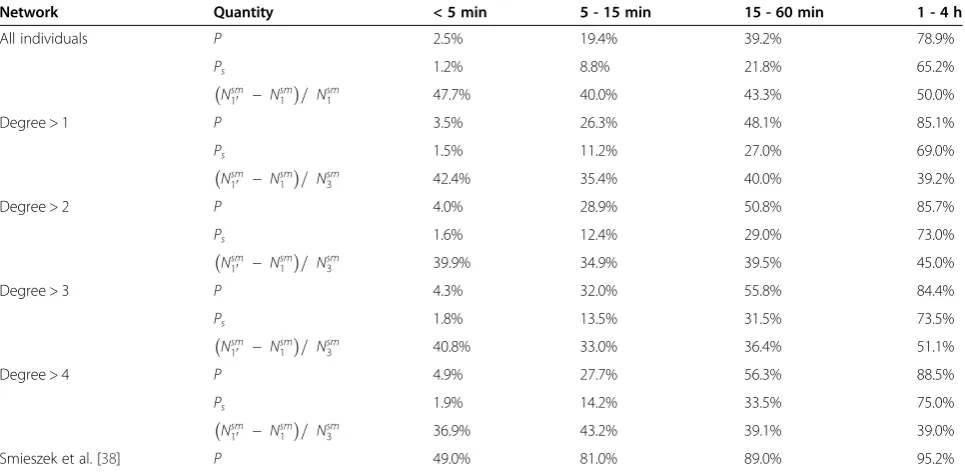
data. Table 1 shows the distribution of all concordant and discordant records of survey and mote data across the five contact duration categories. Reporting probabilities,P, reporting probabilities conditional on mote detection, Ps, and proportion of differences in mote and survey data
due to underreporting, Nsm10 − Nsm1 = Nsm3 , are shown
for different contact durations and different networks in Table 3.
The main results are that (i) the reporting probability is considerably higher for contacts with a long duration than for contacts with a short duration, and that (ii) underreporting accounts for approximately one third to half of the difference between sensor-based and survey-based contact data.
Individual differences in reporting quality
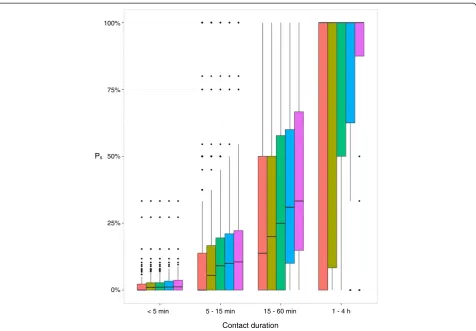
Differences between mote and survey data at the individ-ual participant level are illustrated in Figure 4. Consistent with average reporting probabilities, individual reporting probabilities increased with increasing contact duration. Excluding individuals with very few contact reports (i.e., degree lower than 2, 3, 4, or 5) amplified the overall reporting quality considerably. The probability to report a contact of≤5 minutes duration that was detected by a pair of motes was very small: the median reporting probability for all participants was zero and even the 3rd quartile was close to zero. Only two participants achieved
1 2 3 4 5 6
Day of data submission
0 10 20 30 40 50
[image:6.595.305.539.87.338.2]Degree
reporting probabilities of more than 25% for the less than 5 minute contact duration category. In contrast, the median reporting probability for the contacts that lasted longer than one hour was 100%.
When the study population was divided into a female and a male group, clear differences in the individual reporting probabilities between these groups appeared: While the mean reporting probability of females was 2.2% in the less than 5 minute contact duration category, we
estimated only 1.1% for the male participants (p = 0.020, one sided test). In the category of 5 to 15 minutes, we estimated the mean reporting probability of female partici-pants to be 12.4% and that of males 6.9% (p = 0.026). For 15 to 60 minutes, we estimated 30.9% for females and 18.7% for males (p = 0.006), and for 1 to 4 hours, we esti-mated 76.4% for females and 46.4% for males (p = 0.036).
Splitting the study population into different age groups did not result in a clear pattern.
a)
b)
c)
d)
e)
f)
Degree Degree (motes)
Degree (survey)
[image:7.595.59.537.85.563.2]Density
Discussion
Self-reported contact surveys and contact diaries have frequently been used for measuring contact networks relevant for the spread of infectious diseases [25-30]. More recently, technological advances have permitted the use of motes to record high resolution contact data [8,31-34]. For the first time, we compare these two methods for measur-ing contact networks in an identical settmeasur-ing. Overall, we found little congruence in recorded contact data between the two methods.
Interpretation of the results
[image:8.595.56.539.103.322.2]A comparison of the nodal degrees from both methods revealed no statistically significant correlation for all con-tacts and only weak correlation for concon-tacts of higher duration (Figure 3b, d, f ). Furthermore, the empirical degree distribution differed substantially between the two methods (Figure 3a, c, e). Since many studies rely on the nodal degree to fit models of infectious disease spread [7,10,25,43], this finding indicates that survey- and mote-derived degree data cannot be used interchangeably
Table 1 Cross-tabulation of contact data from motes and surveys
Mote measurements
Survey reports Not detected < 5 min 5 - 15 min 15 - 60 min 1 - 4 h > 4 h Row Totals
Not reported unknown(n/a) 12764(85.7%) 1309(8.8%) 802(5.4%) 16(0.1%) 2(0.0%) 14893(100.0%)
(n/a) (98.8%) (91.2%) (78.2%) (34.8%) (100.0%) (95.9%)
< 5 min 22(27.5%) 37(46.3%) 10(12.5%) 11(13.8%) 0(0.0%) 0(0.0%) 80(100.0%)
(23.4%) (0.3%) (0.7%) (1.1%) (0.0%) (0.0%) (0.5%)
5 - 15 min 31(19.6%) 49(31.0%) 36(22.8%) 38(24.1%) 4(2.5%) 0(0.0%) 158(100.0%)
(33.0%) (0.4%) (2.5%) (3.7%) (8.7%) (0.0%) (1.0%)
15 - 60 min 35(10.7%) 64(19.6%) 66(20.2%) 140(42.9%) 21(6.4%) 0(0.0%) 326(100.0%)
(37.2%) (0.5%) (4.6%) (13.6%) (45.7%) (0.0%) (2.1%)
1 - 4 h 6(9.4%) 6(9.4%) 13(20.3%) 34(53.1%) 5(7.8%) 0(0.0%) 64(100.0%)
(6.4%) (0.0%) (0.9%) (3.3%) (10.9%) (0.0%) (0.4%)
> 4 h 0(0.0%) 0(0.0%) 1(50.0%) 1(50.0%) 0(0.0%) 0(0.0%) 2(100.0%)
(0.0%) (0.0%) (0.1%) (0.1%) (0.0%) (0.0%) (0.0%)
Column Totals 94(0.6%) 12920(83.2%) 1435(9.2%) 1026(6.6%) 46(0.3%) 2(0.0%) 15523(100.0%)
(100.0%) (100.0%) (100.0%) (100.0%) (100.0%) (100.0%) (100.0%)
Columns give the number of contacts detected by motes by five duration categories and also the number of contacts that were not detected by the motes, but reported by a participant. Rows give the number of contacts reported by survey participants and also the number of contacts that were detected by the motes, but were not reported by the respective participant. Each percentage within a cell represents percentage of the row (right) and column totals (lower).
Table 2 Cross-tabulation of pairs of contact reports from the contact survey
Reported duration: higher value
Reported duration: lower value
< 5 min 5 - 15 min 15 - 60 min 1 - 4 h > 4 h Row totals
Not reported 78(18.1%)
(98.7%)
116(26.9%) (89.2%)
214(49.5%) (75.6%)
24(5.6%) (34.8%)
0(0.0%) (0.0%)
432(100.0%) (76.5%)
< 5 min 1(12.5%)
(1.3%)
4(50.0%) (3.1%)
1(12.5%) (0.4%)
2(25.0%) (2.9%)
0(0.0%) (0.0%)
8(100.0%) (1.4%)
5 - 15 min 10(21.3%)
(7.7%)
29(61.7%) (10.2%)
7(14.9%) (10.1%)
1(2.1%) (25.0%)
47(100.0%) (8.3%)
15 - 60 min 39(62.9%)
(13.8%)
21(33.9%) (30.4%)
2(3.2%) (50.0%)
62(100.0%) (11.0%)
1 - 4 h 15(93.8%)
(21.7%)
1(6.3%) (25.0%)
16(100.0%) (2.8%)
> 4 h 0(n/a) 0(n/a)
(0.0%) (0.0%)
Column totals 79(14.0%)
(100.0%)
130(23.0%) (100.0%)
283(50.1%) (100.0%)
69(12.2%) (100.0%)
4(0.7%) (100.0%)
565(100.0%) (100.0%)
Cell frequencies represent the reports by contact duration for pairs of participants. That is, participant A’s and participant B’s reports about their contact with each other
comprise a single observation in the table. Columns give the higher contact duration report, and rows show the lower report. If a contact was reported by only one
[image:8.595.57.539.507.708.2]to inform infectious disease models, and it raises ques-tions about the appropriateness of at least one of the two methods for collecting epidemiologically relevant contact data.
Consistent with previous contact survey research [38], we found that reporting probabilities increased with higher contact duration. In general, persons are typically more likely to recall and report contacts of longer duration than short interactions. Nevertheless, our web-based con-tact survey reporting probability estimates were consider-ably lower overall from both unfiltered and filtered network data, compared to earlier findings [38] (see Table 3).
Underreporting is a significant problem in reconstruct-ing contact networks from survey data [23,38,44,45]. Therefore, we were interested in calculating the extent to which survey underreporting contributed to observed differences between the survey and mote data sets. We first looked at the proportion of differences when all participants were included in the analysis across all of the predefined contact durations (Table 3). We found that the proportion of the differences between the two methods caused by underreporting ranged from 40.0% to 50.0%. Excluding participants who reported very few contacts decreased the observed differences between the two methods related to underreporting (33.0% to 51.1% for individuals with a degree larger than three). This finding reflects the effect of individual participant differences in reporting quality.
To analyze the reporting differences between the survey and the mote datasets at the individual level, we calculated the fraction of a participant’s mote-detected contacts that was also reported by the respective participant (Figure 4). Consistent with the average reporting probabilities, we found that individual reporting probabilities increased with increasing contact duration, and that excluding indi-viduals with very few contact reports improved the overall reporting quality considerably. We further found that fe-male participants tended to report contacts more accur-ately than male participants. These data show how differences in individual participant survey reporting qual-ity can contribute substantially to the difference between mote and survey data sets.
[image:9.595.57.540.101.337.2]The overall reporting quality differs vastly among studies. For example, Smieszek et al. [38] reported 65.1% of all contacts had concordant reports, and Read et al. [23,46] reported that 30.2% of the contacts had concord-ant reports, both of which are higher than the reporting quality observed in this study (23.5% concordant reports, see Table 2). There are some plausible factors that may explain these observed differences. In particular, the study population and setting could have had important effects on the likelihood of reporting a contact. For ex-ample, Read et al. [46] obtained contact data from the students and staff at the University of Warwick, and Smieszek et al. [38] obtained contact data from members of three research groups at ETH Zurich, whereas the
Table 3 Reporting probabilities and underreporting
Network Quantity < 5 min 5 - 15 min 15 - 60 min 1 - 4 h
All individuals P 2.5% 19.4% 39.2% 78.9%
Ps 1.2% 8.8% 21.8% 65.2%
Nsm10 − Nsm1 = Nsm1 47.7% 40.0% 43.3% 50.0%
Degree > 1 P 3.5% 26.3% 48.1% 85.1%
Ps 1.5% 11.2% 27.0% 69.0%
Nsm10 − Nsm1 = Nsm3 42.4% 35.4% 40.0% 39.2%
Degree > 2 P 4.0% 28.9% 50.8% 85.7%
Ps 1.6% 12.4% 29.0% 73.0%
Nsm 10 − Nsm1
= Nsm
3 39.9% 34.9% 39.5% 45.0%
Degree > 3 P 4.3% 32.0% 55.8% 84.4%
Ps 1.8% 13.5% 31.5% 73.5%
Nsm 10 − Nsm1
= Nsm
3 40.8% 33.0% 36.4% 51.1%
Degree > 4 P 4.9% 27.7% 56.3% 88.5%
Ps 1.9% 14.2% 33.5% 75.0%
Nsm 10 − Nsm1
= Nsm
3 36.9% 43.2% 39.1% 39.0%
Smieszek et al. [38] P 49.0% 81.0% 89.0% 95.2%
Reporting probabilities of (i) survey reporting,P, (ii) reporting probabilities conditional on mote detection,Ps, and (iii) proportion of differences in mote and survey
data due to underreporting, Nsm
10 − Nsm1
=Nsm
3. Percentages forP,Ps, and Nsm10 −Nsm1
=Nsm
3 were calculated for four predefined different contact duration
categories and for five different networks (all participating individuals included; only participating individuals with a degree of more than 1, 2, 3, or 4 included), all
data presented here were obtained from students, teachers, and other staff at a US high school. First, it is reasonable to assume that it is cognitively more de-manding to recall the many more and rather short con-tacts that are likely to occur at high school, than the fewer contacts likely to occur in a university research set-ting. Second, the motivation to contribute to a scientific study might be higher among members of a university than members of a high school.
Appropriateness of contact definitions
Survey underreporting is highlighted as a reason for the observed differences between the contact data collected by the surveys and motes in this study (Table 3). However, even if survey reporting was perfect (e.g., participants were more motivated to complete the survey, and/or tried harder to remember all contacts, even those of shorter duration) surveys and motes would be unlikely to record exactly the same contact data. The reason for this is that the definition of a contact differs between the two
methods: motes measured all face-to-face collocation events within a maximum distance of two meters, while the survey contact definition included only conversational contact that occurred at a maximum distance of two arm lengths. Thus, the contact definition underlying the mote measurements is more inclusive than the survey’s defin-ition, and, hence, we would always expect more contacts detected by motes than reported using contact surveys or diaries.
The extent to which different contact definitions are meaningful for infectious disease transmission depends on the specific pathogen’s modes of transmission. There are four modes of transmission for respiratory infections: (i) droplet transmission (produced from the respiratory tract and expelled by various processes such as talking, sneezing, or coughing, and are at least 60 μm in diameter [40]), (ii) aerosol transmission (aerosolized particles of a small diameter that stay suspended in the indoor air), (iii) trans-mission through direct, physical contact, or, (iv) indirectly, through fomites [23]. The role of each of these for, e.g., < 5 min 5 - 15 min 15 - 60 min 1 - 4 h
0% 25% 50% 75% 100%
[image:10.595.61.538.87.418.2]Contact duration Ps
Figure 4Individual reporting probabilities.Distributions ofPs(calculated for all individuals separately) rendered as box-and-whisker plots. Psvalues are provided separately for the four duration categories < 5 minutes, 5 to 15 minutes, 15 to 60 minutes, and 1 to 4 hours. The red
influenza transmission is currently unclear [47-54]. For the purpose of this study, we were interested in droplet transmission, since there is evidence that close contacts are an important factor in the droplet transmission of many respiratory infections [55,56].
Droplet transmission, however, depends on various parameters such as droplet size and shape, the velocity with which the droplets are expelled, the viscosity of the droplets, as well as the temperature and humidity of the ambient air [40,57,58]. While droplets generated by breathing travel less than one meter, coughing can expel droplets that can be carried more than two meters away, and droplets produced by sneezing can potentially travel more than six meters [40]. Contact studies that relied solely on surveys could fail to record infectious contacts (e.g., via coughing and sneezing) if participants were further than a typical conversation distance apart. On the other hand, motes can be programmed to record interactions up to a specific distance, allowing motes to record all close proximity events regardless of whether any of the involved participants talked, sneezed, coughed, or did any other activity resulting in elevated levels of ex-pelled droplets. Consequently, a contact study that relied solely on motes could result in an over-recording of events irrelevant for the spread of infectious respiratory disease.
Finally, transmission probability is a continuous function of the distance between the infectious and the susceptible individual, rather than a step function. Hence, imposing any specific cut-off will not result in an accurate repre-sentation of potentially contagious contacts. In essence, further empirical studies are necessary to test different contact definitions to assess which ones best explain the spread of infections in specific host-pathogen systems. These tests could include motes that are sensitive to changes in breathing, coughing and sneezing.
Limitations of the study
We report contact data collected from a single school day at one US high school, limiting the generalizability of our findings. Comparing the participation rate of this study with other, methodologically similar studies is difficult, because many of those other contact survey studies used different strategies to obtain study participants, such as convenience samples, cohorts or quota sampling, and often did not report the number of people that partici-pated, compared to the total number approached [e.g., 25,29,30,37,46]. A comparison with three other contact network studies at schools (which all differed in meth-odology) indicates that the participation rate in our study might have been lower than could be expected [27,59,60]. Reasons for lower participation might have included the overall burden of the entire study, which involved more components than reported in this paper [39], in addition to dynamics within the school (students
or staff unwilling to participate if other peers did not participate).
Since other contact survey studies have shown substan-tial differences in reporting quality [23], the poor reporting quality we observed in this study may not occur elsewhere, including other high school settings. In addition to the retrospective design of our survey, a minor part of the underreporting in the surveys might have been caused by the design of our web-based survey: participants had to press an“add another contact”button for every additional contact they wanted to report. While the web-based survey was found to be easy to use and convenient in informal pre-tests, it cannot be ruled out that this design prevented users to report all contacts. Nevertheless, our research revealed that contact survey and mote mea-surements of exactly the same setting can result in almost unrelated contact networks, which poses questions about the appropriateness of at least one of the two methods.
Additionally, the method we used to estimate under-reporting of contacts was based on four simplifying assumptions (for details see Smieszek et al. [38]): that (i) the probability of reporting a contact, P, depended solely on the contact duration; (ii) reports of a specific contact were stochastically independent; (iii) since the true duration of a contact was not known, the higher value was assumed to be true; (iv) incongruent contact reports were only due to under- and never due to over-reporting (i.e., we believe that the reporting participant was right). While these assumptions were certainly violated in some cases, they were essential to estimate underreporting given the data available from this study.
Finally, we were unable to match all partners reported in the web-based contact survey unambiguously to partici-pants in the mote study (see“Linking survey and sensor data” subsection). One reason for such non-matchable reports is that individuals attempted to report a contact that actually took place, but did not report contact partners’ names correctly. If reported names were too different from actual names, matching was not possible, despite referring to the same contact event. However, even if we assume that all non-matchable contact reports would refer to a contact that actually took place, the results would only change slightly: ThePs for the unfiltered data
would still be 1.2% for the < 5 minutes contacts, it would increase from 8.8% to 9.2% for the 5 to 15 minutes tacts, from 21.8% to 23.3% for the 15 to 60 minutes con-tacts, and from 65.2% to 67.3% for the 1 to 4 hour contacts.
Conclusions
groups. In the context of previous methodological studies, we have come to the following conclusions:
First, contact surveys are very flexible and can be de-signed to collect data in various settings. They are easy to design and do not require substantial technological skills on the part of the researcher. However, since reporting quality varies vastly between different settings and, likely, between different age groups, underreporting of short-duration contacts can be a very serious issue due to the potential relevancy for acute respiratory disease transmission. It is almost impossible to distinguish whether differences in individuals’reported contact patterns are true differences, or whether they are a result of differing in-dividual capabilities and levels of motivation. Furthermore, surveys are unlikely to be very useful in efforts to collect data on very young children or illiterate populations, who may not be able to complete contact surveys.
Second, validation on the level of individual transmission events is still lacking for both survey- and sensor-based approaches of data collection. While there have been attempts to validate empirical contact data on a population level [7,10,43], there is still no proof that such contact data could explain concrete transmission paths in a population. Validation on the level of individual transmission events is important for demonstrating that measured contacts are valid proxies for potentially contagious situations. Such validation could also assist in refining data collection methods for generating contact networks that best account for infectious disease transmission.
Third, while sensor-based approaches for measuring epidemiologically relevant contact networks are objective and substantially more reliable, new sensors need to be developed that overcome the disadvantages of the current generation of sensors. Ideally, new sensors will have the capability of distinguishing various close proximity events of different epidemiological importance (e.g., assessing whether the person is talking, coughing, sneezing, or none of these) and will be able to capture contact with partners who are not equipped with sensors.
Abbreviations
CPR:Close proximity record; ID: Identification number; PDA: Personal digital assistant.
Competing interests
The authors declare that they have no competing interests.
Authors’contributions
TS, VCB, and MS contributed to the conception and design of this study. VCB, IS, and MS collected the data. TS performed the data cleaning and the analyses. TS, VCB, JJR, HG, AU, and MS contributed to the interpretation of the data and analysis results. TS and VCB drafted the manuscript, and IS, JJR, HG, AU, and MS revised the manuscript draft. All authors read and approved the final manuscript.
Authors' information
Disclaimer: The opinions expressed by authors contributing to this article do not necessarily reflect the opinions of the Centers for Disease Control and Prevention or the institutions with which the authors are affiliated.
Acknowledgements
We thank members of the high school who made this project possible. This research was supported by the Centers for Disease Control and Prevention through grant U01 CK000178-01 (to MS), a fellowship from the German Academic Exchange Service DAAD through grant D/10/52328 (to TS), a Society in Science: Branco Weiss fellowship (to MS), and NIH RAPIDD support (to MS). We thank Devon Brewer for his elaborated comments that helped to improve the quality of this paper and Ellsworth Campbell for his valuable contribution to Figure 1. Finally, we thank the five reviewers for their insightful and knowledgeable suggestions.
Author details
1Center for Infectious Disease Dynamics, Department of Biology, The
Pennsylvania State University, University Park, PA 16802, USA.2Division of Global Migration and Quarantine, Centers for Disease Control and Prevention, 1600 Clifton Rd. MS-03, Atlanta, GA 30333, USA.3Current address: Modelling and Economics Unit, Public Health England, London NW9 5EQ, UK.
Received: 24 June 2013 Accepted: 19 February 2014 Published: 10 March 2014
References
1. Morris M, Kretzschmar M:Concurrent partnerships and the spread of HIV.
AIDS1997,11:641–648.
2. Adimora AA, Schoenbach VJ:Social context, sexual networks, and racial disparities in rates of sexually transmitted infections.J Infect Dis2005, 191:S115–S122.
3. Ghani AC, Swinton J, Garnett GP:The role of sexual partnership networks in the epidemiology of gonorrhea.Sex Transm Dis1997,24:45–56. 4. Eames KTD, Keeling MJ:Modeling dynamic and network heterogeneities
in the spread of sexually transmitted diseases.Proc Natl Acad Sci U S A 2002,99:13330–13335.
5. Liljeros F, Edling C, Amaral L:Sexual networks: implications for the transmission of sexually transmitted infections.Microbes Infect2003, 5:189–196.
6. Kucharski AJ, Gog JR:The role of social contacts and original antigenic sin in shaping the age pattern of immunity to seasonal influenza.
PLoS Comput Biol2012,8:e1002741.
7. Wallinga J, Teunis P, Kretzschmar M:Using data on social contacts to estimate age-specific transmission parameters for respiratory-spread infectious agents.Am J Epidemiol2006,164:936–944.
8. Salathé M, Kazandjieva M, Lee JW, Levis P, Feldman MW, Jones JH:A high-resolution human contact network for infectious disease transmission.
Proc Natl Acad Sci U S A2010,107:22020–22025.
9. Smieszek T, Balmer M, Hattendorf J, Axhausen KW, Zinsstag J, Scholz RW: Reconstructing the 2003/2004 H3N2 influenza epidemic in Switzerland with a spatially explicit, individual-based model.BMC Infect Dis2011, 11:115.
10. Goeyvaerts N, Hens N, Ogunjimi B, Aerts M, Shkedy Z, Damme PV, Beutels P: Estimating infectious disease parameters from data on social contacts and serological status.J Roy Statist Soc Ser C2010,59:255–277. 11. Fiebig L, Smieszek T, Saurina J, Hattendorf J, Zinsstag J:Contacts between
poultry farms, their spatial dimension and their relevance for avian influenza preparedness.Geospat Health2009,4:79–95.
12. Dent JE, Kao RR, Kiss IZ, Hyder K, Arnold M:Contact structures in the poultry industry in Great Britain: exploring transmission routes for a potential avian influenza virus epidemic.BMC Vet Res2008,4:27. 13. Hamede RK, Bashford J, McCallum H, Jones M:Contact networks in a wild
Tasmanian devil (Sarcophilus harrisii) population: using social network analysis to reveal seasonal variability in social behaviour and its implications for transmission of devil facial tumour disease.Ecol Lett2009,12:1147–1157. 14. Böhm M, Hutchings MR, White PCL:Contact networks in a wildlife-livestock
host community: identifying high-risk individuals in the transmission of bovine TB among badgers and cattle.PLoS ONE2009,4:e5016.
15. Volkova VV, Howey R, Savill NJ, Woolhouse MEJ:Sheep movement networks and the transmission of infectious diseases.PLoS ONE2010,5:e11185. 16. Smieszek T, Salathé M:A low-cost method to assess individual importance
in controlling infectious disease outbreaks.BMC Med2013,11:35. 17. Woolhouse MEJ, Shaw DJ, Matthews L, Liu W-C, Mellor DJ, Thomas MR:
18. Anderson R, May RM:Infectious Diseases of Humans.Oxford: Oxford University Press; 1991.
19. Smieszek T, Fiebig L, Scholz RW:Models of epidemics: when contact repetition and clustering should be included.Theor Biol Med Model2009,6:11. 20. Keeling MJ:The effects of local spatial structure on epidemiological
invasions.Proc Biol Sci1999,266:859–867.
21. Szendroi B, Csányi G:Polynomial epidemics and clustering in contact networks.Proc Biol Sci2004,271(Suppl 5):S364–6.
22. Salathé M, Jones JH:Dynamics and control of diseases in networks with community structure.PLoS Comput Biol2010,6:e1000736.
23. Read JM, Edmunds WJ, Riley S, Lessler J, Cummings DAT:Close encounters of the infectious kind: methods to measure social mixing behaviour.
Epidemiol Infect2012,140:2117–2130.
24. Edmunds WJ, O’Callaghan CJ, Nokes DJ:Who mixes with whom? A method to determine the contact patterns of adults that may lead to the spread of airborne infections.Proc Biol Sci1997,264:949–957. 25. Mossong J, Hens N, Jit M, Beutels P, Auranen K, Mikolajczyk R, Massari M,
Salmaso S, Tomba GS, Wallinga J, Heijne J, Sadkowska-Todys M, Rosinska M, Edmunds WJ:Social contacts and mixing patterns relevant to the spread of infectious diseases.PLoS Med2008,5:381–391.
26. Edmunds WJ, Kafatos G, Wallinga J, Mossong JR:Mixing patterns and the spread of close-contact infectious diseases.Emerg Themes Epidemiol2006,3:10. 27. Mikolajczyk RT, Akmatov MK, Rastin S, Kretzschmar M:Social contacts of
school children and the transmission of respiratory-spread pathogens.
Epidemiol Infect2008,136:813–822.
28. Mikolajczyk RT, Kretzschmar M:Collecting social contact data in the context of disease transmission: Prospective and retrospective study designs.Soc Networks2008,30:127–135.
29. Horby P, Pham QT, Hens N, Nguyen TTY, Le QM, Dang DT, Nguyen ML, Nguyen TH, Alexander N, Edmunds WJ, Tran ND, Fox A, Nguyen TH:Social contact patterns in Vietnam and implications for the control of infectious diseases.PLoS ONE2011,6:e16965.
30. Smieszek T:A mechanistic model of infection: why duration and intensity of contacts should be included in models of disease spread.Theor Biol Med Model2009,6:25.
31. Isella L, Romano M, Barrat A, Cattuto C, Colizza V, Van den Broeck W, Gesualdo F, Pandolfi E, Rava L, Rizzo C, Tozzi AE:Close Encounters in a Pediatric Ward: Measuring Face-to-Face Proximity and Mixing Patterns with Wearable Sensors.PLoS ONE2011,6:e17144.
32. Stehle J, Voirin N, Barrat A, Cattuto C, Colizza V, Isella L, Regis C, Pinton J-F, Khanafer N, Van den Broeck W, Vanhems P:Simulation of an SEIR infectious disease model on the dynamic contact network of conference attendees.
BMC Med2011,9:87.
33. Stehle J, Voirin N, Barrat A, Cattuto C, Isella L, Pinton J-F, Quaggiotto M, Van den Broeck W, Regis C, Lina B, Vanhems P:High-resolution measurements of face-to-face contact patterns in a primary school.PLoS ONE2011,6:e23176. 34. Cattuto C, Van den Broeck W, Barrat A, Colizza V, Pinton J-F, Vespignani A:
Dynamics of person-to-person interactions from distributed RFID sensor networks.PLoS ONE2010,5:e11596.
35. Eagle N, Pentland AS, Lazer D:Inferring friendship network structure by using mobile phone data.Proc Natl Acad Sci U S A2009,106:15274–15278. 36. Beutels P, Shkedy Z, Aerts M, van Damme P:Social mixing patterns for
transmission models of close contact infections: exploring self-evaluation and diary-based data collection through a web-based interface.
Epidemiol Infect2006,134:1158.
37. McCaw JM, Forbes K, Nathan PM:Comparison of three methods for ascertainment of contact information relevant to respiratory pathogen transmission in encounter networks.BMC Infect Dis2010,10:166. 38. Smieszek T, Burri EU, Scherzinger R, Scholz RW:Collecting close-contact
social mixing data with contact diaries: reporting errors and biases.
Epidemiol Infect2012,140:744–752.
39. Barclay VC, Smieszek T, He J, Cao G, Rainey JJ, Gao H, Uzicanin A, Salathé M: Positive network assortativity of influenza vaccination at a high school: implications for outbreak risk and herd immunity.PLoS ONE2014,9:e87042. 40. Xie X, Li Y, Chwang ATY, Ho PL, Seto WH:How far droplets can move in
indoor environments—revisiting the Wells evaporation-falling curve.
Indoor Air2007,17:211–225.
41. difflib—Helpers for computing deltas.http://docs.python.org/2/library/difflib.html. 42. Hesterberg T, Moore D, Monaghan S, Clipson A, Epstein R:Bootstrap methods
and permutation tests.InIntroduction to the Practice of Statistics.Edited by Moore D, McCabe G, Graig B. New York, NY: Freeman; 2012. 14.1–14.70.
43. Kretzschmar M, Teunis PFM, Pebody RG:Incidence and reproduction numbers of pertussis: estimates from serological and social contact data in five European countries.PLoS Med2010,7:e1000291.
44. Brewer DD, Webster CM:Forgetting of friends and its effects on measuring friendship networks.Soc Networks2000,21:361–373. 45. Brewer DD, Garrett SB, Kulasingam S:Forgetting as a cause of incomplete
reporting of sexual and drug injection partners.Sex Transm Dis1999, 26:166–176.
46. Read JM, Eames KTD, Edmunds WJ:Dynamic social networks and the implications for the spread of infectious disease.J R Soc Interface2008, 5:1001–1007.
47. Hanley BP, Borup B:Research Aerosol influenza transmission risk contours: a study of humid tropics versus winter temperate zone.Virology J2010,7:98. 48. Mubareka S, Lowen AC, Steel J, Coates AL, García-Sastre A, Palese P:
Transmission of influenza virus via aerosols and fomites in the guinea pig model.J Infect Dis2009,199:858–865.
49. Atkinson MP, Wein LM:Quantifying the routes of transmission for pandemic influenza.Bull Math Biol2008,70:820–867.
50. Weber TP, Stilianakis NI:Inactivation of influenza A viruses in the environment and modes of transmission: a critical review.J Infect2008,57:361–373. 51. Brankston G, Gitterman L, Hirji Z, Lemieux C, Gardam M:Transmission of
influenza A in human beings.Lancet Infect Dis2007,7:257–265. 52. Lemieux C, Brankston G, Gitterman L, Hirji Z, Gardam M:Questioning
aerosol transmission of influenza.Emerg Infect Dis2007,13:173–174. 53. Tellier R:Aerosol transmission of influenza A virus: a review of new
studies.J R Soc Interface2009,6:S783–S790.
54. Tellier R:Review of aerosol transmission of influenza A virus.Emerg Infect Dis2006,12:1657–1662.
55. Musher DM:How contagious are common respiratory tract infections?
New Engl J Med2003,349:95.
56. Rea E, Laflèche J, Stalker S, Guarda BK, Shapiro H, Johnson I, Bondy SJ, Upshur R, Russell ML, Eliasziw M:Duration and distance of exposure are important predictors of transmission among community contacts of Ontario SARS cases.Epidemiol Infect2007,135:914–921.
57. Morrow PE:Physics of airborne particles and their deposition in the lung.
Ann N Y Acad Sci1980,353:71–80.
58. Wells WF:Airborne Contagion and Air Hygiene. an Ecological Study of Droplet Infections.Cambridge, MA: Harvard University Press; 1955.
59. Conlan AJK, Eames KTD, Gage JA, von Kirchbach JC, Ross JV, Saenz RA, Gog JR:Measuring social networks in British primary schools through scientific engagement.Proc R Soc B2011,278:1467–1475.
60. Glass LM, Glass RJ:Social contact network for the spread of pandemic influenza in children and teenagers.BMC Public Health2008,8:61.
doi:10.1186/1471-2334-14-136
Cite this article as:Smieszeket al.:How should social mixing be measured: comparing web-based survey and sensor-based methods.BMC Infectious Diseases201414:136.
Submit your next manuscript to BioMed Central and take full advantage of:
• Convenient online submission
• Thorough peer review
• No space constraints or color figure charges
• Immediate publication on acceptance
• Inclusion in PubMed, CAS, Scopus and Google Scholar
• Research which is freely available for redistribution