This is a repository copy of Three-dimensional imaging of dislocation propagation during crystal growth and dissolution.
White Rose Research Online URL for this paper: http://eprints.whiterose.ac.uk/89353/
Version: Accepted Version
Article:
Clark, JN, Ihli, J, Schenk, AS et al. (6 more authors) (2015) Three-dimensional imaging of dislocation propagation during crystal growth and dissolution. Nature Materials, 14 (8). 780 - 784. ISSN 1476-1122
https://doi.org/10.1038/nmat4320
[email protected] https://eprints.whiterose.ac.uk/
Reuse
Unless indicated otherwise, fulltext items are protected by copyright with all rights reserved. The copyright exception in section 29 of the Copyright, Designs and Patents Act 1988 allows the making of a single copy solely for the purpose of non-commercial research or private study within the limits of fair dealing. The publisher or other rights-holder may allow further reproduction and re-use of this version - refer to the White Rose Research Online record for this item. Where records identify the publisher as the copyright holder, users can verify any specific terms of use on the publisher’s website.
Takedown
If you consider content in White Rose Research Online to be in breach of UK law, please notify us by
1
Three-dimensional imaging of dislocation propagation during crystal growth
and dissolution
Jesse N. Clark1;#;y, Johannes Ihli2;y, Anna S. Schenk2, Yi-Yeoun Kim2, Alexander N. Kulak2,
James M. Campbell3, Gareth Nisbet4, Fiona C. Meldrum2, & Ian K. Robinson1;5
1London Centre for Nanotechnology, University College, London WC1E 6BT, UK
2School of Chemistry, University of Leeds, Leeds LS2 9JT, UK.
3School of Physics and Astronomy, University of Leeds, Leeds, LS2 9JT, UK
4Diamond Light Source, Harwell Science and Innovation Campus, Didcot, Oxon OX11 0DE,
UK
5Research Complex at Harwell, Didcot, Oxfordshire OX11 0DE, UK
# Present address: Stanford PULSE Institute, SLAC National Accelerator Laboratory, 2575
Sand Hill Road, Menlo Park, California 94025, USA and Center for Free-Electron Laser
Science (CFEL), Deutsches Elektronensynchrotron (DESY), Notkestrasse 85, 22607 Hamburg,
Germany.
y These authors contributed equally to this work
Keywords: Calcite, Calcium Carbonate, Imaging, Coherent Diffraction, Screw Dislocation
Atomic-level defects such as dislocations play key roles in determining the macroscopic
properties of crystalline materials1,2. Their effects range from increased chemical
reactivity3,4 to enhanced mechanical properties5,6. Dislocations have been widely
studied using traditional techniques such as X-ray diffraction and optical imaging. Recent
advances have enabled atomic force microscopy to study single dislocations7 in two
dimensions, while transmission electron microscopy (TEM) can now visualize strain fields
in three dimensions with near-atomic resolution8 10. However, these techniques cannot
offer three-dimensional imaging of the formation or movement of dislocations during
2
11,12) can be used to visualize in three dimensions, the entire network of dislocations
present within an individual calcite crystal during repeated growth and dissolution cycles.
These investigations demonstrate the potential of BCDI for studying the mechanisms
underlying the response of crystalline materials to external stimuli.
Crystal growth and dissolution processes have been studied for over a century13, owing to
their significance to fields such as geology, corrosion, catalysis and the synthesis of
nanostructures, a desire to understand the link between microscopic and macroscopic
processes, and to our innate fascination with such structures. These investigations
confirmed that dissolution and growth proceed by analogous mechanisms14 and also
identified that crystallographic defects, and in particular screw dislocations, are of
fundamental importance to crystal growth and dissolution processes15. This can be
attributed to the fact that screw dislocations cause deformation (and therefore strain) of
the adjacent crystal lattice, which in turn alters the activation barrier for growth and
dissolution in the vicinity of the dislocation16. A full picture of crystal growth and dissolution
mechanisms can therefore be obtained only by studying the relationship between the
evolution of the network of dislocations within a crystal and its morphology during these
processes.
In this article, we demonstrate how BCDI (refs 17,18) can be used to study the role of
dislocations in dictating the mechanism of growth and dissolution of calcite crystals. Calcite
was selected for study as it is one of the most-studied inorganic crystals, and the crystals
readily grow to a few micrometres in size, with well-defined morphologies. BCDI is an
imaging technique that uses coherent X-rays to image the density (and morphology) of a
crystal and, importantly, the strain within it11,12. Illumination of a crystal that is smaller
than the coherence volume of the beam generates a coherent X-ray diffraction (CXD)
pattern due to scattering from all parts of the crystal. An image of the crystal morphology
can then be generated from the CXD pattern, where the phase of the scattered wave is
reconstructed using iterative phase retrieval algorithms11,12,17 19. The reconstructed
density is complex valued, with the amplitude containing information about the electron
density, r). Phase shifts in the reconstructed complex density arise from strain (internal
3
field, u(r) of the atoms from the ideal lattice points and the scattering vector Q via
r)=Q·u(r) (see Supplementary Information). For a single Bragg peak, a single projection of
u is obtained and components of u perpendicular to Q will not be observed. It is this
sensitivity to deformations that makes BCDI ideal for studying defects within crystals.
Calcite crystals were precipitated by placing 100 l droplets of a solution containing CaCl2,
urea and urease on hydroxyl-terminated, self-assembled monolayers (SAMs) supported on
thin gold films (see Methods). CaCO3 precipitation then occurred on enzymatic hydrolysis of
the urea to ammonium and carbonate20. This method was selected as it generated a high
density of {104} oriented calcite rhombohedra with average diameters of 1.25 m (ref. 21).
BCDI experiments were carried out at beamline I16 at the Diamond Light Source. Individual
calcite crystals below 2 m in size were illuminated with monochromatic, 8 keV X-rays, and
diffraction was recorded at the {104} Bragg peak (see Methods). Three-dimensional (3D)
diffraction data sets (Supplementary Fig. 1) were obtained by rocking an isolated calcite
crystal through its Bragg peak, and the same crystal was monitored while undergoing cycles
of growth and dissolution. Dissolution was achieved by depositing dilute acetic acid solution
on the crystal, whereas growth was achieved by adding a drop of calcium bicarbonate
solution (see Methods). Alignment of the crystal was maintained throughout, as the X-rays
were nominally unfocussed and defined by slits with a square opening of 200 m placed
0.3m before the sample. This large beam size relative to crystal size also ensured that the
sample was coherently illuminated22.
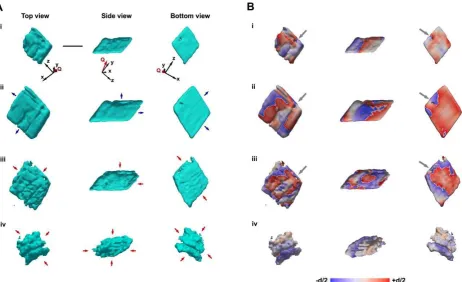
Figure 1 shows 3D images of the crystals as iso-surface renderings of the reconstructed
amplitudes (electron density, see Supplementary Information; Fig. 1a d) and phase
(projected lattice displacement; Fig. 1e h) of the initial crystal (Fig. 1a,e, stage i), after
growth (Fig. 1b,f, stage ii) and after two consecutive dissolution steps (Fig. 1c,g, stage iii, and
d,h, stage iv). The initial crystal (Fig. 1a) is the expected rhombohedron, which is consistent
with scanning electron micrographs (Supplementary Fig. 3). Growth of this crystal (Fig. 1b,c)
leads to an increase in size and a smoothing of the faces exposed to the bulk solution,
whereas the face in contact with the SAM remains unchanged. Interestingly, two of the
faces directed into the solution (indicated with blue arrows) grow more rapidly than the
4
faces of an entirely perfect rhombohedron would be expected to grow at the same rate.
Images of the corresponding projected displacements are shown in Fig. 1e h, where this is
mapped onto an iso-surface with red and blue representing lattice contraction or expansion
respectively by half a lattice spacing. Comparison of the projected displacements before
(Fig. 1e) and after (Fig. 1f) crystal growth shows that these do not grow significantly with the
crystal but remain maximal at the edges. This is indicative of the presence of active growth
fronts23.
The dissolution steps (Fig. 1b,c and c,d) show that the crystal faces retreat along all
directions, but is more pronounced at certain sites (indicated by red arrows). Initial signs of
changes in the crystal shape and the onset of etch-pit formation are visible after the first
stage of dissolution (Fig. 1c), leading to an increase in the specific surface area and
roughness of the crystal. The etch pits are also associated with higher levels of
deformation/strain (Fig. 1g). That relatively little change occurs in the crystal face adjacent
to the substrate is consistent with the intimate contact of the SAM with this nucleation face.
The second dissolution step (Fig. 1c,d) results in a significant change in the crystal
morphology, and the production of a porous isometric form24 that is quite distinct from the
original shape, and which can be attributed to the removal of defect outcrops at the crystal
surface and the coinciding etch pits formed25,26. Looking at the lattice deformation, it is
evident that strain present at the crystal surface reduces with the increased dissolution. This
indicates that the least stable (more strained) regions dissolve first, leaving behind a more
stable core (Supplementary Movies 1 4).
The projected displacement images also reveal a further feature, which is indicated by the
grey arrows in Fig. 1e g, and is present throughout the growth and dissolution of the
crystal. This region possesses both a hollow core and a spiral phase, where this combination
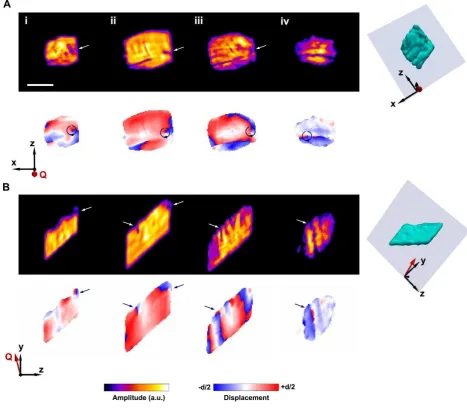
of features is characteristic of dislocations and agrees with 2D images of dislocations
obtained with TEM (ref. 8) and Bragg ptychography27. A number of these dislocations are
highlighted in Fig. 2. Dislocations are characterized by a Burgers vector that measures the
topological shift of the crystal along the dislocation line, where this is usually a lattice vector
of the crystal28. Whenever there is a component of the Burgers vector parallel to the
5
dislocation; in this way crystal growth (and dissolution) can be facilitated. Confirmation that
this feature indeed corresponds to a screw dislocation was obtained by recording the polar
angle dependence of the displacement associated with the core (indicated by the circles in
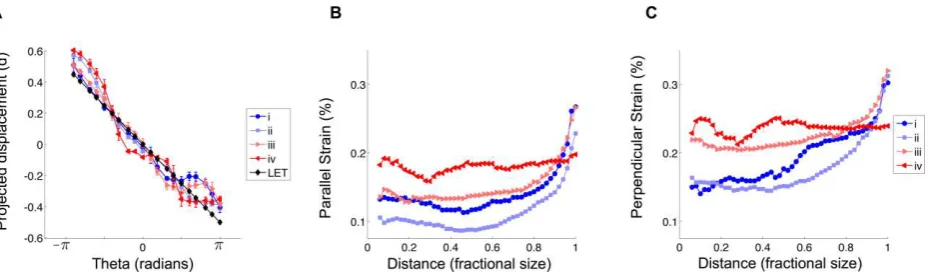
Fig. 2) over the growth/ dissolution cycle of the crystal (Fig. 3a). Although calcite is elastically
anisotropic, an approximately linear relationship was observed and is consistent with what
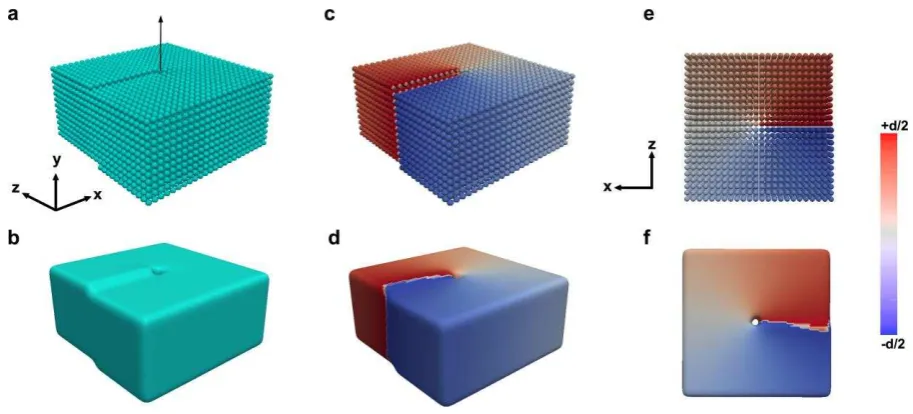
is predicted by linear elasticity theory28 (see Supplementary Information). To further
confirm the nature of the identified dislocation, a comparison is provided between a
simulated screw dislocation and simulated screw after BCDI processing. The model screw
dislocation used in the simulation is shown at atomic resolution in Fig. 4a, with the resulting
displacement of atoms from their ideal lattice positions given in Fig. 4c. The BCDI
experiment simulated screw dislocation is shown in Fig. 4b,d (see Supplementary
Information). Figure 4e,f provide a comparison of BCDI-reconstructed displacement and
simulated displacement, viewed along the dislocation line, and clearly show that the
low-density core and spiral displacement are well-preserved after BCDI processing.
Further examination of regions that showed a spiral deformation and low-amplitude core
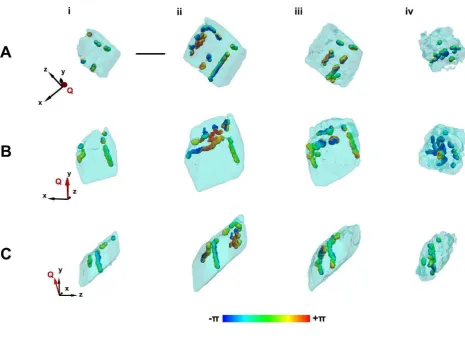
enabled many more dislocations to be identified within the imaged crystal (see
Supplementary Information). These have been rendered and are shown in Fig. 5 and
Supplementary Movies 5 8. In many cases the exact type of dislocation cannot be identified
from a single Bragg reflection, as edge, screw and mixed dislocations will all possess
qualitatively similar deformation fields. The initial crystal (Fig. 5a) possesses several
dislocations which are located relatively close to the crystal surface (down to 200 nm) and
are found predominantly parallel to {104} planes. These dislocations are mainly associated
with the faces exposed to the bulk solution, and are visible throughout a single crystal
growth and dissolution cycle (Fig. 5a c), during which they increase (Fig. 5b) and decrease
(Fig. 5c) in length. The reproducibility of locating the same dislocation across independently
reconstructed data sets provides further credence to the recovered images.
Dislocations are often found to occur in loops or pairs with opposite Burgers vector, as this
reduces the lattice potential energy and resulting long-range strain associated with these
features. They also are stabilized near crystal surfaces, as found in this work, such that
6
solution29. As intuitively expected, the most rapidly growing crystal faces were observed to
have the highest number of surface dislocations. The distribution of these defects within the
crystal therefore plays a part in determining the morphology of the product crystal.
Considering the dissolution process, the locations of the dislocations coincide with the
position of the etch pits that appear at the crystal surface during dissolution. This suggests
that the developing pits follow the cores of the dislocations, where this effect can be
attributed to a reduced activation barrier to dissolution due to stored strain energy in the
defects14. New dislocations could be identified during the dissolution (Fig. 5c,d), and by the
final stage (Fig. 5d) many of the original dislocations had been annihilated. The loss of
faceting and dislocations near the surface support the hypothesis that the least stable
regions dissolve first, leaving behind a more stable core.
To determine the overall effect that the growth/dissolution had on the strain and
deformation of the crystal, the gradient of the displacement was calculated and its
magnitude was plotted as a function of fractional size (Fig. 3b,c). The magnitude of the
gradient was calculated over successively larger shells, averaged over all directions, and is
plotted as a percentage of deformation (strain) relative to the lattice constant for the {104}
reflection (see Supplementary Information) for the directions parallel and perpendicular to
the scattering vector. What is evident (Fig. 3b,c) is that the initial crystallite experiences an
increasing strain from the centre, outwards. This can be compared to a crystal formed after
the first growth stage (Fig. 1f), which shows an overall flatter initial strain, and then
increases more rapidly above a fractional size 0.6. The smoother transition and lower strain
for the direction parallel suggest some relaxation of the crystal after the initial growth and
can also be seen in the slices in Fig. 2. The non-zero strain perpendicular to the scattering
vector is indicative of a shear strain, although we have only a single Bragg peak so the full
strain tensor cannot be obtained and the exact nature of this cannot be determined. These
data are consistent with the assertion that the effect of the surface penetrates only to a
finite distance into a crystal. With the increased roughness and etch-pit formation that
occurs in the first dissolution step (Fig. 1g), the overall strain is higher, demonstrating that
these surface features affect the entire crystal, leading to an increase in overall
7
have been removed, the strain becomes almost flat. This indicates that surface effects are
less pronounced, despite the increased relative surface area.
With its ability to simultaneously generate 3D images of the strain within a crystal and the
gross crystal morphology, BCDI provides an extremely powerful way of visualizing the
network of dislocations present within an individual crystal. Importantly, BCDI can be
performed in the absence of any sample preparation, which means that it can be used to
elucidate the effects of dislocation networks on dynamic crystal behaviour. Using the
example of crystal growth and dissolution, we have located dislocations within calcite single
crystals, and then demonstrated that their distribution within the crystal dictates rapidly
growing directions. Conversely, preferential dissolution and etch-pit formation was also
observed within the vicinity of the dislocations, which provides evidence that the stored
energy within the dislocations affects the crystal response. The ability to view these
fundamental processes using BCDI represents an important step forward in elucidating the
nanoscale mechanisms underlying crystallization processes. Importantly, BCDI also opens
the door to 3D visualization of the role of dislocations in the response of a crystal to a huge
range of experimental conditions, such as temperature changes or mechanical force.
Methods
Methods and any associated references are available in the online version of the paper.
8
Figure 1 | Growth and dissolution of calcite observed by BCDI. a h, Iso-surface rendering of the electron density (reconstructed amplitude) (a d) and projected displacement (phase) (e h) from initially deposited calcite crystal (a,e, stage i), after secondary growth (b,f, stage ii), and after consecutive dissolution steps (c,g, stage iii, and d,h, stage iv). The scale bar is 1 m. Three different viewing angles of the crystal are shown top down, side and bottom up. The substrate would be on the bottom of the crystal shown in the side view. Perspectives highlight the shape transition that occurs during growth (a,b and e,f) and dissolution (b d and f h). Prominent surface advance (growth, blue arrows) and retreat (dissolution, red arrows) directions are shown. The grey arrow points towards the primary dislocation continuously identifiable during crystal growth and dissolution (a c and e g). The beam direction is along the z axis, with the y axis vertical. The scattering vector (Q) is shown in red.
9
Figure 2 | Slices showing the electron density and projected displacement during growth and dissolution. a d, Crystal in the initial state (a), and after growth (b) and repetitive dissolution steps (c,d) for two viewing directions (top view) and (side view). The amplitude is shown in the top rows (black background) with the dislocations highlighted by white arrows featuring a low-amplitude core. The phase presented in the bottom rows also shows selected dislocations highlighted by the dark blue arrows. Particularly evident is the spiral phase (displacement) that is characteristic of a screw dislocation. The iso-surface to the right shows the location of the cut planes. The scale bar is 1 m.
[image:10.595.69.537.204.613.2]10
Figure 3 | Displacement and strain magnitude line plots. a, Recovered projected displacement measured at development stages (i iv) as a function of theta for the dark blue circles with arrows from Fig. 2a. This is compared to the displacement expected by linear elasticity theory (LET). The error bars represent the standard deviation (± ) of the displacement over adjacent layers spanning a region of 200nm along Q. b,c, The magnitude of the strain component parallel (b) and perpendicular (c) to the scattering vector over the growth/dissolution cycle (i iv) plotted as a function of fractional crystal size (centre of the crystal 0 to crystal surfaces 1). These graphs highlight the diminishing relevance of surface effects with growth (ii) of the crystal, and its increasing relevance with dissolution (iii and iv). The strain is calculated as the magnitude of the gradient of the displacement and averaged over successively larger shells.
[image:11.595.77.542.245.384.2]11
Figure 4 | Simulation of a screw dislocation. a, Iso-surface rendering of a screw dislocation with atomic resolution. b, Iso-surface rendering by filtering the Fourier transform of a with a Gaussian centred on the (0,1,0) Bragg peak, replicating the BCDI experiment. c,d, The displacement is rendered onto the iso-surface for the atomic resolution (c) and the phase is rendered onto the surface for the BCDI simulation (d) showing the spiral phase centred around the dislocation core. e,f, Another view of the dislocation for the atomic resolution (e) and BCDI experiment (f), revealing the low-density region at the core in the BCDI experiment simulation. It should be noted that for the atomic resolution the displacement is mapped onto the iso-surface, whereas for the BCDI example the resultant phase is mapped onto the iso-surface.
12
Figure 5 | Iso-surface rendering of defect network within a calcite crystal. a d, Iso-surface renderings of dislocations present within the crystal imaged before (a) and after (b) growth, and after dissolution (c,d). The scale bar is 1 m. The evolution of the dislocations is evident through crystal growth (a,b) and dissolution (b,c and c,d), where these are shown from left to right. Three different viewing angles of the crystals are provided (vertically, top to bottom) from the base, above and the side. Dislocations are predominantly located near the surface and on the faces that grow most rapidly. The phase has been mapped to the iso-surfaces of present dislocations, showing the characteristic spiral.
13
References
1. Stoneham, A. Theory of Defects in Solids (Clarendon, Oxford, 1985).
2. Burton, C. A theory concerning the constitution of mater. Phil. Mag. 33, 191 203 (1892).
3. Lasaga, A. C. & Luttge, A. Variation of crystal dissolution rate based on a dissolution stepwave model. Science 291, 2400 2404 (2001).
4. De Yoreo, J. J. & Vekilov, P. G. Principles of crystal nucleation and growth. Reviews in Mineralogy and Geochemistry 54, 57 93 (2003).
5. Ma, E., Shen, T. D. & Wu, X. L. Nanostructured metals: Less is more. Nat Mater 5, 515 516 (2006).
6. Kunitake, M. E., Mangano, L. M., Peloquin, J. M., Baker, S. P. & Estroff, L. A. Evaluation of strengthening mechanisms in calcite single crystals from mollusk shells. Acta Biomaterialia 9, 5353 5359 (2013).
7. Davis, K. J., Dove, P. M. & De Yoreo, J. J. The role of Mg2+ as an impurity in calcite growth. Science 290, 1134 1137 (2000).
8. Hytch, M. J., Putaux, J.-L. & Penisson, J.-M. Measurement of the displacement field of dislocations to 0.03[thinsp]a by electron microscopy. Nature 423, 270 273 (2003).
9. Barnard, J. S., Sharp, J., Tong, J. R. & Midgley, P. A. High-resolution three-dimensional imaging of dislocations. Science 313, 319 (2006).
10. Chen, C.-C. et al. Three-dimensional imaging of dislocations in a nanoparticle at atomic resolution. Nature 496, 74 77 (2013).
11. Pfeifer, M. A., Williams, G. J., Vartanyants, I. A., Harder, R. & Robinson, I. K. Three dimensional mapping of a deformation field inside a nanocrystal. Nature 442, 63 66 (2006).
12. Robinson, I. & Harder, R. Coherent x-ray diffraction imaging of strain at the nanoscale. Nat Mater 8, 291 298 (2009).
13. Weeks, J. D. & Gilmer, G. H. Dynamics of crystal growth. In Advances in Chemical Physics, 157 228 (John Wiley and Sons, Inc., 2007).
14. Dove, P. M. & Han, N. Kinetics of mineral dissolution and growth as reciprocal microscopic surface processes across chemical driving force. AIP Conference Proceedings 916, 215 234 (2007).
14
16. Brantley, S. L. Kinetics of mineral dissolution. In Brantley, S. L., Kubicki, J. D. & White, A. F. (eds.) Kinetics of Water-Rock Interaction, 151 210 (Springer New York, 2008).
17. Clark, J. N. et al. Ultrafast three-dimensional imaging of lattice dynamics in individual gold nanocrystals. Science 341, 56 59 (2013).
18. Cha, W. et al. Core shell strain structure of zeolite microcrystals. Nat Mater 12, 729 734 (2013).
19. Fienup, J. R. Phase retrieval algorithms: a comparison. Applied Optics 21, 2758 2769 (1982). 20. Antipov, A. et al. Urease-catalyzed carbonate precipitation inside the restricted volume of polyelectrolyte capsules. Macromolecular Rapid Communications 24, 274 277 (2003).
21. Lee, J. R. I. et al. Structural development of mercaptophenol self-assembled monolayers and the overlying mineral phase during templated CaCO3 crystallization from a transient
amorphous film. J. Am. Chem. Soc. 129, 10370 10381 (2007).
22. Clark, J. N., Huang, X., Harder, R. & Robinson, I. K. High-resolution three-dimensional partially coherent diffraction imaging. Nat Commun 3, 993 (2012).
23. Paquette, J. & Reeder, R. J. Relationship between surface structure, growth mechanism, and trace element incorporation in calcite. Geochimica et Cosmochimica Acta 59, 735 749 (1995).
24. Snyder, R. C. & Doherty, M. F. Faceted crystal shape evolution during dissolution or growth. AIChE Journal 53, 1337 1348 (2007).
25. MacInnis, I. N. & Brantley, S. L. The role of dislocations and surface morphology in calcite dissolution. Geochimica et Cosmochimica Acta 56, 1113 1126 (1992).
26. MacInnis, I. N. & Brantley, S. L. Development of etch pit size distributions on dissolving minerals. Chemical Geology 105, 31 49 (1993).
27. Takahashi, Y. et al. Bragg x-ray ptychography of a silicon crystal: Visualization of the dislocation strain field and the production of a vortex beam. Phys. Rev. B 87, 121201 (2013).
28. Hirth, J. P. & Lothe, J. Theory of Dislocations (McGraw-Hill, New York, 1968).
15
Acknowledgements This work was supported by FP7 advanced grant from the European Research Council (J.N.C. and I.K.R.) and an Engineering and Physical Sciences Research Council Leadership Fellowship (F.C.M. and J.I.). It was also funded through an EPSRC Programme Grant (A.S.S. and F.C.M., EP/I001514/1) which funds the Materials in Biology (MIB) consortium, and EPSRC grants EP/J018589/1 (YYK) and EP/K006304/1 (ANK).We thank Diamond Light Source for access to Beamline I-16 (MT 8187, MT 7654 and MT 7277) that contributed to the results presented here.
Author contributions
J.N.C. and J.I. designed the project; J.I. prepared samples; J.N.C., J.I., J.M.C., A.S.S., Y-Y.K., J.M.C., G.N. and I.K.R. performed the experiments; J.N.C. performed image reconstructions; J.N.C. and I.K.R. analysed the data, J.N.C., J.I., F.C.M. and I.K.R. wrote the paper. All the authors read and commented on the manuscript.
Additional information
Supplementary information is available in the online version of the paper. Reprints and permissions information is available online at www.nature.com/reprints. Correspondence and requests for materials should be addressed to J.N.C. or F.C.M.
Competing financial interests