A Method for Separating the Physics
from the Astrophysics of
High-Redshift 21 Centimeter Fluctuations
The Harvard community has made this
article openly available.
Please share
how
this access benefits you. Your story matters
Citation
Barkana, Rennan, and Abraham Loeb. 2005. “A Method for
Separating the Physics from the Astrophysics of High-Redshift 21
Centimeter Fluctuations.” The Astrophysical Journal 624 (2): L65–
68. https://doi.org/10.1086/430599.
Citable link
http://nrs.harvard.edu/urn-3:HUL.InstRepos:41393417
Terms of Use
This article was downloaded from Harvard University’s DASH
repository, and is made available under the terms and conditions
applicable to Other Posted Material, as set forth at
http://
arXiv:astro-ph/0409572v3 27 Jan 2005
Preprint typeset using LATEX style emulateapj v. 6/22/04
A METHOD FOR SEPARATING THE PHYSICS FROM THE ASTROPHYSICS OF HIGH-REDSHIFT 21CM FLUCTUATIONS
RENNANBARKANA1& ABRAHAMLOEB2
Draft version September 29, 2018
ABSTRACT
Fluctuations in the 21cm brightness from cosmic hydrogen at redshifts z&6 were sourced by the primordial density perturbations from inflation as well as by the radiation from galaxies. We propose a method to separate these components based on the angular dependence of the 21cm fluctuation power spectrum. Peculiar velocities increase the power spectrum by a factor of∼2 compared to density fluctuations alone, and introduce an angular dependence in Fourier space. The resulting angular structure relative to the line of sight facilitates a simple separation of the power spectrum into several components, permitting an unambiguous determination of the primordial power spectrum of density fluctuations, and of the detailed properties of all astrophysical sources of 21cm fluctuations. We also demonstrate that there is no significant information to be gained from 21cm measurements on large angular scales. Thus, observational analyses can be confined to small angular areas where projection effects are negligible, and theoretical predictions should focus on the three-dimensional power spectrum of 21cm fluctuations.
Subject headings: galaxies: high-redshift, cosmology: theory, galaxies: formation
1. INTRODUCTION
Following the recombination of protons and electrons less than a million years after the big bang, the universe was filled with neutral hydrogen (HI). Hundreds of millions of years later, the first galaxies began to reionize the cosmic gas (Barkana & Loeb 2001). The spectra of the farthest quasars indicate that reionization completed at a redshift z∼6, a billion years after the big bang (Fan et al. 2002; White et al. 2003; Wyithe et al. 2004). The hyperfine spin-flip transition of HI at a wavelength of 21 cm provides the most promis-ing tracer of the cosmic gas before the end of reionization. Several groups are currently constructing low-frequency ra-dio arrays capable of detecting the diffuse 21cm radiation (http://space.mit.edu/eor-workshop/). Since this radiation in-teracts with HI through a resonant transition, any observed wavelength selects a redshift slice of the universe. Future measurements of the redshifted 21cm brightness as a func-tion of wavelength and direcfunc-tion should provide a three-dimensional map of the cosmic HI (Hogan & Rees 1979; Madau et al. 1997). Fluctuations in the 21cm brightness are sourced by primordial density inhomogeneities on all scales down to the cosmological Jeans mass, making 21cm the rich-est cosmological data set on the sky (Loeb & Zaldarriaga 2004).
The 21cm signal can be seen from epochs during which the gas was largely neutral and deviated from thermal equi-librium with the cosmic microwave background (CMB). The signal vanished at redshifts z&200, when the residual frac-tion of free electrons after cosmological recombinafrac-tion kept the gas kinetic temperature, Tk, close to the CMB tempera-ture, Tγ. But during 200&z&30 the gas cooled adiabati-cally and atomic collisions kept the spin temperature of the hyperfine level population below Tγ, so that the gas appeared in absorption (Scott & Rees 1990; Loeb & Zaldarriaga 2004).
1School of Physics and Astronomy, The Raymond and Beverly Sackler
Faculty of Exact Sciences, Tel Aviv University, Tel Aviv 69978, ISRAEL; [email protected]
2 Astronomy Department, Harvard University, 60 Garden Street,
Cam-bridge, MA 02138; [email protected]
As the Hubble expansion continued to rarefy the gas, radia-tive coupling of Ts to Tγ began to dominate and the 21cm signal faded. When the first galaxies formed, the UV pho-tons they produced between the Lyαand Lyman limit wave-lengths propagated freely through the universe, redshifted into the Lyαresonance, and coupled Tsand Tkonce again through the Wouthuysen-Field (Wouthuysen 1952; Field 1958) effect by which the two hyperfine states are mixed through the ab-sorption and re-emission of a Lyαphoton (Madau et al. 1997; Ciardi & Madau 2003). Emission of UV photons above the Lyman limit by the same galaxies initiated the process of reionization by creating ionized bubbles in the neutral cos-mic gas, while X-ray photons propagated farther and heated
Tkabove Tγthroughout the universe. Once Tsgrew larger than
Tγ, the gas appeared in 21cm emission. The ionized bubbles imprinted a knee in the power spectrum of 21cm fluctuations (Zaldarriaga et al. 2004), which traced the HItopology until the process of reionization was completed (Furlanetto et al. 2004a).
2
21cm measurements on large angular scales are not useful. Thus, observational analyses can be confined to small angular areas where projection effects are negligible.
2. SPIN TEMPERATURE HISTORY
The spin temperature Ts is defined through the ratio be-tween the number densities of hydrogen atoms in the excited and ground state levels, n1/n0= (g1/g0) exp{−T⋆/Ts},where subscripts 1 and 0 correspond to the excited and ground state levels of the 21cm transition, (g1/g0) = 3 is the ratio of the
spin degeneracy factors of the levels, and T⋆= 0.0682K
corre-sponds to the energy difference between the levels. As long as
Ts is smaller than the CMB temperature Tγ= 2.725(1+z) K, hydrogen atoms absorb the CMB, whereas if Ts>Tγthey emit excess flux. In general, the resonant 21cm interaction changes the brightness temperature of the CMB by (Scott & Rees 1990; Madau et al. 1997) Tb=τ Ts−Tγ/(1+z), where the optical depth at a wavelengthλ= 21cm is
τ= 3cλ
2hA 10nH
32πkBTs(1+z) (dvr/dr)
xHI, (1)
where nH is the number density of hydrogen, A10 = 2.85×
10−15 s−1 is the spontaneous emission coefficient, xHI is the
neutral hydrogen fraction, and dvr/dr is the gradient of the radial velocity along the line of sight with vr being the phys-ical radial velocity and r the comoving distance; on average
dvr/dr = H(z)/(1+z) where H is the Hubble parameter. The velocity gradient term arises since the 21cm scattering cross-section has a fixed thermal width which translates through the redshift factor (1+vr/c) to a fixed interval in velocity (Sobolev 1960).
For the concordance set of cosmological parameters (Spergel et al. 2003), the mean brightness temperature on the sky at redshift z is Tb= 28 mK [(1+z)/10]1/2
(Ts−Tγ)/Ts
¯
xHI,
where x¯HI is the mean neutral fraction of hydrogen. The
spin temperature itself is coupled to Tkthrough the spin-flip transition, which can be excited by collisions or by the ab-sorption of Lyαphotons. As a result, the combination that appears in Tb becomes (Field 1958) (Ts−Tγ)/Ts= [xtot/(1+
xtot)] 1−Tγ/Tk, where xtot= xα+xc is the sum of the ra-diative and collisional threshold parameters. These parame-ters are xα= 4PαT⋆/27A10Tγand xc= 4κ1−0(Tk) nHT⋆/3A10Tγ, where Pαis the Lyαscattering rate which is proportional to the Lyαintensity, and κ1−0 is tabulated as a function of Tk (Allison & Dalgarno 1969; Zygelman 2004). The coupling of the spin temperature to the gas temperature becomes substan-tial when xtot&1.
3. BRIGHTNESS TEMPERATURE FLUCTUATIONS
Although the mean 21cm emission or absorption is difficult to measure due to bright foregrounds, the unique character of the fluctuations in Tb allows for a much easier extraction of the signal (Gnedin & Shaver 2003; Zaldarriaga et al. 2004; Morales & Hewitt 2004; Morales 2004; Santos et al. 2004). In general, the fluctuations in Tb can be sourced by fluctua-tions in gas density, temperature, neutral fraction, radial ve-locity gradient, and Lyαflux (through xα). Adopting the no-tation δA for the fractional fluctuation in quantity A (with a loneδdenoting density perturbations), we find
δTb=
1+ xc ˜
xtot
δ+ xα ˜
xtot
δxα+δxHI−δdrvr
+(γa−1)
T
γ
Tk−Tγ
+ xc ˜
xtot
d log(κ1−0)
d log(Tk)
δ , (2)
where the adiabatic index is γa= 1+(δTk/δ), and we define ˜
xtot≡(1+xtot)xtot. Taking the Fourier transform, we obtain the
power spectrum of each quantity; e.g., the total power spec-trum PTbis defined by
h˜δTb(k1)δ˜Tb(k2)i= (2π)
3δD(k
1+k2)PTb(k1), (3) whereδ˜Tb(k) is the Fourier transform ofδTb, k is the comoving wavevector, andh· · ·idenotes an ensemble average.
4. THE SEPARATION OF POWERS
The fluctuationδTbconsists of a number of isotropic sources of fluctuations plus the peculiar velocity term −δdrvr. Its Fourier transform is simply proportional to that of the density field (Kaiser 1987; Bharadwaj & Ali 2004a),
˜ δdrvr=−µ
2˜δ, (4)
whereµ= cosθk in terms of the angleθk of k with respect to the line of sight. Theµ2 dependence in this equation
re-sults from taking the radial component (∝µ) of the peculiar velocity, and then the radial component (∝µ) of its gradient. Intuitively, a high-density region possesses a velocity infall towards the density peak, implying that a photon must travel further from the peak in order to reach a fixed relative redshift, compared with the case of pure Hubble expansion. Thus the optical depth is always increased by this effect in regions with
δ >0. This phenomenon is most properly termed velocity
compression.
We therefore write the fluctuation in Fourier space as ˜
δTb(k) =µ
2δ˜(k)+βδ˜(k)+˜δ
rad(k), (5)
where we have defined a coefficientβby collecting all terms
∝δ in equation (2), and have also combined the terms that depend on the radiation fields of Lyαphotons and ionizing photons, respectively. We assume that these radiation fields produce isotropic power spectra, since the physical processes that determine them have no preferred direction in space. The total power spectrum is
PTb(k) =µ
4
Pδ(k)+2µ2[βPδ(k)+Pδ−rad(k)]+
[β2P
δ(k)+Prad(k)+2βPδ−rad(k)], (6)
where we have defined the power spectrum Pδ−rad as the
Fourier transform of the cross-correlation function,
ξδ−rad(r) =hδ(r1)δrad(r1+r)i. (7)
We note that a similar anisotropy in the power spec-trum has been previously derived in a different context, that of measuring density fluctuations from galaxy redshift sur-veys. In that case, the use of redshifts to estimate distances changes the apparent density of galaxies along the line of sight (Kaiser 1987; Lilje & Efstathiou 1989; Hamilton 1992; Fisher, Scharf, & Lahav 1994). However, in the case of galax-ies there is no analog to the method that we demonstrate below for separating in 21cm fluctuations the effect of initial condi-tions from that of later astrophysical processes.
We may now calculate the angular power spectrum of the brightness temperature on the sky at a given redshift – cor-responding to a comoving distance r0along the line of sight.
The brightness fluctuations can be expanded in spherical har-monics with expansion coefficients alm(ν), where the angular power spectrum
Cl(r0) =h|alm(ν)|2i= 4π
Z d3k
(2π)3
G2l(kr0)Pδ(k)+
2Pδ−rad(k)Gl(kr0) jl(kr0)+Prad(k) j2l(kr0)
with Gl(x)≡ Jl(x)+(β−1) jl(x) and Jl(x) being a linear combination of spherical Bessel functions (Bharadwaj & Ali 2004a).
The velocity gradient term has been previously neglected in 21cm calculations, except for its effect on the sky-averaged power and on radio visibilities (Tozzi et al. 2000; Bharadwaj & Ali 2004a,b). In the simple case whereβ = 1 and only the density and velocity terms contribute, the veloc-ity term increases the total power by a factor ofh(1+µ2)2i=
1.87 in the spherical average. However, instead of averaging the signal, we can use the angular structure of the power spec-trum to greatly increase the discriminatory power of 21cm observations. We may break up each spherical shell in k space into rings of constant µ and construct the observed
PTb(k, µ). Considering equation (6) as a polynomial inµ, i.e.,
µ4P
µ4+µ2Pµ2+Pµ0, we see that the power at just three values
ofµis required in order to separate out the coefficients of 1,
µ2, andµ4for each k.
If the velocity compression were not present, then only the
µ-independent term (times Tb2) would be observed, and its separation into the five components (Tb,β, and three power spectra) would be difficult and subject to degeneracies. Once the power has been separated into three parts, however, theµ4
coefficient can be used to measure the density power spectrum directly, with no interference from any other source of fluctu-ations. Since the overall amplitude of the power spectrum, and its scaling with redshift, are well determined from the combination of the CMB temperature fluctuations and galaxy surveys, the amplitude of Pµ4 directly determines the mean
brightness temperature Tbon the sky, which measures a com-bination of Ts and¯xHI at the observed redshift. Once Pδ(k) has been determined, the coefficients of theµ2 term and the
µ-independent term must be used to determine the remain-ing unknowns, β, Pδ−rad(k), and Prad(k). Since the
coeffi-cient β is independent of k, determining it and thus break-ing the last remainbreak-ing degeneracy requires only a weak addi-tional assumption on the behavior of the power spectra, such as their asymptotic behavior at large or small scales. If the measurements cover Nk values of wavenumber k, then one wishes to determine 2Nk+1 quantities based on 2Nk measure-ments, which should not cause significant degeneracies when
Nk≫1. Even without knowingβ, one can probe whether some sources of Prad(k) are uncorrelated withδ; the quantity
Pun−δ(k)≡Pµ0−P2
µ2/(4Pµ4) equals Prad−Pδ2−rad/Pδ, which re-ceives no contribution from any source that is a linear func-tional of the density distribution.
5. SPECIFIC EPOCHS
At z ∼35, galaxy formation is in its infancy, while collisions are effective due to the high gas density (Loeb & Zaldarriaga 2004). Thus, xtot= xc≫xα, xHI= 1,
and the gas cools adiabatically (withγa= 5/3). In addition to measuring the density power spectrum(Loeb & Zaldarriaga 2004), one can also trace the redshift evolution of nHI, Tγ, and
Tk, and verify that collisions are causing the fluctuations. At z.35, collisions become ineffective but the first stars produce a cosmic background of Lyαphotons that couples Ts to Tk. During the period of initial Lyαcoupling, fluctuations in the Lyαflux translate into fluctuations in the 21cm bright-ness (Barkana & Loeb 2004). This signal can be observed from z∼25 until the Lyαcoupling is completed (i.e., xtot≫1)
at z∼15. At a given redshift, each atom sees Lyαphotons that were originally emitted at earlier times at rest-frame wave-lengths between Lyαand the Lyman limit. Distant sources
FIG. 1.— Observable power spectra during the period of initial Lyα cou-pling. Upper panel: Assumes adiabatic cooling. Lower panel: Assumes pre-heating to 500 K by X-ray sources. We show Pµ4= Pδ (solid curves),
Pµ2(short-dashed curves), and Pun−δ(long-dashed curves). We also show for
comparison 2βPδ(dotted curves).
are time retarded, and since there are fewer galaxies in the distant, earlier universe, each atom sees sources only out to an apparent source horizon of∼100 comoving Mpc at z∼20. A significant portion of the flux comes from nearby sources, because of the 1/r2 decline of flux with distance, and since
higher Lyman series photons, which are degraded to Lyα pho-tons through scattering, can only be seen from a small redshift interval that corresponds to the wavelength interval between two consecutive atomic levels.
There are two separate sources of fluctuations in the Lyαflux (Barkana & Loeb 2004). The first is density inho-mogeneities. Since gravitational instability proceeds faster in overdense regions, the biased distribution of rare galactic ha-los fluctuates much more than the global dark matter density. When the number of sources seen by each atom is relatively small, Poisson fluctuations provide a second source of fluc-tuations. Unlike typical Poisson noise, these fluctuations are correlated between gas elements at different places, since two nearby elements see many of the same sources. Assuming a scale-invariant spectrum of primordial density fluctuations, and that xα= 1 is produced at z = 20 by galaxies in dark matter halos where the gas cools efficiently via atomic cooling, we show in Figure 1 the predicted observable power spectra. The figure shows thatβ can be measured from the ratio Pµ2/Pµ4
at k&1 Mpc−1, allowing the density-induced fluctuations in
flux to be extracted from Pµ2, while only the Poisson
fluctu-ations contribute to Pun−δ. Each of these components probes the number density of galaxies through its magnitude, and the distribution of source distances through its shape. Measure-ments at k&100 Mpc−1can independently probe T
kbecause of the smoothing effects of the gas pressure and the thermal width of the 21cm line.
After Lyαcoupling and X-ray heating are both completed, reionization continues. Since β = 1 and Tk≫Tγ, the nor-malization of Pµ4 directly measures the mean neutral
cross-4
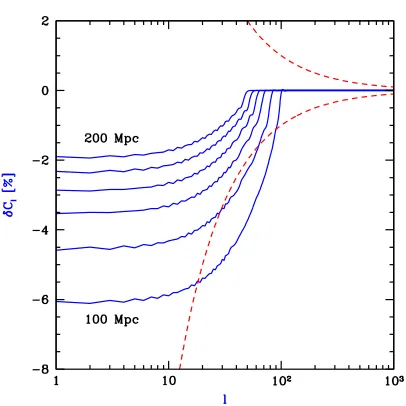
FIG. 2.— Effect of large-scale power on the angular power spectrum of 21cm anisotropies on the sky. This example shows the power from density fluctuations and velocity compression, assuming a hot IGM at z = 12 with
Ts= Tk≫Tγ. We show the % change in Clif we were to cut off the power
spectrum above 1/k of 200, 180, 160, 140, 120, and 100 Mpc (top to bottom).
Also shown for comparison is the cosmic variance for averaging in bands of
∆l∼l (dashed lines).
correlation.
6. FLUCTUATIONS ON LARGE ANGULAR SCALES
Full-sky observations must normally be analyzed with an angular and radial transform, rather than a Fourier transform which is simpler and yields more directly the underlying 3D power spectrum. In an angular transform on the sky, an an-gle ofθradians translates to a spherical multipole l∼3.5/θ. For measurements on a screen at a comoving distance r0,
a multipole l normally measures 3D power on a scale of
k−1∼θr
0∼35/l Gpc for l≫1, since r0∼10 Gpc at z&10.
This estimate fails at l.100, however, when we consider the sources of 21cm fluctuations. The angular projection implied
in Clinvolves a weighted average [equation (8)] which favors large scales when l is small, but density fluctuations possess little large-scale power, and the Cl are dominated by power around the peak of kPδ(k), at a few tens of comoving Mpc.
Figure 2 shows that for density and velocity fluctuations, even the l = 1 multipole is affected by power at k−1>200 Mpc
only at the 2% level. Due to the small number of large angu-lar modes available on the sky, the expectation value of Cl cannot be measured precisely at small l. Figure 2 shows that this precludes new information from being obtained on scales
k−1&130 Mpc using angular structure at any given redshift.
An optimal observing strategy would be to divide the sky into separate angular pixels of sizeθ.2◦, in which the curvature changes distances by onlyθ2/24∼7×10−5. This would
al-low a direct 3D Fourier transform, which is also the most nat-ural way of analyzing radio observations (Morales & Hewitt 2004; Morales 2004).
7. SUMMARY
We have argued that observers should try to measure the anisotropic form of the power spectrum of 21cm fluctuations. Since measurements on large angular scales are not worth-while, the three-dimensional power spectrum may indeed be measured by dividing the sky into small angular areas. The anisotropy itself, which is due to the effect of peculiar veloci-ties, facilitates a simple separation of the power spectrum into three separate components. One component allows an unam-biguous determination of the primordial power spectrum of gas density fluctuations, which if measured will probe basic cosmological parameters as well as inflation. The other two components probe the properties of astrophysical (radiative) sources of 21cm fluctuations.
This work was supported in part by NSF grants AST-0204514, AST-0071019 and NASA grant NAG 5-13292 . R.B. is grateful for the kind hospitality of the Harvard-Smithsonian CfA, and acknowledges the support of an Alon Fellowship at Tel Aviv University and of Israel Science Foun-dation grant 28/02/01.
REFERENCES Allison, A. C., & Dalgarno, A. 1969, ApJ, 158, 423
Barkana, R., & Loeb, A. 2001, Phys. Rep., 349, 125 Barkana, R., & Loeb, A. 2004, ApJ, submitted. Bharadwaj, S., & Ali, S. S. 2004a, MNRAS, 352, 142
Bharadwaj, S., & Ali, S. S. 2004b, MNRAS, submitted, preprint [astro-ph/0406676]
Ciardi, B. & Madau, P. 2003, ApJ, 596, 1 Fan, X., et al. 2002, AJ, 123, 1247 Field, G. B. 1958, Proc. IRE, 46, 240
Fisher, K. B., Scharf, C. A., & Lahav, O. 1994, MNRAS, 266, 219 Furlanetto, S. R., Zaldarriaga, M. & Hernquist, L. 2004a, ApJ, submitted,
preprint astro-ph/0403697
Gnedin, N. Y., & Shaver, P. A. 2003, ApJ, submitted, preprint [astro-ph/0312005]
Hamilton, A. 1992, ApJ, 385, L5
Hogan, C. J., & Rees, M. J. 1979, MNRAS, 188, 791 Kaiser, N. 1987, MNRAS, 227, 1
Lilje, P. B., & Efstathiou, G. 1989, MNRAS, 236, 851
Loeb, A., & Zaldarriaga, M. 2004, Phys. Rev. Lett., 92, 211301 Madau, P., Meiksin, A., & Rees, M. J. 1997, ApJ, 475, 429 Morales, M. F., ApJ, submitted, preprint astro-ph/0406662
Morales, M. F., & Hewitt, J., ApJ, in press, preprint astro-ph/0312437 Santos, M. G., Cooray, A., & Knox, L. 2004, preprint astro-ph/0408515 Scott, D. & Rees, M. J. 1990, MNRAS, 247, 510
Sobolev, V. V. 1960, Moving Envelopes of Stars, Cambridge: Harvard University Press
Spergel, D. N., et al. 2003, ApJS, 148, 175
Tozzi, P., Madau, P., Meiksin, A., & Rees, M. J. 2000, ApJ, 528, 597 White, R. L., Becker, R.H., Fan, X., & Strauss, M.A. 2003, AJ, 126, 1 Wouthuysen, S. A., 1952, AJ, 57, 31
Wyithe, J.S.B., & Loeb, A. 2004, Nature, 427, 815
[image:5.612.70.273.63.266.2]