This is a repository copy of Database on the Long-Term Behaviour of FRC: A Useful Tool to Achieve Overall Conclusions.
White Rose Research Online URL for this paper: http://eprints.whiterose.ac.uk/92896/
Version: Accepted Version
Proceedings Paper:
Serna, P, Llano-Torre, A, García-Taengua, E et al. (1 more author) (2015) Database on the Long-Term Behaviour of FRC: A Useful Tool to Achieve Overall Conclusions. In:
CONCREEP 10: Mechanics and Physics of Creep, Shrinkage, and Durability of Concrete and Concrete Structures. 10th International Conference on Mechanics and Physics of Creep, Shrinkage, and Durability of Concrete and Concrete Structures, 21-23 Sep 2015, Vienna, Austria. American Society of Civil Engineers , 1544 - 1553. ISBN 9780784479346
https://doi.org/10.1061/9780784479346.180
[email protected] https://eprints.whiterose.ac.uk/
Reuse
Unless indicated otherwise, fulltext items are protected by copyright with all rights reserved. The copyright exception in section 29 of the Copyright, Designs and Patents Act 1988 allows the making of a single copy solely for the purpose of non-commercial research or private study within the limits of fair dealing. The publisher or other rights-holder may allow further reproduction and re-use of this version - refer to the White Rose Research Online record for this item. Where records identify the publisher as the copyright holder, users can verify any specific terms of use on the publisher’s website.
Takedown
If you consider content in White Rose Research Online to be in breach of UK law, please notify us by
Database on long term behaviour of FRC: A useful tool to achieve overall conclusions.
P. Serna1, A. Llano-Torre1, E. García-Taengua2 and J. R. Martí-Vargas1
1ICITECH - Institute of Concrete Science and Technology, Universitat Politècnica de
València, Camí de Vera s/n, Valencia, 46022, Spain; PH: +34 96 387 75 63 (Ext. 75631); emails: [email protected], [email protected], [email protected].
2Queen’s University of Belfast, David Keir Bldg., Stranmillis Rd., BT9 5AG Belfast,
UK.; PH +44(0)2890 973091; [email protected]
ABSTRACT
The long term behaviour of Fibre Reinforced Concrete on cracked state is an important research topic, since it is essential to understand this property when using FRC as structural material. The RILEM CCF Technical Committee was created in order to focus the efforts of all researchers on the better understanding of creep behaviour. One of the objectives of the TC was to compile a global database of results of creep test in order to analyse this phenomenon in an overall review. In order to achieve a complete enough database, several minimal variables and parameters data have been proposed on this first attempt. This first database of creep results is based on flexural creep test with different environmental conditions. In future, it can be extended to other testing methodologies. Thanks to this database, first conclusions start reveal those variables which have a higher significance level in creep deferred behaviour.
INTRODUCTION
In Fibre Reinforced Concrete (FRC) specimens at cracked state under sustained loading, creep gives a deferred crack opening in the cracked section. The control and evolution of these crack openings through time is important considering the serviceability limit state and durability of FRC elements.
Several research groups over the world focus their studies on FRC in order to achieve a better understanding the long-term behaviour of FRC in the cracked state.
Tensile creep in cracked state has been studied on both cylindrical specimens (Zhao et al. 2012) and prismatic specimens (Babafemi & Boshoff 2015). Flexural creep researches are more extended. Some of these studies are focused on the material characterization (Bast et al. 2007, Zerbino & Barragán 2012); meanwhile other studies are focused in the behaviour of FRC in structural elements or beams (Buratti and Mazzotti 2012, Vasanelli et al. 2013) in addition to traditional reinforcement. Nowadays there is not yet a clear explanation on how the obtained conclusions of tensile creep test can be related with the flexural creep behaviour.
guideline in flexural creep characterization (ÖVBB-Richtlinie 2008) Different setups
for the flexural creep test have been used by different authors, and therefore it is not possible to draw accurate conclusions from the comparison of results from different sources. FRCs usually shows a great variability in their mechanical properties as residual strength that contributes to the dispersion of experimental outputs.
Specific creep terminology and analysis parameters have been recently proposed by Arango et al. 2012, as an attempt to establish a basis for the purpose of standardising, for the different stages of the creep tests processes which includes pre
-cracking, loading, unloading, recovery and a final bending test until failure.
The RILEM CCF TC was created in 2014 with the objectives of coordinate research efforts and compile the results of studies about creep behaviour of FRC, evaluate the structural repercussions of creep, propose unified test methods to determine the parameters characterizing creep behaviour clarifying the criteria to analyse the test results, analyse the significant variables that influence creep behaviour of cracked sections and develop practical recommendations and design criteria for structural elements. In brief, the aim is to collect all available information and knowledge about creep and coordinate on-going research efforts to produce a
state-of-the-art report and RILEM recommendations
Most of the studies about creep in FRC are not covering a general review of FRC creep since they are limited to one type of fibre, concrete mix design, or a certain fibre content or level load. Moreover, research data sets described in the literature are often incomplete and contain unexpected inconsistencies. This work about the proposed database compiled from flexural creep test follows this CCF TC objective. It is large enough to provide conclusion covering all ranges of variables.
This is a first attempt to stablish the principles and basement of a database. The authors have collect their own experimental data from flexural creep tests over 5 years of researches including over 80 specimens tested with different types of fibres, concretes and environmental conditions. All the results collected were obtained following the same methodology and creep test setup. These results are consistent so that the experimental results could be easily compared.
Finally, statistical analysis has been used to obtain general conclusions and trend of all FRCs that could not be advised without an overall review. This creep database and the following extensions would be very helpful in future investigations.
OBJECTIVES AND SCOPE
This works propose the structure of a global creep test results database compiled arranged by variables and kinds of data. At this moment, this database collects results of our own flexural creep test. The establishment of certain creep specific terminology and creep parameters definition is needed in order to obtain comparable results. This database may be extended in future to other creep test methodologies y suitable to compare different criteria.
CREEP TEST METHODOLOGY
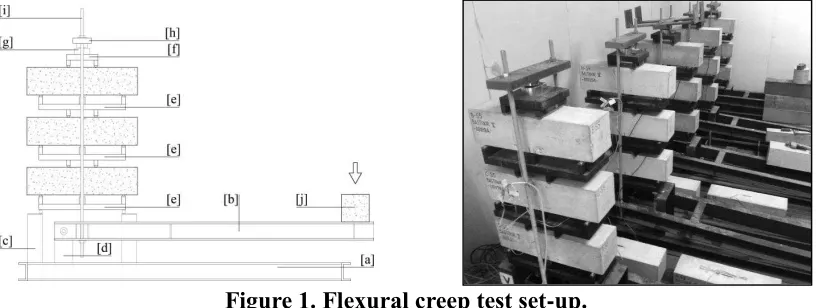
Creep test procedure. The flexural creep tests procedure was carried out on notched FRC prismatic specimens, following the standard EN 14651, which were individually pre-cracked until a certain CMOD in a 4-point bending test. Once all specimens were
pre-cracked, they were transferred to the creep frames as seen in Figure 1 and tested
under sustained flexural load for at least 90 days. A more detailed description of this creep test setup-up methodology is given in Arango et al. 2012 and García-Taengua et
al. 2014.
[image:4.612.103.513.211.365.2]
Figure 1. Flexural creep test set-up.
Variables. Main variables of these creep test are those referred to concrete like compressive strength fc and those referred to fibres as dimensions, slenderness, material and dosage. Several types of fibres have been considered in reinforcement: steel, synthetic and glass fibres. All these variables are important to define the FRC residual behaviour but not all of them may be significant into the FRC creep behaviour.
Other variables are referred to the creep test set-up like the pre-cracking level wp or the nominal load ratio IFn, defined as the ratio between the load applied in creep frames to the specimens and the residual load at the pre-cracking test, usually
corresponding to CMOD of 0.5 mm. That means that this load variable represents a percentage of the residual performance of each specimen.
During the creep test, variables as temperature and humidity were also continuously registered to ensure stable environmental conditions.
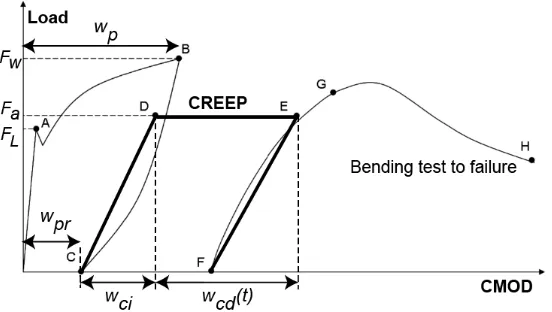
Creep test output data and coefficients. The idealized curve of the complete creep testing procedure is shown in Figure 2. This curve represents the three main stages of the creep test: pre-cracking stage (OC), creep stage (CF) and final bending test until
failure (FH). These three curves plotted together represent the whole process of the creep test.
During the test, several parameters are measured and registered at different periods of the test. Some of main parameters of the test are also represented in Figure 2, such as the pre-cracking test crack opening wp, pre-cracking test residual crack
opening wpr, instant crack opening wci and deferred crack opening wtcd. Other
Figure 2. Idealized curve obtained in a complete testing process.
The main creep coefficients considered to evaluate creep behaviour are obtained by the experimental outputs following these expressions:
Creep coefficient ow,j referred to origin of the stress:
o
w,j = w jcd / w oci where:
w oci = wpr + wci
Creep coefficient cw,j referred to the creep stage:
c
w,j = w jcd / wci
Crack Opening Rates COR(t1-t2):
COR t1-t2 = (w t2
cd - w t1cd) / (t2 - t1)
All of these creep coefficients can be considered for different time periods in order to analyse the evolution of deferred strains during the test. For instance 0, 14, 30, 90, 180 and 360 days are proposed as time lapses.
CREEP DATABASE
Data groups. In order to be rigorous, it is recommended to gather all data in groups according to the information given of the data. This aggrupation aids to arrange all the data since otherwise, database will be a chaos. The first group proposal groups is: A Identity data, B Environmental conditions, C Concrete matrix, D Fibres, E Flexural behaviour, F Test parameters, G Creep test output data and H Creep behaviour characterization.
These data groups are arranged in order of appearance in the testing process, from data related to the research, specimens casting, concrete properties, testing results and final coefficients finally obtained.
It is important to clarify, that even if any data seems to be useless, all of them are designed to identify each specimen of the database and its origin in a fast and useful way. The more data provided the first time to the database, the better, since one will assure not be asked for more information in next future.
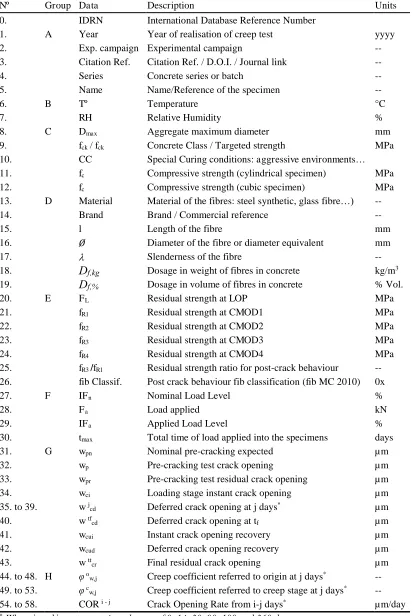
Table 1. Listing of data, description and units of database.
Nº Group Data Description Units
0. IDRN International Database Reference Number
1. A Year Year of realisation of creep test yyyy
2. Exp. campaign Experimental campaign --
3. Citation Ref. Citation Ref. / D.O.I. / Journal link --
4. Series Concrete series or batch --
5. Name Name/Reference of the specimen --
6. B Tº Temperature °C
7. RH Relative Humidity %
8. C Dmax Aggregate maximum diameter mm
9. fck / fck Concrete Class / Targeted strength MPa
10. CC Special Curing conditions: aggressive environments…
11. fc Compressive strength (cylindrical specimen) MPa
12. fc Compressive strength (cubic specimen) MPa
13. D Material Material of the fibres: steel synthetic, glass fibre…) --
14. Brand Brand / Commercial reference --
15. l Length of the fibre mm
16. Ø Diameter of the fibre or diameter equivalent mm
17. Slenderness of the fibre --
18. Df,kg Dosage in weight of fibres in concrete kg/m3
19. Df,% Dosage in volume of fibres in concrete % Vol.
20. E FL Residual strength at LOP MPa
21. fR1 Residual strength at CMOD1 MPa
22. fR2 Residual strength at CMOD2 MPa
23. fR3 Residual strength at CMOD3 MPa
24. fR4 Residual strength at CMOD4 MPa
25. fR3 /fR1 Residual strength ratio for post-crack behaviour --
26. fib Classif. Post crack behaviour fib classification (fib MC 2010) 0x
27. F IFn Nominal Load Level %
28. Fa Load applied kN
29. IFa Applied Load Level %
30. tmax Total time of load applied into the specimens days
31. G wpn Nominal pre-cracking expected µ m
32. wp Pre-cracking test crack opening µ m
33. wpr Pre-cracking test residual crack opening µ m
34. wci Loading stage instant crack opening µ m
35. to 39. w j
cd Deferred crack opening at j days* µ m
40. w tf
cd Deferred crack opening at tf µ m
41. wcui Instant crack opening recovery µ m
42. wcud Deferred crack opening recovery µ m
43. w tt
cr Final residual crack opening µ m
44. to 48. H o
w,j Creep coefficient referred to origin at j days* --
49. to 53. c
w,j Creep coefficient referred to creep stage at j days* --
54. to 58. COR i - j Crack Opening Rate from i-j days* µm/day
Although each specimen has its own name or references, a reference number inside the database is needed. Therefore, the International Database Reference Number or IDRN is proposed and given to each specimen provided to the database in order to identify all the specimens inside the database. Identity data of the experimental campaign and concrete specimens are really essential in order to identify the source and research of each specimen. These items will help after year to locate each specimen and any publication where the results appeared.
Some additional information data may be added in future updates of this database since this proposal is opened to discussion. The main goal is to achieve a useful creep test analytic tool.
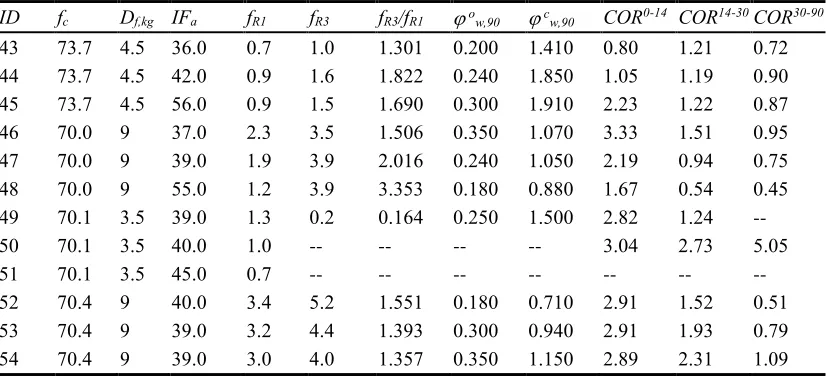
[image:7.612.100.513.279.468.2]Due to the large number of variables inside the database, Table 2 shows a sample extract from the database with certain of the variables values for some ID specimen.
Table 2. Sample extract of specimen data from the database.
ID fc Df,kg IFa fR1 fR3 fR3/fR1 ow,90 cw,90 COR0-14 COR14-30COR30-90 43 73.7 4.5 36.0 0.7 1.0 1.301 0.200 1.410 0.80 1.21 0.72 44 73.7 4.5 42.0 0.9 1.6 1.822 0.240 1.850 1.05 1.19 0.90 45 73.7 4.5 56.0 0.9 1.5 1.690 0.300 1.910 2.23 1.22 0.87
46 70.0 9 37.0 2.3 3.5 1.506 0.350 1.070 3.33 1.51 0.95
47 70.0 9 39.0 1.9 3.9 2.016 0.240 1.050 2.19 0.94 0.75
48 70.0 9 55.0 1.2 3.9 3.353 0.180 0.880 1.67 0.54 0.45
49 70.1 3.5 39.0 1.3 0.2 0.164 0.250 1.500 2.82 1.24 --
50 70.1 3.5 40.0 1.0 -- -- -- -- 3.04 2.73 5.05
51 70.1 3.5 45.0 0.7 -- -- -- -- -- -- --
52 70.4 9 40.0 3.4 5.2 1.551 0.180 0.710 2.91 1.52 0.51
53 70.4 9 39.0 3.2 4.4 1.393 0.300 0.940 2.91 1.93 0.79
54 70.4 9 39.0 3.0 4.0 1.357 0.350 1.150 2.89 2.31 1.09
This sample extract from the database helps to imagine how many data have been collected for this first attempt, but if more test results are added, it could became an essential tool for creep researchers.
ANALYSIS AND RESULTS
Once the database is compiled starts the overall analysis of creep test results. The main objective of this analysis is to evaluate the relations between the variables and the parameters of this database, identifying the variables that have a statistical significance on most of creep parameters. When these significant variables are identified, creep tests and creep parameters can be regarded in a global view and all global conclusions obtained will be very helpful in future for the design of experiments stage of new creep test.
Multiple Linear Regression. In this first analysis, a Multiple Linear Regression
means of a stepwise regression (Hair et al. 2009) considering a threshold for p-values
identifying significant effects as 0.05 in all cases. That procedure assures a confidence level of 95% in all analysis.
After some preliminary analyses, as expected, a high degree of multicolinearity was detected if all similar variables were considered at the same time. It is not possible to consider all the variables in the same model, since their not being independent would compromise the reliability of any conclusion. Instead of that, different MLR modelling approaches must be considered.
In this first study, as independent variables have been taken the type of fibre, concrete compressive strength fc, fibre content Df,kg, and load ratio IFa, following this general expression:
cpi = Ki + ai IFa + bi fc + ci Df,kg
where cpi refers to each creep parameter analysed; Ki is a coefficient dependent on the fibre type; ai, bi, and ci are coefficients to be fitted; IFa is the real applied load ratio in %; fc is the compressive strength of concrete in MPa, Df,kg is the fibre content in kg/m3.
The different creep parameters compared in this first approach were ow,90,
cw,90, COR0-14, COR14-30 and COR30-90, since they are some of the most representative parameters and all specimens have these values.
For the analysis of these creep parameters cpi, all coefficients of variables have been estimated by least squares when the model is fitted to experimental data. The results of these significance tests on creep coefficients are summarized in Table 3. Each row of the table represents one MLR analysis by mean of one cross in case of significant effect of the variable and the R-squared value of the analysis. Blank cells
[image:8.612.98.515.487.589.2]in the table mean no statistically significant effects. A quick way of analyse the significance of each variable is counting the number of parameters on which each particular variable has a statistically significant effect by counting the crosses. Last row of the Tables 3 gives this count of significant effects for each variable.
Table 3. Results from MLR analyses on creep parameters: Significant variables.
fc Df,kg IFa R2
o
w,90 x x x 0.8383
c
w,90 x x 0.7707
COR0-14 x 0.4769
COR14-30 x x x 0.4059
COR30-90 x x x 0.3493
(Count) 4 5 3
Results discussion. After the different analysis realized to the database, some clear tendencies can be observed plotting the equations vs. each variable. For instance, in Figure 3 are shown the evolution of the creep coefficient at 90 days referred to origin
w,90 along the range of both independent variables load ratio IFa and compressive
Figure 3. Tendencies of ow,90 versus the variables IFa and fc.
In case of load ratio IFa plot, the creep parameter follows an ascendant evolution (positive), and that means that increasing the variable increases also the parameter. Therefore, that variable can be explained as statistically significant with positive sign. On the other hand, for the compressive strength fc plot, the creep coefficient follows a descendant evolution (negative), what means that increasing the variable, the creep parameter decreases. In this case, the behaviour of this parameter shows a statistically significances of the variable in a negative way.
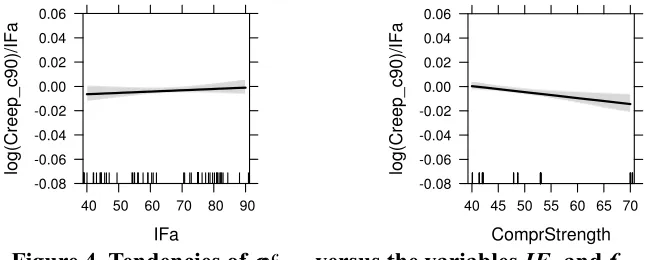
[image:9.612.146.469.386.516.2]In a similar way, the analysis of creep coefficient referred to creep stage at 90 days cw,90, shows in Figure 4 the evolution along the variables presented with, in both cases, a clear straight and continuous tendency.
Figure 4. Tendencies of cw,90 versus the variables IFa and fc.
In this case, for load ratio IFa variable plot, the creep parameter follows a straight evolution that seems to be horizontal. That justifies that the analysed variable has no statistical significance and the creep parameter remains stable in load ratio range. In the plot of compressive strength fc variable, the creep coefficient follows a descendant evolution (negative), meaning a negative statistically significances: the higher compressive strength of the concrete, the lower creep coefficient.
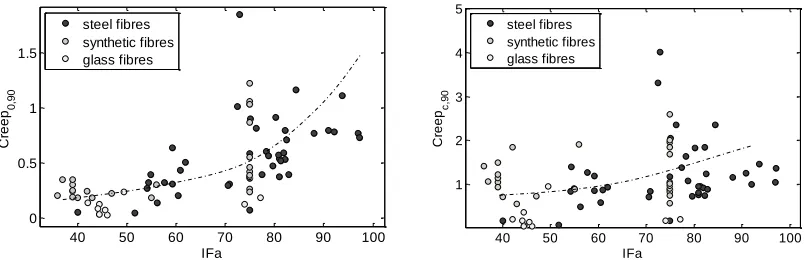
The tendencies obtained in previous figures with the creep coefficient as logarithmic parameter typified by the load ratio, are confirmed in Figure 5, since a straight line turns into an exponential line if natural creep coefficients are represented. Both plots show exponential behaviours versus de load ratio variable IFa. In case of the creep coefficient ow,90 referred to origin at 90 days, the parameter grows exponentially with the load ratio IFa. Meanwhile, the cw,90, where the significance
IFa lo g (C re e p _ o9 0) /I F a -0.08 -0.06 -0.04 -0.02 0.00 0.02
40 50 60 70 80 90
ComprStrength lo g (C re e p _ o9 0) /I F a -0.08 -0.06 -0.04 -0.02 0.00 0.02
40 45 50 55 60 65 70
IFa lo g (C re e p _c 90 )/ IF a -0.08 -0.06 -0.04 -0.02 0.00 0.02 0.04 0.06
40 50 60 70 80 90
ComprStrength lo g (C re e p _c 90 )/ IF a -0.08 -0.06 -0.04 -0.02 0.00 0.02 0.04 0.06
was no relevant, the creep parameter values rest nearly constant even with highest levels of load ratio.
[image:10.612.106.510.112.242.2]
Figure 5. Evolution of ow,90 and cw,90 depending the IFa applied.
These overall conclusions could not be obtained without this compiled database, since a high number of creep test results are needed in this kind of analysis. Moreover, each creep test gives few quantities of results in spite of their long duration, so it would be beneficial for all to compile the most creep test results as possible. The more results added to the database, the better and the closer conclusions will be obtained.
CONCLUSIONS
A first attempt of a database compilation of creep test results has been made and its subsequent analysis has made it possible to reach the following conclusions:
Several creep testing methodologies exist making difficult the comparison between the different results. It is important to unify methodologies into a single one for each kind of creep test.
A first proposal of a database and its structure has been made. This database is organised in data groups defined to collect comparable data.
It is proposed a first attempt of unification of specific creep terminology and glossary for every researches and standards. This unification helps the researches avoid errors in tests comparison
The proposed creep database is a useful tool in order to analyse global behaviour of different FRC specimens.
An analysis of the database has been realised and first general conclusions of creep behaviour of FRC have been obtained, such as the high significance of the variables load ratio IFa and in the creep parameters.
Everybody can participate in this database by providing their own test results and all participants will have free access to the whole database. The more results added to the database, the better and the closer conclusions will be obtained.
40 50 60 70 80 90 100
0 0.5 1 1.5
IFa
C
re
e
p0
,9
0
steel fibres synthetic fibres glass fibres
40 50 60 70 80 90 100
1 2 3 4 5
IFa
C
re
e
pc
,9
0
ACKNOWLEDGEMENTS
The authors of this work wish to thank the Spanish Ministry of Economy and Competitiveness and the European Regional Development Fund, for the following funded projects "BIA2012-35776 (FISNE)”.
REFERENCES
Arango, S., Serna, P., Martí-Vargas, J. R. and García-Taengua, E. (2012). “A Test
Method to Characterize Flexural Creep Behaviour of Pre-cracked FRC
Specimens.” Experimental Mechanics, 52, pp. 1067-1078.
Babafemi, A. J. and Boshoff, W. P. (2015). “Tensile creep of macro-synthetic fibre
reinforced concrete (MSFRC) under uni-axial tensile loading.” Cement and Concrete Composites, 55, pp. 62-69
Bast, T., Eder, A., and Kusterle, W. (2007). “Kriechversuche an Kunststoffmakro
-faserbetonen Untersuchungen zum Langzeitverhalten von Faserbetonen unter Biegezugbeanspruchung - ein Zwischenbericht.” Faserbeton Beiträge zum 11.
Vilser Baustofftag, pp. 32-35.
Buratti N. and Mazzotti C. (2012). “Temperature effect on the long term behaviour of macro-synthetic and steel fibre reinforced concrete.” In: 8th RILEM international symposium on fibre reinforced concrete: challenges and opportunities, 19-21 September, Guimaraes, Portugal, 2012. p. 715-25.
EN 14651:2007. Test Method for Metallic Fibered Concrete - Measuring the Flexural
tensile Strength (Limit of Proportionality (LOP), Residual), CEN - European Committee for Standardization, Brussels (2005), pp. 1-17.
fib Model Code for Concrete Structures 2010 (2013), Wiley-VCH Verlag GmbH &
Co. KGaA, pp. 74-150.
García-Taengua, E., Arango, S., Martí-Vargas, J. R. and Serna, P. (2014). “Flexural
creep of steel fiber reinforced concrete in the cracked state.” Construction and Building Materials, 65, pp. 321-329.
Hair, F., Black, W., Babin, B. and Anderson, R. (2009). Multivariate Data Analysis, 7th edition, Prentice Hall, 2009, 816 pp.
ÖVBB-Richtlinie (2008). “Faserbeton”, Österreichische Vereinigung für Beton- und
Bautechnik, 2008, 109 pp.
Vasanelli, E., Micelli, F., Aiello, M. A. and Plizzari, G. (2013). “Long term behavior of FRC flexural beams under sustained load.” Engineering Structures, 56, pp. 1858-1867.
Zerbino R. and Barragán B. (2012), Long-term behavior of cracked steel fiber
reinforced concrete beams under sustained loading. ACI Materials Journal, 109 (2), pp. 215-224.
Zhao G, Di Prisco M. and Vandewalle L. (2012). “Experimental research on uni-axial