R
ESEARCHA
RTICLEAn analysis of the impact of pre-analytical factors on the
urine proteome: Sample processing time, temperature,
and proteolysis
Sophie Hepburn
1,2∗, David A. Cairns
1∗, David Jackson
3∗, Rachel A. Craven
1, Beverley Riley
1,
Michelle Hutchinson
1, Steven Wood
1, Matthew Welberry Smith
1,4, Douglas Thompson
1,2and Rosamonde E. Banks
11Clinical and Biomedical Proteomics Group, Leeds Institute of Cancer and Pathology, St James’s University Hospital, Leeds, UK
2Department of Blood Sciences, The General Infirmary, Leeds, UK 3Nonlinear Dynamics, Newcastle, UK
4Department of Renal Medicine, St James’s University Hospital, Leeds, UK
Received: July 22, 2014 Revised: September 20, 2014 Accepted: November 10, 2014 Purpose: We have examined the impact of sample processing time delay, temperature, and
the addition of protease inhibitors (PIs) on the urinary proteome and peptidome, an important aspect of biomarker studies.
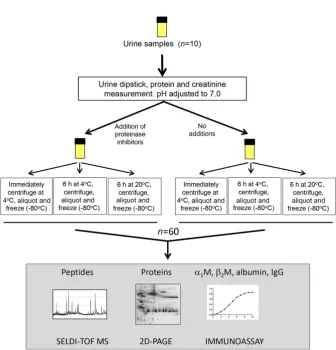
Experimental design: Ten urine samples from patients with varying pathologies were each divided and PIs added to one-half, with aliquots of each then processed and frozen immediately, or after a delay of 6 h at 4⬚C or room temperature (20–22⬚C), effectively yielding 60 samples in total. Samples were then analyzed by 2D-PAGE, SELDI-TOF-MS, and immunoassay.
Results:Interindividual variability in profiles was the dominant feature in all analyses. Minimal changes were observed by 2D-PAGE as a result of delay in processing, temperature, or PIs and no changes were seen in IgG, albumin,2-microglobulin, or␣1-microglobulin measured by
immunoassay. Analysis of peptides showed clustering of some samples by presence/absence of PIs but the extent was very patient-dependent with most samples showing minimal effects.
Conclusions and clinical relevance: The extent of processing-induced changes and the benefit of PI addition are patient- and sample-dependent. A consistent processing methodology is essential within a study to avoid any confounding of the results.
Keywords:
Peptides / Protease inhibitor / Proteomics / Temperature / Urine
Additional supporting information may be found in the online version of this article at the publisher’s web-site1
Introduction
There is considerable interest in the use of urine for biomarker studies, particularly in urological diseases since it potentially contains proteins secreted or shed directly from the kidney, bladder, or prostate at higher concentrations than in the peripheral circulation, in addition to products
Correspondence: Professor Rosamonde E. Banks, Cancer
Re-search UK Centre, Leeds Institute of Cancer and Pathology, St. James’s University Hospital, Leeds LS9 7TF, UK
E-mail: [email protected]
Abbreviations: PI(s), protease inhibitor(s);RT, room temperature
of glomerular filtration from the systemic circulation. Addi-tionally, it can be collected noninvasively in relatively large quantities, is less complex than serum, repeated sampling is possible for monitoring, and the majority of proteins are soluble [1–3]. However, analytical challenges include its di-lute nature and high salt content, and its marked biological variability, being influenced by a variety of factors including hydration state, diet, timing, exercise, gender, and age [1–3].
Relatively few urinary biomarkers have been approved by the FDA with examples including nuclear matrix protein 22 (NMP22) and bladder tumor associated antigen (complement
∗These authors contributed equally to this work.
Colour Online: See the article online to view Figs. 1, 6 and 8 in color.
C
Clinical Relevance
Urine is often used for biomarker discovery studies in diseases affecting the urinary tract. However, rel-atively few studies have investigated the potential impact of pre-analytical factors on urinary proteins and most such studies have used urine from healthy controls. This study has investigated the effects of processing time, temperature, and use of PIs on pro-teins and peptides in urine using 2D-PAGE and SELDI, and importantly using urine samples from patients from different disease groups. Overall, our conclu-sions are that the dominant factors are the disease
and interpatient differences but that changes in pep-tides (and to a lesser extent proteins) can occur to a limited and variable extent during sample process-ing/storage depending on the patient, particularly in-volving proteolytic activity. It is important that within studies, a consistent sample processing methodol-ogy is employed in order to allow robust unbiased conclusions to be drawn, and that the stability of any potential identified biomarkers for the specific pro-cessing conditions is checked.
factor H related protein/complement factor H) for use in blad-der cancer surveillance [4] and there is now an enhanced effort to use proteomic technologies to identify new biomarkers. Recent proteomic studies employing extensive fractionation describe more than 2300 proteins in urine [5], and>100 000 different peptides with at least 5000 occurring in>20% of patients in any disease group [6]. Such datasets provide a valuable resource with many available online (linked from www.urineproteomics.org). The potential of these types of study is now beginning to be recognized, as illustrated by the CKD273 peptide classifier for type 2 diabetic nephropathy [7]. Several studies describe the development of standardized urine proteomic analysis methodologies for different plat-forms with a consideration of the various technical aspects (e.g. [8–12]). However, although the potential impact of var-ious pre-analytical factors during clinical sample processing on proteomic studies is increasingly being recognized [13], relatively few systematic studies have been undertaken us-ing urine. Initiatives such as the “Biospecimen Reportus-ing for Improved Study Quality” [14] provide guidance generically for some of the aspects to consider recording with studies involving clinical samples and a review has highlighted some of the areas that require further examination for urinary-based studies, including the effects of protease inhibitors (PI) and processing/storage conditions [15]. Various studies have investigated such aspects, but these are limited in mostly having used samples from healthy controls, often from only one or two individuals and often only analyzing or reporting relatively gross readouts, for example numbers of proteins identified. With these caveats, studies using LC-MS/MS have reported no significant effects of storage at room tempera-ture (RT) for up to 24 h [16] and no impact of PI during frozen storage as assessed by either LC-MS/MS or 2D-PAGE [9, 12]. Analysis of peptides by MALDI/SELDI has shown temperature-dependent effects with changes if stored at 4⬚C compared with−20⬚C [11] or 6 h at 25⬚C but not 4⬚C [17], small differences between 4⬚C and RT but increasing at 72 h compared with 1 or 6 h [18], and a decrease in the number of peaks at RT, which was not seen in the presence of PI
until time points greater than 2 h [19]. Using CE-MS, leaving urine samples at 4⬚C for 24 h or RT for 6 h did not alter the statistical spread of results or result in altered classification of the samples in the model [10].
In this study, we have systematically examined the effects of sample processing time, temperature, and the presence or absence of PI on urine samples, parameters highlighted as requiring further study to contribute to the evidence underlying recommendations for standardized protocols [15]. Proteins and peptides were examined globally using 2D-PAGE and SELDI-TOF-MS, respectively, in addition to immunoassay of the specific proteins, retinol-binding protein, 2-microglobulin (2M), ␣1-microglobulin (␣1M),
IgG, and albumin. Importantly, samples used were from patients with a spectrum of renal/urological conditions as different pathologies may impact potentially more than would be seen in urine samples from healthy controls. Such studies examining pre-analytical factors are critically important in the interpretation of biomarker studies, both in terms of allowing comparisons between studies and in providing evidence to drive the development of standardized protocols.
2
Materials and methods
2.1 Materials
Materials were purchased from the following suppliers as indicated: CyDyeTM Cy5 DIGE Fluor minimal dye,
ImmobilineTM DryStrip IPG strips (pH 3–10NL, 24 cm; GE
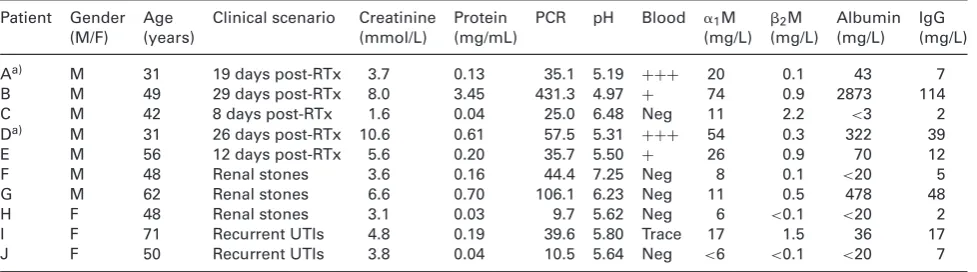
Table 1. Patient characteristics and urine biochemistry
Patient Gender Age Clinical scenario Creatinine Protein PCR pH Blood ␣1M 2M Albumin IgG
(M/F) (years) (mmol/L) (mg/mL) (mg/L) (mg/L) (mg/L) (mg/L)
Aa) M 31 19 days post-RTx 3.7 0.13 35.1 5.19 +++ 20 0.1 43 7
B M 49 29 days post-RTx 8.0 3.45 431.3 4.97 + 74 0.9 2873 114
C M 42 8 days post-RTx 1.6 0.04 25.0 6.48 Neg 11 2.2 <3 2
Da) M 31 26 days post-RTx 10.6 0.61 57.5 5.31 +++ 54 0.3 322 39
E M 56 12 days post-RTx 5.6 0.20 35.7 5.50 + 26 0.9 70 12
F M 48 Renal stones 3.6 0.16 44.4 7.25 Neg 8 0.1 <20 5
G M 62 Renal stones 6.6 0.70 106.1 6.23 Neg 11 0.5 478 48
H F 48 Renal stones 3.1 0.03 9.7 5.62 Neg 6 <0.1 <20 2
I F 71 Recurrent UTIs 4.8 0.19 39.6 5.80 Trace 17 1.5 36 17
J F 50 Recurrent UTIs 3.8 0.04 10.5 5.64 Neg <6 <0.1 <20 7
␣1M,␣1microglobulin;2M,2microglobulin; Neg, negative; PCR, protein creatinine ratio; RTx, renal transplantation; UTI, urinary tract
infection; blood, based on dipstick reading.
a) The samples labeled as patients A and D originated from the same patient 1 wk apart.
UK); sequencing grade modified porcine trypsin (Promega, Southampton, UK). All other chemicals were obtained from Sigma-Aldrich (Dorset, UK), and were of analytical grade or above. Milli-Q water was used throughout.
2.2 Urine sample collection and processing
Ten midstream urine samples were prospectively collected from nine patients following renal transplantation or attend-ing St. James’s University Hospital in Leeds with a variety of benign renal/urological conditions, between October 2009 and January 2010 (Table 1). The study was approved by the Leeds East Research Ethics committee and informed consent was obtained. Immediately following voiding, samples were tested for blood and protein using a dipstick (Siemens Multi-stix, Frimley, Surrey, UK), and an aliquot removed for protein and creatinine determination using a Siemens Advia 1800 analyzer (Siemens) in the Blood Sciences Department, Leeds General Infirmary. After adjusting the pH to 7.0, samples were each divided into two and PI was added to one-half (one tablet per 25 mL urine). These two aliquots of each sample were then further subdivided as indicated (Fig. 1) to investi-gate the effects of processing times (immediate vs. 6 h delay) and temperature during the delay period (4⬚C vs. RT (in this case 20–22⬚C), prior to centrifugation at 2000×gfor 10 min, and removal and storage of the urine supernatant at−80⬚C until analysis.
2.3 Proteomic analysis
2.3.1 Sample concentration for analysis
Urine samples were thawed at RT and concentrated by cen-trifugal filtration according to the manufacturer’s instruc-tions and with starting volumes depending on the pro-tein concentration. For analysis by 2D-PAGE, 0.5–6.5 mL
of each sample was concentrated using Amicon 10 kDa MWCO Ultra-15 filtration units with the filtrate (150– 200 L), vacuum-centrifuged for 1.5 h, and the result-ing pellet was resuspended in DIGE lysis buffer (7 M urea, 2 M thiourea, and 4% w/v CHAPS). For analysis by SELDI, 0.1–1 mL of each sample was concentrated us-ing AmiconR 3 kDa MWCO Ultra 0.5 mL centrifugal
de-vices to a final volume of 100–200L. Protein concentra-tions were determined using the Bradford assay (Bio-Rad Laboratories).
2.3.2 SELDI-TOF-MS
Peptide profiling of the 60 urine samples was undertaken us-ing a SELDI-TOF mass spectrometer (ProteinChipR System,
series 4000, Ciphergen, Fremont, CA, USA) and Ciphergen ExpressTMClient software (v3.0) for data analysis.
IMAC30-Cu (immobilized metal affinity capture array with copper surface) ProteinChipTM arrays were selected for use
Figure 1. Schematic showing the study design. For immunoassay and SELDI, all ten samples each with six pro-cessing conditions were analyzed (for SELDI, 120 duplicate profiles were gen-erated). For 2D-PAGE, only six of the samples each with six processing con-ditions were used due to volume limi-tations and were analyzed in triplicate creating 108 gels.
2.3.3 2D-PAGE and protein identification
Samples A, B, D, E, G, and I (the remaining samples had insufficient volume/protein) were adjusted to 1.0 mg/mL protein concentration and labeled individually in triplicate with Cy5 (CyDye DIGE Fluor, minimal dye) as previously de-scribed [22]. Labeled samples (50g per strip) were separated by IEF using 24-cm pH 3–10NL Immobiline IPG strips prior to electrophoresis in the second dimension on 24-cm 10% polyacrylamide gels and fluorescence imaging. The major central forms of albumin were allowed to saturate in scan-ning, to improve the detection of lower abundance species, and excluded from downstream analysis; scans were normal-ized to the next most intense species in each image. Gel images were analyzed using Progenesis SameSpots software v4.5 (TotalLab, Newcastle-upon-Tyne, UK). QC analysis was first carried out on a run-by-run basis incorporating auto-mated image assessment in the “Image QC” module com-bined with further multivariate analyses and visual inspec-tion. Runs failing QC metrics were repeated and appropriate gels were selected for subsequent quantitative analyses. These were done separately for each sample, with the six handling conditions being compared in triplicate. Cropping, automatic reference gel selection, alignment, and spot detection were carried out, with manual correction where necessary. Spot
normalized volume data were then exported in .csv (comma-separated values) format for statistical analysis. To allow the different patterns to be related qualitatively for conservation of changes, a PG240 (TotalLab) experiment containing all the master reference maps was generated from the SameSpots archives and used to cross-match all the patterns.
2.3.4 Immunoassay of specific urinary proteins
The specific urinary proteins, 2-microglobulin (2M),␣1
-microglobulin (␣1M), IgG, and albumin, were determined by
the Protein Reference Unit at Sheffield Teaching Hospitals. Briefly,2M, IgG, and albumin were measured by
immuno-turbidimetry (Cobas Core, Roche Diagnostics, Burgess Hill, UK), and␣1M by immunonephelometry using the Behring
Nephelometric Analyzer II (Siemens). The LOD (and CV) for the specific protein assays was as follows:␣1M 2.0 mg/L (7%),
2M 0.2 mg/L (5%), albumin 3 mg/L (5%), and IgG 4 mg/L
(8%).
2.4 Statistical analysis
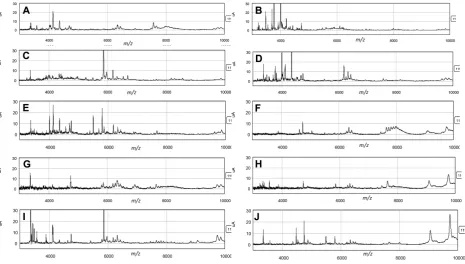
Figure 2. Representative examples of the SELDI profiles of each sample.
and Ward’s agglomeration method, for all data combined and separately for each urine sample condition.
The effect of PI addition and processing tempera-ture/delay on detected peaks from the SELDI-TOF spectra was evaluated using linear mixed effects model when consid-ering multiple patients and linear models when considconsid-ering individual patients. The linear mixed effect model can be represented through the equation:
yijkt=␣+xi+␥zt+␦xizt+j+ijkt
A separate model was fitted for each peak, and separate models were fitted for all samples, post-transplant samples, and benign urological disease samples. In the model for all samples, the response variable yijtk is the intensity value at
one peak cluster. Here,iindexes the inclusion of PI (+PI— reference level compared with−PI),jthe subject,kthe repeat number (since all combinations were run in duplicate), and
tthe processing temperature (−80⬚C—reference level com-pared with 4⬚C and RT). An interaction term in the model for PI inclusion and processing temperature was also included, that is a term that will indicate a departure from additive effects in the model. These are the fixed effects in the model. The random effectj in the model (j N(0,2))
de-scribes a subject-specific effect and allows for the correlation between peak intensities measured on the same subject. The final term describes the residual variation (ijktN(0,2)),
assumed to be uncorrelated with the other terms.
For each sample individually, linear models were considered. These models were fitted separately for each
peak and each sample and can be represented through the equation:
yikt=␣+xi+␥zt+␦xizt+j+ikt
As above,iindexes the inclusion of PI (+PI, reference level compared with−PI),kthe repeat number, andtthe process-ing temperature (−80⬚C, reference level compared with 4⬚C and RT). An interaction term in the model for PI inclusion and processing temperature was also included, again to indi-cate any departure from additive effects in the model. When examining fixed effects from the linear mixed effects and linear models, significance levels of 0.1% (p< 0.001) were considered significant as an ad hoc measure to control the false discovery rate. All analyses were undertaken in the R environment for statistical computing (R Development Core Team, Vienna) using the lmer() function in library(lme4) for the linear mixed effects models [23] and lm() for the linear models.
PI treatment opposed. This required a heterogeneity (p
0.05) across temperature groups for PI effect, and a typical (2-fold elevation or decrease in the linear model,p0.05) cut-off combination at RT, the group that would be expected to be most affected. Furthermore, a simple requirement of increasing divergence in mean fold change terms of−80⬚C< 4⬚C<RT was applied.
3
Results
3.1 Patient characteristics
Brief characteristics of the patients and their urinalysis results are shown in Table 1. Elevated results for many of the analytes are seen reflecting the different underlying disease processes and the intended heterogeneity of the samples used in this study.
3.2 Peptide and protein alterations
3.2.1 Peptide profiles (SELDI-TOF)
The profiles of the samples from different patients differed markedly (Fig. 2). Overall, 228 peaks were detected across
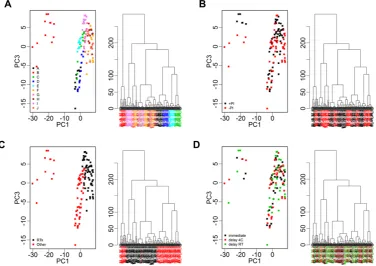
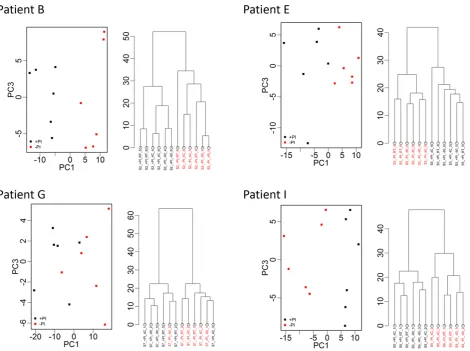
all samples combined with average peak numbers for differ-ent patidiffer-ents ranging from 156 (patidiffer-ent G) to 211 (patidiffer-ent A). Analysis of the CVs of all peaks in the pooled QC samples in-cluded on every chip showed a range of 23.5–109.4% with an overall median CV of 39.3%. PCA and hierarchical clustering analysis of data from all patient samples showed evidence of clustering predominantly by patient and also by broad clini-cal group (postrenal transplant or other; Fig. 3). No evidence of clustering on the basis of processing temperature/delay period or of technical analytical variables such as chip spot number was apparent, although some indication of clustering was seen on the basis of±PI and when data from individual patients were examined, samples were perfectly separated by PI status in three of the ten patients (B, E, and I; Fig. 4).
[image:6.595.58.435.390.656.2]Analysis of changes in specific peaks using lme and lm model results and using a cut-off peak intensity of>1, mini-mum fold difference of 2 (based on the technical variability), andp<0.001 compared with the “gold standard” condition of +PI/immediate processing (assumed to have least proteolysis) confirmed the exploratory data analysis results mentioned above. For example, the most pronounced effect was seen in patient J where 56 of 182 (30.7%) peaks changed between the immediate processing/+PI and delayed process-ing for 6 h at RT/−PI (this patient also showed the biggest fold changes in specific peaks as can be seen in Supporting
Figure 4. PCA (PC1 vs. PC3) and hierarchical clustering of proteomic profile obtained by SELDI considering samples from patients B, E, G, and I and replicate samples. Color coding represents addition of protease inhibitor (+PI/−PI) to a sample. There is clear separation in PCA and dendrograms by addition of protease inhibitor for three of the patients. Clear separation was not apparent when further examining plots related to other processing conditions.
Information Fig. 1A and B where peaks with fold-changes of 3 and 5 are shown, although few in number). This is in marked contrast to patients C, D, E, and G where nine peaks (1.2%) changed across all samples/conditions using the above criteria (Fig. 5A, Supporting Information Table 1). Interestingly, although samples from patient E clustered perfectly according to±PI (Fig. 4), the changes seen did not reach the above criteria (Fig. 5A), although if a less stringent cut-off of 1.5-fold change was applied, the ±PI effect started to become more apparent (Fig. 5B). This can be explained by other factors potentially interacting with the PI effects in some patient samples (e.g. J) and also it must be remembered that the first three principal components only explain on average 71% of the variance.
Although there were overlaps in the peaks affected, no consistent pattern was apparent across patients with the exception of the region of 6000–6600m/zwhere several peaks increased in the absence of PI in several patients (Fig. 5A and B, Supporting Information Table 1). Peak changes generally
m/z
A B C D E F G H I J
10000Da
3000Da
+PI, immediate −PI, immediate +PI, 4C −PI, 4C +PI, R
T
−PI, R
T
+PI, immediate −PI, immediate +PI, 4C −PI, 4C +PI, R
T
−PI, R
T
+PI, immediate −PI, immediate +PI, 4C −PI, 4C +PI, R
T
−PI, R
T
+PI, immediate −PI, immediate +PI, 4C −PI, 4C +PI, R
T
−PI, R
T
+PI, immediate −PI, immediate +PI, 4C −PI, 4C +PI, R
T
−PI, R
T
+PI, immediate −PI, immediate +PI, 4C −PI, 4C +PI, R
T
−PI, R
T
+PI, immediate −PI, immediate +PI, 4C −PI, 4C +PI, R
T
−PI, R
T
+PI, immediate −PI, immediate +PI, 4C −PI, 4C +PI, R
T
−PI, R
T
+PI, immediate −PI, immediate +PI, 4C −PI, 4C +PI, R
T
−PI, R
T
+PI, immediate −PI, immediate +PI, 4C −PI, 4C +PI, R
T
−PI, R
T
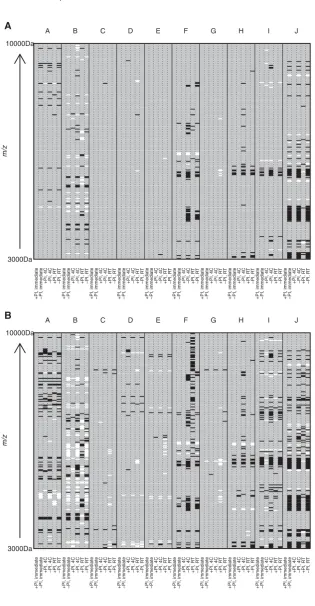
A
[image:8.595.56.372.65.672.2]B
Figure 5. Heatmaps showing statistically significant changes in SELDI peak in-tensity from “gold standard” processing condition (+PI/immediate processing). Pa-tients (A–J) are represented by columns with subcolumns representing each sam-ple processing condition (−PI/immediate processing or±PI delayed processing at 4⬚C or room temperature (20–22⬚C)). Rows represent SELDI peaks arranged bym/z ratio. Increases in peak intensity of (A) twofold or greater or (B) 1.5-fold or greater, which are significant atp<0.001, are rep-resented by black rectangles and similarly significant decreases in peak intensity are represented by white rectangles. Peakm/z values are provided in Supporting Infor-mation Table 1 for the twofold changes.
3.2.2 Protein profiles (2D-PAGE)
The numbers of spot features present in the final profile of each sample are provided in Table 2, and the reference image
Table 2. Results from the six 2D-PAGE intrapatient analyses showing the numbers of features detected in the final profile of each feature map, and the numbers of statistically significant alterations with each variable investigated according to the criteria in Section 2.4
Alterations Sample Conservation,
where examined
Aa) B Da) E G I
Features in profile 1117 878 1118 1219 949 1209
Target (i)
PI elevated 9 3 2 18 9 30
Conserved in at least three samples 0
Conserved in at least three different individuals 0
PI reduced 24 23 10 28 39 19
Conserved in at least three samples 5
Conserved in at least three different individuals 4
PI total 33 26 12 46 48 49
Target (ii)
4⬚C elevated 2 19 7 15 5 4
Conserved in at least three samples 0
Conserved in at least three different individuals 0
4⬚C reduced 2 3 2 16 1 12
Conserved in at least three samples 0
Conserved in at least three different individuals 0
4⬚C total 4 22 9 31 6 16
RT elevated 10 9 4 11 1 3
Conserved in at least three samples 0
Conserved in at least three different individuals 0
RT reduced 12 6 9 23 2 13
Conserved in at least three samples 1
Conserved in at least three different individuals 0
RT total 22 15 13 34 3 16
Elevation, both temps 0 0 1 2 0 0
Reduction, both temps 0 0 2 11 0 5
Target (i) and (ii) combination
PI and 4⬚C (any direction) 0 0 1 11 0 6
PI and RT (any direction) 0 1 1 15 2 11
Target (iii)
PI versus non-PI heterogeneity analysis—elevated with PI 0 0 0 2 0 0 None conserved
across patients
PI versus non-PI heterogeneity analysis—reduced with PI 0 0 2 5 10 1 None conserved
across patients
PI versus non-PI heterogeneity analysis—total 0 0 2 7 10 1 None conserved
across patients As standard these were a2-fold change in the linear model, withp0.05. For the heterogeneity analyses, three criteria were applied in the second linear model. The heterogeneitypvalue was 0.05 or less, there was a significant change with PI in the RT group by normal cut-offs, and the mean fold change rose in the order−80⬚C<4⬚C<RT.
a) A and D are treated as two patients but represent two samples taken from the same patient 1 wk apart.
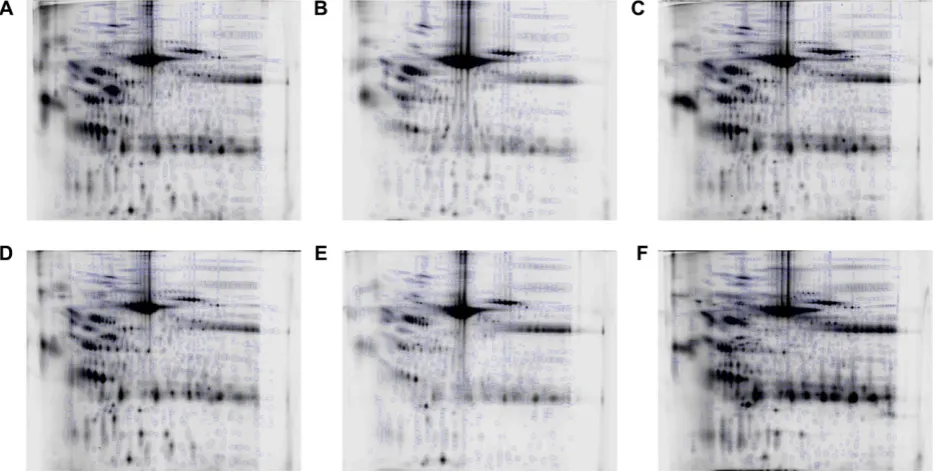
necessary to investigate processing effects. Although the pro-files between patients were grossly similar (Fig. 6), especially the repeat-sampled A and D, there were many differences in moderate to low abundance species between patients, meaning that a key assumption of 2DE analysis, that most species present remain unaltered, would have potentially been violated in a single analysis comparing all the samples. To illustrate this, such an analysis was additionally carried out, using the six aligned image sets and cross-aligning them further via their reference gels using visually conserved pro-teins as landmarks, to align all 108 gels. Plotting the first two principal components in SameSpots showed that interpatient variation overwhelmingly dominated the separation with no
Figure 6. The reference image from each patient with the final spot pattern superimposed. (A) Patient A; (B) patient B; (C) patient D; (D) patient E; (E) patient G; (F) patient I.
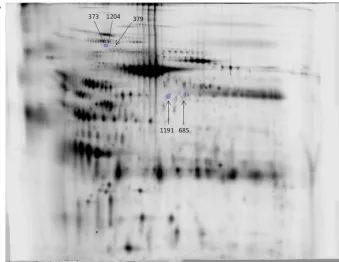
The numbers of proteins altered with processing within each sample by the criteria described in Section 2.4 are sum-marized in Table 2. While there were alterations with PI and temperature in each sample and more species appeared with the omission of PI than with its inclusion, the changes were very small in number, few were conserved, and any temperature-associated alterations were quite different be-tween 4⬚C and RT, at least at the cut-offs used, which may reflect gradation. The five most conserved protein changes with PI are shown in Fig. 8. Attempts to identify the proteins associated with conserved PI-induced changes were unsuc-cessful, presumably due to low abundance as they were not visible on preparatory gels. There were no conserved species altered across samples showing an increasing effect of PI with temperature.
3.2.3 Specific proteins
Although there were marked differences in the concentra-tions of the specific proteins,2M,␣1M, IgG, and albumin,
between samples from the different patients, no significant differences (p<0.05) were detected between the different processing conditions (Supporting Information Table 2).
4
Discussion
Progress is being made in biomarker discovery stud-ies through exploitation of the various technological
developments in MS in particular, coupled with an increasing realization that the impact of pre-analytical variables in clini-cal proteomic studies can be criticlini-cal [13]. Urine is increasingly being used in biomarker studies and even without superim-posed pathological changes, its composition varies consider-ably physiologically due to factors such as diet, timing, exer-cise, gender, and age [1–3]. This is also illustrated through a recent LC-MS/MS analysis examining urine samples from seven individuals over 3 days where in>600 identified pro-teins, the technical variability with a median CV of 18% was far less than that of the intra- and interindividual variability at 48 and 66%, respectively [24]. As discussed further below, our study also shows marked differences in protein and pep-tide profiles between samples from different individuals, even within similar disease groupings, illustrating the challenges of biomarker discovery in cross-sectional comparisons where even “background” variability is so high. Although careful patient matching may help, it is likely that longitudinal com-parisons of samples matched within patients, for example pre- and postremoval removal of a cancer, may overcome such background heterogeneity and lead to more easily iden-tifiable disease-related changes.
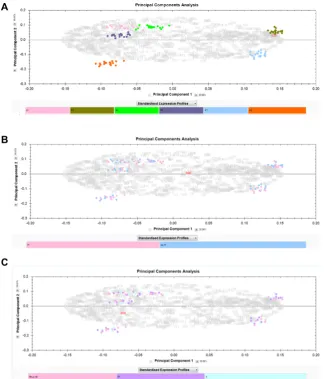
Figure 7. PCA of all 108 gels in a single SameSpots experiment, generated within the software and showing the first two eigenvectors in each case. The color key is below each plot. (A) All 108 samples col-ored by patient (pink=A, olive=B, green= D, mid-blue=E, light blue=G, orange= I); (B) by PI status; (C) by temperature. The first two components cumulatively explain 49.57% of the total variance.
necessary for proteinuric urine samples (with further eval-uation planned), but not for normal urine samples (http:// www.hkupp.org/Urine%20collectiion%20Documents.htm) and storage can be either at−20 or−80⬚C. The exception is where exosome analysis is involved when PI addition is advo-cated and this is also the case on the EuroProt website describ-ing protocols for urinary exosome analysis (http://www3. niddk.nih.gov/intramural/UroProt/collection-storage.shtml), together with storage at−80⬚C with significant reductions in recovery of exosomal proteins being reported after 7 months of storage at−20⬚C [25].
In our study, the changes in proteins as analyzed by 2D-PAGE were insignificant in number and did not appear to be more prevalent in any particular set of conditions. This is also in agreement with most previous studies at the protein level, although some are quite limited in scope. Using SDS-PAGE followed by LC-MS/MS to analyze urine from a healthy con-trol left at RT for 0, 4, 8, and 24 h, no significant differences were found in terms of the numbers of proteins detected or mean normalized spectral counts when the 200 most abun-dant proteins were examined in groups of 50 [16]. Similarly by
Figure 8. (A) The five “most con-served” changes altered with PI in-dependently of temperature accord-ing to the standard cut-offs in more than one sample. The numbers as-signed are those from the mas-ter PG240 matching patmas-tern with changes in spots 373, 379, 685, 1191, and 1204 being conserved in four, three, three, three, four samples, re-spectively, and all increased in the absence of PI. The image is of sam-ple E at−80⬚C,+PI gel.
6–8 months found creatinine to be stable but NAG, albumin, and retinol-binding protein were underestimated following storage at−20⬚C, with marked interindividual variation and 36% of samples being substantially affected [27]. Examination of albumin specifically, in various pathological urine samples stored for 12 months, also found marked degradation in 11 of 40 samples stored at−20⬚C compared with −70⬚C [28]. Adjustment of the pH to 2.3–2.5 resulted in rapid albumin degradation consistent with pepsin-type proteolytic activity and adjustment of pH to neutral and/or addition of PI was recommended [28].
Although not extensive and patient-dependent (but consistent within individual patients), our study found more marked changes in peptides, probably reflecting the relative impacts of proteolysis with partial degradation of a protein spot being amplified in terms of the resultant peptide peaks detected against a low background. It is possible that some of the differences±PI may have occurred not during the pro-cessing period per se as part of a continuous process but dur-ing subsequent storage at−80⬚C prior to analysis. In the case of SELDI, the period of storage was approximately 3 months and for the 2D PAGE analysis result, it was2 years. How-ever, we consider this to be the less likely explanation and this is supported partly by the slightly lower number of peaks affected in some of the immediately processed (30 min) samples without PI compared with those delayed for 6 h. Intuitively, as urine is stored in the bladder, much of the pro-teolysis would have expected to occur prior to voiding even, which cannot be prevented and in fact which presumably underlies the disease-specific signatures of urinary peptides
Figure 8. Continued. (B)–(F) Features shown across the groups, in one gel from each condition of the samples that demonstrated an alteration in each feature, respectively: (B) 373 in E; (C) 1204 in E; (D) 379 in A; (E) 1191 in D; (F) 685 in D.
Examining much smaller numbers of peptide peaks by MALDI/SELDI has shown some processing-related effects with storage at 4⬚C prior to freezing resulting in small numbers of changes [11, 18] and changes in normal urine peptide profiles after 6 h at 25⬚C compared with 4⬚C [33] with marked interindividual variation. Interestingly, first-void urine (but not midstream) showed considerable changes fol-lowing 3 days storage at both 4⬚C and RT, with new peaks
of PI, particularly at RT. The components of the commercial PI cocktail are proprietary but of the four major classes of pro-teolytic enzymes (serine, cysteine, metallo-, and aspartic), it is aimed at inhibition of cysteine and serine proteases. Given that the pH of all samples was adjusted to neutral to avoid precipitation [35], it is unlikely that aspartic proteases that are active at acidic pH are responsible for any of the changes in peptides we have seen in the presence or absence of PI. However, the PI cocktail is EDTA-free to avoid issues with the IMAC chemistry and therefore matrix-metalloproteinases may account for some of the peptide changes. Certainly, ex-amples of various matrix metalloproteinases and their com-plexes have been reported in urine in a variety of diseases including urinary tract infection, post-renal transplantation with either acute/chronic rejection or fibrosis, and diabetes [36–40]. The differences in peaks affected in the presence and absence of PI, although there is some overlap, are likely to reflect the differing patterns of activity/inhibition of the var-ious contributing proteases and therefore different peptide masses. Unfortunately, the identities of the peptides could not be determined, which is a major limitation of the SELDI platform and which has precluded our modeling of possible proteases involved [29].
Control of analytical and pre-analytical variables is crucial for the success of urine analysis, in order to obtain meaningful and reproducible data, even if the interpatient variability is difficult to avoid. The development of universal standard operating procedures for sample collection and handling is a complex task that will require shared expe-rience and expertise, but this would better facilitate the future adoption of clinical proteomics into routine hospital practice.
Overall, our assessment of the impact of processing de-lays and addition of PIs to urine peptide and protein analysis has demonstrated that the dominant effects are the inter-individual variability and underlying pathology. Processing-related changes to proteins were minimal and although more marked, changes to peptides in the absence of PIs were very sample-dependent, with many samples exhibiting no appar-ent degradation. We would advocate the use of PI where pos-sible due to the unpredictability of proteolytic activity within samples but pragmatically, particularly for peptides, this must be balanced against the contributions of such activity to any diagnostic models. The most critical aspect is the adoption of consistent protocols within studies, their description within published studies, and the incorporation into any biomarker validation studies of investigations of potential impact of sam-ple handling processes.
The authors thank the patients who provided the urine sam-ples used in this study, the staff of the Renal Medicine Unit and Urology Dept. at St. James’s who assisted in patient recruitment, the sample processing team within the Proteomics Group, and the Sheffield Protein Reference Unit for specific protein measure-ment. The financial support of the Yorkshire Kidney Research Fund, MRC, and the Leeds Teaching Hospitals NHS and
Tech-nology Strategy Board through a Knowledge Transfer Partnership is gratefully acknowledged.
The authors have declared no conflict of interest.
5
References
[1] Decramer, S., de Peredo, A. G., Breuil, B., Mischak, H. et al., Urine in clinical proteomics.Mol. Cell. Proteomics2008,7, 1850–1862.
[2] Thongboonkerd, V., Practical points in urinary proteomics. J. Proteome Res.2007,6, 3881–3890.
[3] Konvalinka, A., Scholey, J. W., Diamandis, E. P., Searching for new biomarkers of renal diseases through proteomics. Clin. Chem.2012,58, 353–365.
[4] Shariat, S. F., Karam, J. A., Raman, J. D., Urine cytology and urine-based markers for bladder urothelial carcinoma detec-tion and monitoring: developments and future prospects. Biomarkers Med.2008,2, 165–180.
[5] Kentsis, A., Monigatti, F., Dorff, K., Campagne, F. et al., Urine proteomics for profiling of human disease using high ac-curacy mass spectrometry.Proteomics Clin. Appl.2009,3, 1052–1061.
[6] Coon, J. J., Zurbig, P., Dakna, M., Dominiczak, A. F. et al., CE-MS analysis of the human urinary proteome for biomarker discovery and disease diagnostics.Proteomics Clin. Appl. 2008,2, 964–973.
[7] Siwy, J., Schanstra, J. P., Argiles, A., Bakker, S. J. et al., Multi-centre prospective validation of a urinary peptidome-based classifier for the diagnosis of type 2 diabetic nephropathy. Nephrol. Dial. Transplant2014,29, 1563–1570.
[8] Court, M., Selevsek, N., Matondo, M., Allory, Y. et al., To-ward a standardized urine proteome analysis methodology. Proteomics2011,11, 1160–1171.
[9] Afkarian, M., Bhasin, M., Dillon, S. T., Guerrero, M. C. et al., Optimizing a proteomics platform for urine biomarker dis-covery.Mol. Cell. Proteomics2010,9, 2195–2204.
[10] Good, D. M., Zurbig, P., Argiles, A., Bauer, H. W. et al., Nat-urally occurring human urinary peptides for use in diagno-sis of chronic kidney disease.Mol. Cell. Proteomics2010,9, 2424–2437.
[11] Calvano, C. D., Aresta, A., Iacovone, M., De Benedetto, G. E. et al., Optimization of analytical and pre-analytical con-ditions for MALDI-TOF-MS human urine protein profiles.J. Pharm. Biomed. Anal.2010,51, 907–914.
[12] Havanapan, P.-O., Thongboonkerd, V., Are protease in-hibitors required for gel-based proteomics of kidney and urine?J. Proteome Res.2009,8, 3109–3117.
[13] Jackson, D. H., Banks, R. E., Banking of clinical samples for proteomic biomarker studies: a consideration of logistical issues with a focus on pre-analytical variation.Proteomics Clin. Appl.2010,4, 250–270.
[15] Thomas, C. E., Sexton, W., Benson, K., Sutphen, R., Koomen, J., Urine collection and processing for protein biomarker discovery and quantification.Cancer Epidemiol. Biomarkers Prev.2010,19, 953–959.
[16] Lee, R. S., Monigatti, F., Briscoe, A. C., Waldon, Z. et al., Opti-mizing sample handling for urinary proteomics.J. Proteome Res.2008,7, 4022–4030.
[17] Waikar, S. S., Betensky, R. A., Bonventre, J. V., Creatinine as the gold standard for kidney injury biomarker studies? Nephrol. Dial. Transpl.2009,24, 3263–3265.
[18] Petri, A. L., Hogdall, C., Christensen, I. J., Simonsen, A. H. et al., Sample handling for mass spectrometric proteomic investigations of human urine.Proteomics Clin. Appl.2008, 2, 1184–1193.
[19] Papale, M., Pedicillo, M. C., Thatcher, B. J., Di Paolo, S. et al., Urine profiling by SELDI-TOF/MS: monitoring of the critical steps in sample collection, handling and analysis.J. Chro-matog. B2007,856, 205–213.
[20] Banks, R. E., Stanley, A. J., Cairns, D. A., Barrett, J. H. et al., Influences of blood sample processing on low-molecular-weight proteome identified by surface-enhanced laser des-orption/ionization mass spectrometry.Clin. Chem.2005,51, 1637–1649.
[21] Thompson, D., Develter, W., Cairns, D. A., Barrett, J. H. et al., A pilot study to investigate the potential of mass spectrom-etry profiling in the discovery of novel serum markers in chronic renal disease.Proteomics Clin. Appl.2011,5, 523– 531.
[22] Welberry Smith, M. P., Wood, S. L., Zougman, A., Ho, J. T. et al., A systematic analysis of the effects of increasing de-grees of serum immunodepletion in terms of depth of cov-erage and other key aspects in top-down and bottom-up proteomic analyses.Proteomics2011,11, 2222–2235. [23] Bates, D., Maechler, M., Bolker, B., Walker, S., Ime4: linear
mixed-effects models using Eigen and S4.R package version 1.1-5.
[24] Nagaraj, N., Mann, M., Quantitative analysis of the intra- and inter-individual variability of the normal urinary proteome. J. Proteome Res.2011,10, 637–645.
[25] Zhou, H., Yuen, P. S. T., Pisitkun, T., Gonzales, P. A. et al., Col-lection, storage, preservation, and normalization of human urinary exosomes for biomarker discovery.Kidney Int.2006, 69, 1471–1476.
[26] Parikh, C. R., Butrymowicz, I., Yu, A., Chinchilli, V. M. et al., Urine stability studies for novel biomarkers of acute kidney injury.Am. J. Kidney Dis.2014,63, 567–572.
[27] Schultz, C. J., Dalton, R. N., Turnert, C., Neil, H. A. W., Dunger, D. B., Freezing method affects the concentration and vari-ability of urine proteins and the interpretation of data on microalbuminuria.Diabet. Med.2000,17, 7–14.
[28] Kania, K., Byrnes, E. A., Beilby, J. P., Webb, S. A., Strong, K. J., Urinary proteases degrade albumin: implications for
measurement of albuminuria in stored samples.Ann. Clin. Biochem.2010,47, 151–157.
[29] Filip, S., Pontillo, C., Peter Schanstra, J., Vlahou, A. et al., Urinary proteomics and molecular determinants of chronic kidney disease: possible link to proteases.Expert Rev. Pro-teomics2014, 1–14.
[30] Schuchard, M. D., Mehigh, R. J., Cockrill, S. L., Lip-scomb, G. T. et al., Artifactual isoform profile modifi-cation following treatment of human plasma or serum with protease inhibitor, monitored by 2-dimensional elec-trophoresis and mass spectrometry.BioTechniques2005,39, 239–247.
[31] Mischak, H., Vlahou, A., Ioannidis, J. P., Technical as-pects and inter-laboratory variability in native peptide pro-filing: the CE-MS experience. Clin. Biochem. 2013, 46, 432–443.
[32] Theodorescu, D., Wittke, S., Ross, M. M., Walden, M. et al., Discovery and validation of new protein biomarkers for urothelial cancer: a prospective analysis.Lancet Oncol.2006, 7, 230–240.
[33] Fiedler, G. M., Baumann, S., Leichtle, A., Oltmann, A. et al., Standardized peptidome profiling of human urine by mag-netic bead separation and matrix-assisted laser desorp-tion/ionization time-of-flight mass spectrometry.Clin. Chem. 2007,53, 421–428.
[34] Schaub, S., Wilkins, J., Weiler, T., Sangster, K. et al., Urine protein profiling with surface-enhanced laser-desorption/ionization time-of-flight mass spectrometry. Kid-ney Int.2004,65, 323–332.
[35] Townsend, J. C., Sadler, W. A., Shanks, G. M., The ef-fect of storage pH on the precipitation of proteins in deep frozen urine samples.Ann. Clin. Biochem. 1987,24, 111– 112.
[36] Hatipoglu, S., Sevketoglu, E., Gedikbasi, A., Yilmaz, A. et al., Urinary MMP-9/NGAL complex in children with acute cysti-tis.Pediatr. Nephrol.2011,26, 1263–1268.
[37] Wong, W., DeVito, J., Nguyen, H., Sarracino, D. et al., Chronic humoral rejection of human kidney allografts is associated with MMP-2 accumulation in podocytes and its release in the urine.Am. J. Transplant.2010,10, 2463–2471.
[38] Metzger, J., Chatzikyrkou, C., Broecker, V., Schiffer, E. et al., Diagnosis of subclinical and clinical acute T-cell-mediated rejection in renal transplant patients by urinary proteome analysis.Proteomics Clin. Appl.2011,5, 322–333.
[39] Caseiro, A., Ferreira, R., Quintaneiro, C., Pereira, A. et al., Protease profiling of different biofluids in type 1 diabetes mellitus.Clin. Biochem.2012,45, 1613–1619.