R E S E A R C H A R T I C L E
Open Access
Procedure-based severity index for
inpatients: development and validation
using administrative database
Hayato Yamana
1,2, Hiroki Matsui
1, Kiyohide Fushimi
3and Hideo Yasunaga
1*Abstract
Background:Risk adjustment is important in studies using administrative databases. Although utilization of diagnostic and therapeutic procedures can represent patient severity, the usability of procedure records in risk adjustment is not well-documented. Therefore, we aimed to develop and validate a severity index calculable from procedure records.
Methods:Using the Japanese nationwide Diagnosis Procedure Combination database of acute-care hospitals, we identified patients discharged between 1 April 2012 and 31 March 2013 with an admission-precipitating diagnosis of acute myocardial infarction, congestive heart failure, acute cerebrovascular disease, gastrointestinal hemorrhage, pneumonia, or septicemia. Subjects were randomly assigned to the derivation cohort or the validation cohort. In the derivation cohort, we used multivariable logistic regression analysis to identify procedures performed on admission day which were significantly associated with in-hospital death, and a point corresponding to regression coefficient was assigned to each procedure. An index was then calculated in the validation cohort as sum of points for performed procedures, and performance of mortality-predicting model using the index and other patient characteristics was evaluated.
Results:Of the 539 385 hospitalizations included, 270 054 and 269 331 were assigned to the derivation and validation cohorts, respectively. Nineteen significant procedures were identified from the derivation cohort with points ranging from−3 to 23, producing a severity index with possible range of−13 to 69. In the validation cohort, c-statistic of mortality-predicting model was 0.767 (95 % confidence interval: 0.764–0.770). Theω-statistic representing contribution of the index relative to other variables was 1.09 (95 % confidence interval: 1.03–1.17).
Conclusions:Procedure-based severity index predicted mortality well, suggesting that procedure records in administrative database are useful for risk adjustment.
Keywords:Administrative data, Mortality, Risk adjustment, Severity
Background
Risk adjustment is an important component in clinical epidemiology and health services research using adminis-trative databases, but its methods remain controversial. Administrative databases are widely used in studies be-cause of their availability and large sample sizes, and risk-adjusted mortality is employed as one of the outcome measures. However, the validity of risk-adjustment models
for administrative data has been questioned repeatedly [1–4]. It has been argued that administrative data lack important clinical information [5–8] and often do not make distinctions between conditions present on admis-sion and complications occurring during hospitalization [6–10]. Inadequate risk adjustment can lead to misleading consequences such as confounding by indications and low rating of facilities that care for sicker patients. Thus, appropriate risk-adjustment models are desired.
Previous studies have shown that the performance of risk-adjustment models using administrative databases improves when detailed clinical information is added. In * Correspondence:[email protected]
1Department of Clinical Epidemiology and Health Economics, School of Public Health, The University of Tokyo, 7-3-1 Hongo, Bunkyo-ku, Tokyo 113-0033, Japan
Full list of author information is available at the end of the article
addition to patients’ demographic characteristics, comor-bid illnesses recorded in administrative data enabled risk adjustment using measures such as the Charlson comor-bidity index (CCI) [11]. Furthermore, models using labora-tory data, vital signs, and other clinical findings provided better predictions of mortality [12–15], and models using disease-specific diagnostic tests and treatments have been introduced for some diseases [16–19]. Mean-while, precise laboratory and clinical data are not avail-able in most administrative databases. Therefore, an alternative method has been reported, in which surger-ies and major therapeutic procedures are associated with in-hospital death [20].
In addition to major therapeutic procedures, commonly performed procedures, diagnostic or therapeutic, can reflect the severity of patients on admission. For ample, patients who receive oxygen therapy are ex-pected to be in a severe condition compared with those who do not. However, there have been no evalu-ations of risk-adjustment models that use commonly performed procedures. In addition, previous models using laboratory and clinical data were developed and validated in limited regions.
The aims of the present study were to develop an index of severity using procedure records in a nation-wide database, and to examine the ability of this index to predict in-hospital death.
Methods
Data source
The Diagnosis Procedure Combination database is a national administrative database of acute-care inpa-tients in Japan that is linked with a payment system. The mandatory-participating academic hospitals (all 82 hospitals) and voluntary-participating community hospitals provide claims data of all of their acute-care inpatients. In 2012, there were approximately 1,000 participating hospi-tals with 7 million admissions recorded annually, repre-senting 50 % of all acute-care hospitalizations in Japan.
The database includes the following data: hospital identification code; patient demographics; diagnoses; ad-mission and discharge status; surgeries and procedures performed; drugs used; and special reimbursements for specific conditions. Up to 12 diagnoses for each admis-sion are recorded, and coded using the International Classification of Diseases,Tenth Revision (ICD-10). One diagnosis each is recorded for “main diagnosis,” “admis-sion-precipitating diagnosis,” “most resource-consuming diagnosis,” and “second most resource-consuming diag-nosis.” A maximum of four diagnoses each are recorded for “comorbidities present on admission” and “condi-tions arising after admission.” Suspected diagnoses are allowed to be recorded, in which case they are desig-nated as such. Surgeries, drugs, procedures, and special
reimbursements are coded according to the Japanese fee schedule for reimbursement [21], and their dates of use or application are recorded. The daily quantities of each drug administered are also recorded.
Study cohort
We included all adult patients (≥18 years) discharged be-tween 1 April 2012 and 31 March 2013 with a confirmed admission-precipitating diagnosis of acute myocardial infarction, congestive heart failure, acute cerebrovascular disease, gastrointestinal hemorrhage, pneumonia, or septi-cemia. The identification of these six diseases was based on the Classifications Software for Mortality Reporting de-veloped by the Healthcare Cost and Utilization Project [22], and the following Classifications Software categories were used for the six diseases, respectively: 100, 108, 109, 153, 122, and 2. For congestive heart failure, we also included hypertensive heart disease with heart failure (ICD-10 code: I11.0, I13.0, or I13.2). We excluded the following patients based on their information on the day of admission: those who were admitted to intensive care unit (including coronary care unit); and those who received cardiopulmonary life support (cardiopulmonary resusci-tation, electrical cardioversion, cardiopulmonary bypass, extracorporeal membrane oxygenation, or ventricular as-sist device). We identified the former using reimbursement information, and the latter using procedure information.
The data for diagnostic and therapeutic procedures performed on the day of admission, use of catechol-amines (epinephrine, norepinephrine, dopamine, and do-butamine) and vasopressin on the day of admission, and use of blood transfusions (red blood cells, platelets, fresh frozen plasma, and albumin) on the day of admission were extracted. A list of the procedures and codes exam-ined in this study is shown in the Additional file 1. For the examinations, examples of the tested items are also listed. Patients who underwent at least one procedure categorized under a given code were assigned that spe-cific code. For example, “D007, blood chemistry tests” would be coded for patients who underwent creatinine testing, as well as for patients who underwent sodium, potassium, and chloride testing. Comorbidities were ex-amined using the diagnoses recorded as comorbidities present on admission, and CCI values were calculated using the coding algorithm [23] and weight assignment [24] reported by Quan et al.
We randomly assigned the eligible patients to the der-ivation cohort or validation cohort. We developed the severity index for inpatients using the derivation cohort, and tested its performance in the validation cohort.
Index development
of catecholamines and vasopressin) on the day of ad-mission. For each procedure with ≥1 % prevalence, the chi-square test was used to evaluate the association with in-hospital death. The procedures positively asso-ciated with in-hospital death (P< 0.1) were retained for further analysis. Procedures with a correlation (phi co-efficient >0.6) were managed in the following manner: (i) a group of procedures usually performed simultan-eously were combined into a single variable as at least one procedure; and (ii) for a group of procedures performed consecutively, only the procedure usually performed first was retained. Subsequently, a logistic regression model was developed with in-hospital death as the outcome vari-able. In the model, the admission-precipitating diagnosis, age, sex, and CCI were included as categorical covariates (age categories: <60, 60–69, 70–79, 80–89, ≥90; CCI categories: 0, 1, 2,≥3) in addition to the procedures.
Using the statistically significant (P< 0.05) regression coefficients obtained with the model, we derived an index-calculating formula by the method of Sullivan et al. [25], using CCI = 1 as a reference. Specifically, a point was assigned to each procedure so that it equaled the integer nearest to the quotient of the regression cient for the procedure divided by the regression coeffi-cient for CCI = 1. Thus, the points for each procedure were derived to represent the effect on death relative to the CCI. The severity index for each patient could then be calculated as the sum of the points assigned to the proce-dures performed on the patient.
Index validation
The severity index was calculated for patients in the valid-ation cohort. We examined the distribution of its values, and used a logistic regression model with the index as a continuous variable (model 1) to examine its association with in-hospital death. For every value, the expected death rate among patients with the value was compared with the observed death rate.
We then constructed multiple logistic regression models with different independent variables: severity index, diag-nosis, age, and sex (model 2); diagdiag-nosis, age, sex, and CCI (model 3); severity index, diagnosis, age, sex, and CCI (model 4). The discriminatory abilities of the different models were assessed using the c-statistics. We used the integrated discrimination improvement (IDI) [26] to evaluate the improvement of model discrimination by adding the severity index. The IDI is a difference in the discrimination slope (difference between the mean predicted probability of an event for those with events and the corresponding mean predicted probability of an event for those without events) between two models and is a measure of the improvement in model perform-ance. In this study, the IDI was calculated for a compari-son of model 4 with model 3.
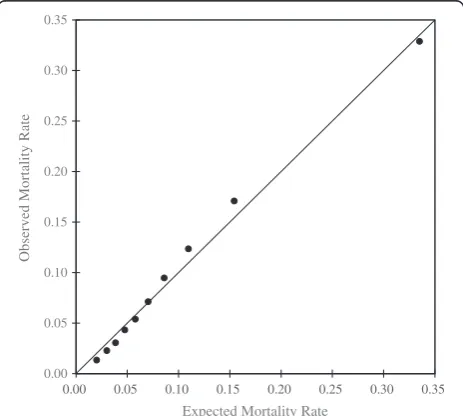
We evaluated the relative contribution of the severity index to the prediction of death using the ω-statistic [27]. The ω-statistic is the ratio of the variances of the contributions of two groups of variables to the log-odds of the outcome in a logistic regression model. In this study, we used model 4, and compared the relative con-tribution of the severity index with that of four other variables. In addition, the calibration of model 4 was evaluated using the Hosmer–Lemeshow decile partition.
We conducted further analyses to test the perform-ance of the severity index across various subgroups of patients. Using the severity index derived from all pa-tients in the derivation cohort, model 4 was constructed for the following subgroups of the validation cohort: those who arrived in an ambulance and those who did not; those who were referred by another institution and those with no referral. We also built models for each admission-precipitating diagnosis, with severity index, age, sex, and CCI as independent variables. The model discrimination and calibration were evaluated for each subgroup.
TheP values were 2 sided. Statistical analyses were per-formed using IBM SPSS for Windows, version 22.0 (IBM Corp., Armonk, NY, USA). Because of the anonymous nature of the data, the need for informed consent was waived. Study approval was obtained from the Institu-tional Review Board of The University of Tokyo.
Results
Patient characteristics
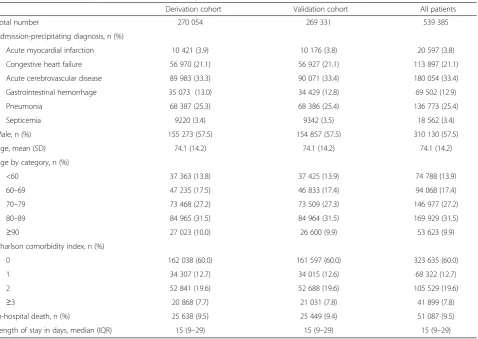
We identified 604,579 adult patients with one of the six diseases as the admission-precipitating diagnosis during the study period. Of these patients, 65,194 were excluded because of intensive care unit admission (n= 59,995) or cardiopulmonary life support (n= 7,019) on the day of admission, leaving 539,385 patients for analysis. For these patients, the mean age was 74.1 years, 57.5 % were male, and the in-hospital mortality rate was 9.5 %. The background characteristics of all patients, patients assigned to the derivation cohort (n= 270,054), and pa-tients assigned to the validation cohort (n= 269,331) are presented in Table 1. The characteristics were simi-lar between the two cohorts.
Index development
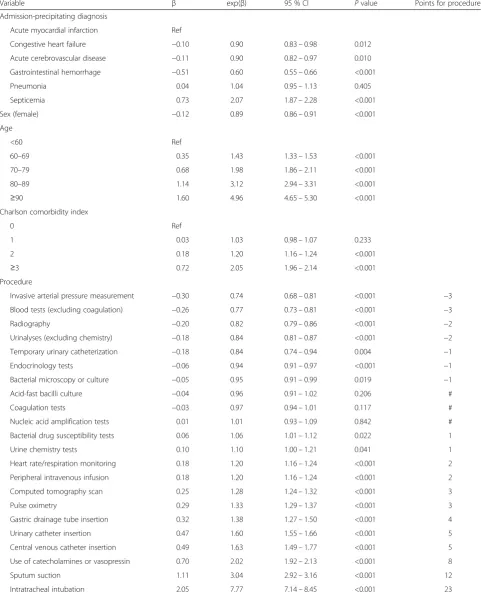
(bacterial microscopy, bacterial culture) were combined as blood tests (excluding coagulation), urinalyses (ex-cluding chemistry), and bacterial microscopy or culture, respectively. Thus, for example,“blood tests (excluding coagulation)” would be counted for patients who under-went sodium, potassium, and hemoglobin testing, as well as for patients who underwent C-reactive protein testing. Central venous infusion and oxygen administration were respectively correlated with central venous catheter insertion and pulse oximetry, which logically precede each procedure. Therefore, central venous catheter insertion and pulse oximetry were retained, while central venous in-fusion and oxygen administration were excluded from the analysis. The 22 candidate variables were then entered into a logistic regression model, the results of which are presented in Table 3. There were seven procedure vari-ables significantly associated with decreased risk of death, and twelve procedure variables significantly associated with increased risk of death. Because CCI = 1 was not significantly associated with increased odds of death, we divided the regression coefficient for CCI = 2 (0.182)
by two to obtain an estimate for the coefficient for CCI = 1 and used it as a reference. The points assigned to each procedure are also presented in Table 3.
Index performance
The severity index calculated for patients in the validation cohort ranged from−12 to 62, with a mean of 2.13 (stand-ard deviation: 6.85). The distribution of the index values in the validation cohort is presented in Fig. 1. The values with small numbers of patients were grouped to include at least 1 % of the patients. The observed death rates for the values and their 95 % confidence intervals (CI) and the ex-pected death rates are also presented.
[image:4.595.61.540.98.437.2]The c-statistics for models 1, 2, 3, and 4 were 0.701 (95 % CI: 0.698, 0.705), 0.758 (95 % CI: 0.755, 0.761), 0.675 (95 % CI: 0.672, 0.679), and 0.767 (95 % CI: 0.764, 0.770), respectively. The IDI for the comparison of model 4 with model 3 was 0.0700 (95 % CI: 0.0682, 0.0719), representing improved discrimination in model 4. The ω-statistic in model 4 was 1.09 (95 % CI: 1.03, 1.17), representing a slightly larger contribution of the Table 1Characteristics of patients included in the study
Derivation cohort Validation cohort All patients
Total number 270 054 269 331 539 385
Admission-precipitating diagnosis, n (%)
Acute myocardial infarction 10 421 (3.9) 10 176 (3.8) 20 597 (3.8)
Congestive heart failure 56 970 (21.1) 56 927 (21.1) 113 897 (21.1)
Acute cerebrovascular disease 89 983 (33.3) 90 071 (33.4) 180 054 (33.4)
Gastrointestinal hemorrhage 35 073 (13.0) 34 429 (12.8) 69 502 (12.9)
Pneumonia 68 387 (25.3) 68 386 (25.4) 136 773 (25.4)
Septicemia 9220 (3.4) 9342 (3.5) 18 562 (3.4)
Male, n (%) 155 273 (57.5) 154 857 (57.5) 310 130 (57.5)
Age, mean (SD) 74.1 (14.2) 74.1 (14.2) 74.1 (14.2)
Age by category, n (%)
<60 37 363 (13.8) 37 425 (13.9) 74 788 (13.9)
60–69 47 235 (17.5) 46 833 (17.4) 94 068 (17.4)
70–79 73 468 (27.2) 73 509 (27.3) 146 977 (27.2)
80–89 84 965 (31.5) 84 964 (31.5) 169 929 (31.5)
≥90 27 023 (10.0) 26 600 (9.9) 53 623 (9.9)
Charlson comorbidity index, n (%)
0 162 038 (60.0) 161 597 (60.0) 323 635 (60.0)
1 34 307 (12.7) 34 015 (12.6) 68 322 (12.7)
2 52 841 (19.6) 52 688 (19.6) 105 529 (19.6)
≥3 20 868 (7.7) 21 031 (7.8) 41 899 (7.8)
In-hospital death, n (%) 25 638 (9.5) 25 449 (9.4) 51 087 (9.5)
Length of stay in days, median (IQR) 15 (9–29) 15 (9–29) 15 (9–29)
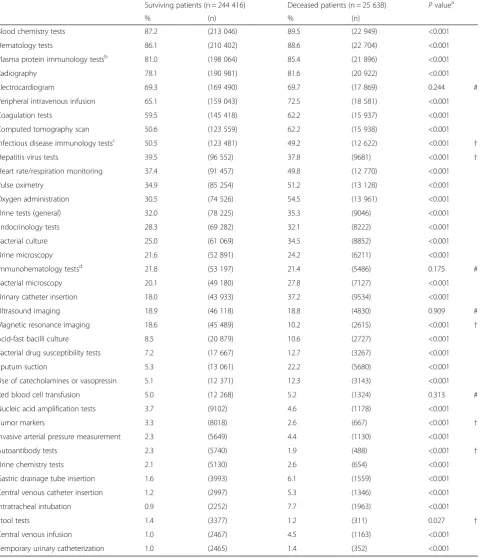
Table 2Procedures with≥1 % prevalence in the derivation cohort
Surviving patients (n = 244 416) Deceased patients (n = 25 638) Pvaluea
% (n) % (n)
Blood chemistry tests 87.2 (213 046) 89.5 (22 949) <0.001
Hematology tests 86.1 (210 402) 88.6 (22 704) <0.001
Plasma protein immunology testsb 81.0 (198 064) 85.4 (21 896) <0.001
Radiography 78.1 (190 981) 81.6 (20 922) <0.001
Electrocardiogram 69.3 (169 490) 69.7 (17 869) 0.244 #
Peripheral intravenous infusion 65.1 (159 043) 72.5 (18 581) <0.001
Coagulation tests 59.5 (145 418) 62.2 (15 937) <0.001
Computed tomography scan 50.6 (123 559) 62.2 (15 938) <0.001
Infectious disease immunology testsc 50.5 (123 481) 49.2 (12 622) <0.001
†
Hepatitis virus tests 39.5 (96 552) 37.8 (9681) <0.001 †
Heart rate/respiration monitoring 37.4 (91 457) 49.8 (12 770) <0.001
Pulse oximetry 34.9 (85 254) 51.2 (13 128) <0.001
Oxygen administration 30.5 (74 526) 54.5 (13 961) <0.001
Urine tests (general) 32.0 (78 225) 35.3 (9046) <0.001
Endocrinology tests 28.3 (69 282) 32.1 (8222) <0.001
Bacterial culture 25.0 (61 069) 34.5 (8852) <0.001
Urine microscopy 21.6 (52 891) 24.2 (6211) <0.001
Immunohematology testsd 21.8 (53 197) 21.4 (5486) 0.175 #
Bacterial microscopy 20.1 (49 180) 27.8 (7127) <0.001
Urinary catheter insertion 18.0 (43 933) 37.2 (9534) <0.001
Ultrasound imaging 18.9 (46 118) 18.8 (4830) 0.909 #
Magnetic resonance imaging 18.6 (45 489) 10.2 (2615) <0.001 †
Acid-fast bacilli culture 8.5 (20 879) 10.6 (2727) <0.001
Bacterial drug susceptibility tests 7.2 (17 667) 12.7 (3267) <0.001
Sputum suction 5.3 (13 061) 22.2 (5680) <0.001
Use of catecholamines or vasopressin 5.1 (12 371) 12.3 (3143) <0.001
Red blood cell transfusion 5.0 (12 268) 5.2 (1324) 0.313 #
Nucleic acid amplification tests 3.7 (9102) 4.6 (1178) <0.001
Tumor markers 3.3 (8018) 2.6 (667) <0.001 †
Invasive arterial pressure measurement 2.3 (5649) 4.4 (1130) <0.001
Autoantibody tests 2.3 (5740) 1.9 (488) <0.001 †
Urine chemistry tests 2.1 (5130) 2.6 (654) <0.001
Gastric drainage tube insertion 1.6 (3993) 6.1 (1559) <0.001
Central venous catheter insertion 1.2 (2997) 5.3 (1346) <0.001
Intratracheal intubation 0.9 (2252) 7.7 (1963) <0.001
Stool tests 1.4 (3377) 1.2 (311) 0.027 †
Central venous infusion 1.0 (2467) 4.5 (1163) <0.001
Temporary urinary catheterization 1.0 (2465) 1.4 (352) <0.001
a
ThePvalues were obtained by the chi-square test for in-hospital death b
For example, C-reactive protein, complement activity c
For example, viral antibody tests,β-D-glucan assay d
For example, blood type test, Coombs test # Not significant
Table 3Result of logistic regression analysis in the derivation cohort and points assigned to each procedure
Variable β exp(β) 95 % CI Pvalue Points for procedure
Admission-precipitating diagnosis
Acute myocardial infarction Ref
Congestive heart failure −0.10 0.90 0.83–0.98 0.012
Acute cerebrovascular disease −0.11 0.90 0.82–0.97 0.010
Gastrointestinal hemorrhage −0.51 0.60 0.55–0.66 <0.001
Pneumonia 0.04 1.04 0.95–1.13 0.405
Septicemia 0.73 2.07 1.87–2.28 <0.001
Sex (female) −0.12 0.89 0.86–0.91 <0.001
Age
<60 Ref
60–69 0.35 1.43 1.33–1.53 <0.001
70–79 0.68 1.98 1.86–2.11 <0.001
80–89 1.14 3.12 2.94–3.31 <0.001
≥90 1.60 4.96 4.65–5.30 <0.001
Charlson comorbidity index
0 Ref
1 0.03 1.03 0.98–1.07 0.233
2 0.18 1.20 1.16–1.24 <0.001
≥3 0.72 2.05 1.96–2.14 <0.001
Procedure
Invasive arterial pressure measurement −0.30 0.74 0.68–0.81 <0.001 −3
Blood tests (excluding coagulation) −0.26 0.77 0.73–0.81 <0.001 −3
Radiography −0.20 0.82 0.79–0.86 <0.001 −2
Urinalyses (excluding chemistry) −0.18 0.84 0.81–0.87 <0.001 −2
Temporary urinary catheterization −0.18 0.84 0.74–0.94 0.004 −1
Endocrinology tests −0.06 0.94 0.91–0.97 <0.001 −1
Bacterial microscopy or culture −0.05 0.95 0.91–0.99 0.019 −1
Acid-fast bacilli culture −0.04 0.96 0.91–1.02 0.206 #
Coagulation tests −0.03 0.97 0.94–1.01 0.117 #
Nucleic acid amplification tests 0.01 1.01 0.93–1.09 0.842 #
Bacterial drug susceptibility tests 0.06 1.06 1.01–1.12 0.022 1
Urine chemistry tests 0.10 1.10 1.00–1.21 0.041 1
Heart rate/respiration monitoring 0.18 1.20 1.16–1.24 <0.001 2
Peripheral intravenous infusion 0.18 1.20 1.16–1.24 <0.001 2
Computed tomography scan 0.25 1.28 1.24–1.32 <0.001 3
Pulse oximetry 0.29 1.33 1.29–1.37 <0.001 3
Gastric drainage tube insertion 0.32 1.38 1.27–1.50 <0.001 4
Urinary catheter insertion 0.47 1.60 1.55–1.66 <0.001 5
Central venous catheter insertion 0.49 1.63 1.49–1.77 <0.001 5
Use of catecholamines or vasopressin 0.70 2.02 1.92–2.13 <0.001 8
Sputum suction 1.11 3.04 2.92–3.16 <0.001 12
Intratracheal intubation 2.05 7.77 7.14–8.45 <0.001 23
index compared with the other four variables combined. Model 4 was well-calibrated, as shown by the Hosmer– Lemeshow calibration plot presented in Fig. 2.
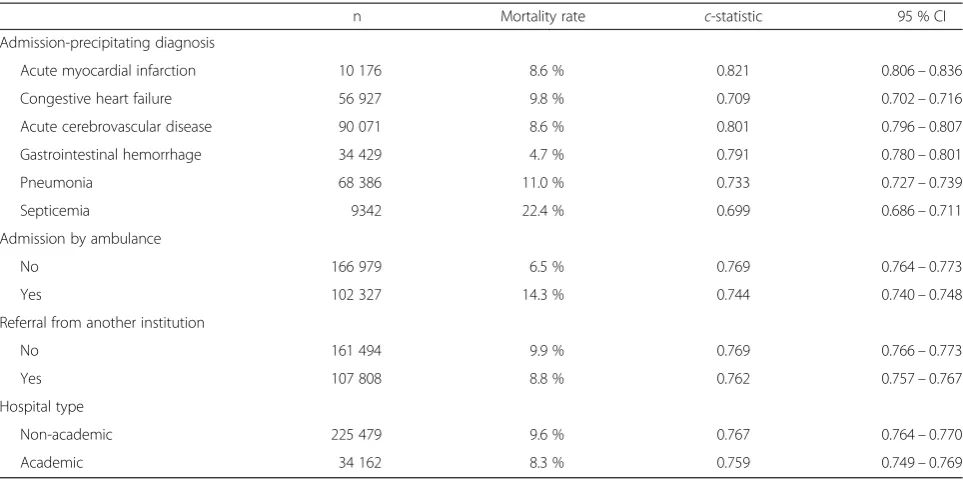
The mortality rates andc-statistics of the subgroups of patients are presented in Table 4. The model was well-calibrated for each diagnosis, as shown in Fig. 3. The model was also well-calibrated for other subgroups (data not shown).
Discussion
Using the Diagnosis Procedure Combination nationwide administrative database of acute-care hospitals, we derived and internally validated a severity index for inpatients that utilizes procedure records to predict in-hospital death. In the patients with the six diseases examined, the index was widely distributed, and the model combining the severity index with age, sex, and CCI predicted in-hospital death well (c-statistic: 0.767).
We used procedures performed on the day of admission as indicators of severity on admission, and extracted 19 commonly performed procedures, diagnostic and thera-peutic, that were significantly associated with in-hospital death or survival. The characteristics of the procedures differed widely, from routinely performed procedures (e.g. blood examinations) to those reflecting critically ill condi-tions (e.g. intratracheal intubation). This difference was represented in the weights given to each procedure, ran-ging from−3 to 23. The weights represented the strength of association between each procedure and death, relative to an increase in the CCI. The weighted numbers of the performed procedures were then summed into an index with a possible range of−13 to 69.
The mortality-predicting model with only diagnosis, age, sex, and CCI (model 3) had a fair discriminating ability (c-statistic: 0.675), and there was a significant improve-ment on the model performance when the severity index was added (IDI: 0.0700; c-statistic of model 4: 0.767). Furthermore, in model 4, the index contributed to the prediction of death more than all the other variables
0 0.1 0.2 0.3 0.4 0.5 0.6 0.7
0 5,000 10,000 15,000 20,000 25,000 30,000 35,000 40,000 45,000
Mortalit
y
Rate
Num
b
er o
f
P
atien
ts
Severity Index
Number of patients Observed mortality rate Expected mortality rate
Fig. 1Distribution of the severity index and observed and expected death rates in the validation cohort. The box plots indicate the observed mortality rates and their 95 % confidence intervals
0.00 0.05 0.10 0.15 0.20 0.25 0.30 0.35
0.00 0.05 0.10 0.15 0.20 0.25 0.30 0.35
Ob
served Mo
rtality
Rate
Expected Mortality Rate
[image:7.595.57.538.90.330.2] [image:7.595.58.290.495.703.2]combined (ω-statistic: 1.09). These results represent the importance of the severity index for predicting mortality. To our knowledge, this is the first study to examine a mortality prediction model with commonly used pro-cedures and medications, and the results suggest the usability of procedure records for risk adjustment.
Similar to other studies [12, 13], we chose six high-impact medical conditions (acute myocardial infarction, congestive heart failure, acute cerebrovascular disease, gastrointestinal hemorrhage, pneumonia, septicemia) as the target diseases. Although the single model had a good discriminating ability and was well-calibrated across various subgroups, thec-statistics ranged from 0.70 for septicemia to 0.82 for acute myocardial infarction. A previous study that used demographics, admission diagno-sis, comorbidity-based score, and laboratory-based score as variables had similar results, in which the c-statistics were ≥0.80 for 29 admission diagnoses, 0.71–0.80 for 13 admission diagnoses, and <0.70 for two admission diagnoses [14]. Use of the same model for various primary illnesses may result in variable predictive ability across diagnoses because the effects of procedures on mortality may differ across diagnoses. In addition, the main diagno-sis or main therapeutic procedure themselves are predic-tors of mortality [14, 15, 20]. Therefore, care should be taken when comparing these results with models derived separately for different diagnoses, which often yield higher c-statistics [12, 13, 16–19].
Although comorbidities recorded in administrative da-tabases have provided fairly good predictions of mortal-ity, there have been concerns that diagnoses may reflect
complications instead of comorbidities [6–10]. The use of numerical laboratory data is one method suggested by researchers, and high modelc-statistics of >0.8 were ob-served [12–16]. When available, laboratory data provide precise information about patient severity on admission and help to improve the model performance. However, implementation of an administrative database with labora-tory data requires considerable cost and effort, and previ-ous studies were thus confined to regional databases. In contrast, our study was conducted using a preexisting na-tionwide administrative database, and the procedures added considerable predictive ability to a model using demographics and comorbidities. The method presented here could be useful for similar databases with procedure data. For databases without procedure data, we recom-mend adding such data because it is relatively inexpensive and useful for mortality prediction.
[image:8.595.57.539.99.339.2]Our study has several strengths. First, it was conducted using a nationwide database, and included patients of all ages treated in hospitals with different characteristics in all areas of Japan. Second, chronological information was considered in the diagnoses and procedures. We used the “admission-precipitating diagnosis” for case identification and the “comorbidities present on admission” for comor-bidities. Similar to the use of“present on admission”codes in the previous US studies [12, 28] and“diagnosis-type in-dicator” codes in the previous Canadian studies [9, 29], our method prevents the misclassification of complica-tions occurring during hospitalization as main diagnoses or comorbidities. Likewise, the information regarding dates of performance of procedures enabled the extraction Table 4Results of subgroup analyses
n Mortality rate c-statistic 95 % CI
Admission-precipitating diagnosis
Acute myocardial infarction 10 176 8.6 % 0.821 0.806–0.836
Congestive heart failure 56 927 9.8 % 0.709 0.702–0.716
Acute cerebrovascular disease 90 071 8.6 % 0.801 0.796–0.807
Gastrointestinal hemorrhage 34 429 4.7 % 0.791 0.780–0.801
Pneumonia 68 386 11.0 % 0.733 0.727–0.739
Septicemia 9342 22.4 % 0.699 0.686–0.711
Admission by ambulance
No 166 979 6.5 % 0.769 0.764–0.773
Yes 102 327 14.3 % 0.744 0.740–0.748
Referral from another institution
No 161 494 9.9 % 0.769 0.766–0.773
Yes 107 808 8.8 % 0.762 0.757–0.767
Hospital type
Non-academic 225 479 9.6 % 0.767 0.764–0.770
Academic 34 162 8.3 % 0.759 0.749–0.769
0.00 0.05 0.10 0.15 0.20 0.25 0.30 0.35 0.40
Ob
serv
ed
Mo
rtality
Rate
Expected Mortality Rate A) Acute Myocardial Infarction
0.00 0.05 0.10 0.15 0.20 0.25 0.30
Ob
serv
ed
Mo
rtality
Rate
Expected Mortality Rate B) Congestive Heart Failure
0.00 0.05 0.10 0.15 0.20 0.25 0.30 0.35 0.40 0.45
Ob
serv
ed
Mo
rtality
Rate
Expected Mortality Rate C) Acute Cerebrovascular Disease
0.00 0.05 0.10 0.15 0.20
Ob
serv
ed
Mo
rtality
Rate
Expected Mortality Rate D) Gastrointestinal Hemorrhage
0.00 0.05 0.10 0.15 0.20 0.25 0.30 0.35
Ob
served
M
o
rtal
ity
Rate
Expected Mortality Rate E) Pneumonia
0.00 0.05 0.10 0.15 0.20 0.25 0.30 0.35 0.40 0.45 0.50 0.55
Ob
served
M
o
rt
al
it
y
Rat
e
Expected Mortality Rate F) Septicemia
[image:9.595.59.536.89.684.2]of procedures performed on the day of admission. Third, we used the aspects of whether or not the procedures were performed as variables. Although procedure data are not as objective as automatically-recorded laboratory data, we believe that the validity of procedure data is higher than that of recorded diagnoses.
This study has several limitations. First, we only exam-ined six medical conditions. It is unknown whether the severity index for inpatients developed in the present study is applicable to patients hospitalized for other con-ditions. Second, we excluded patients with critically ill conditions on the day of admission, because we expected that the associations of procedures with mortality would be different in these patients. Although some severe pa-tients, such as intubated patients and those on catechol-amines, were treated in general wards, as sometimes occurs in Japan [30, 31], and were thus included in the analysis, the issue of whether the index is valid for most critically ill patients, e.g. those admitted to the intensive care unit, requires further examination. Third, we lim-ited the drugs to catecholamines and vasopressin, but other treatments such as intravenous fluids and antibi-otics could also represent the severity on admission. Fourth, each admission was considered independent in the analyses. Better mortality prediction may be possible when clustering within patient and within site is taken into account. Also, the variance within each procedure, e.g., numbers or types of tested items within a blood test, was not accounted for. Last, the study was con-ducted in Japan using procedure codes in the Japanese fee reimbursement system, and the use of this index in other countries with different routine practices and cod-ing systems will require appropriate conversions.
Conclusion
The newly developed severity index for inpatients using procedure records predicted in-hospital death well. Fur-ther validating research should lead to its application to risk adjustment.
Additional file
Additional file 1:Procedures examined in the study.
Competing interests
The authors declare that they have no competing interests.
Authors’contributions
HY1 designed the study, conducted analyses, interpreted the results, and drafted the manuscript. HM designed the study, interpreted the results, and revised the manuscript. KF collected the data, interpreted the results, and revised the manuscript. HY2 designed the study, collected the data, interpreted the results, and revised the manuscript. All authors have read and approved the final manuscript.
Acknowledgements
This study was supported by grants from the Ministry of Health, Labour and Welfare, Japan (grant numbers: H26-Policy-011 and H26-Special-047). The authors thank Rika Tajima of the Department of Biostatistics, School of Public Health, The University of Tokyo for statistical advice.
Author details
1
Department of Clinical Epidemiology and Health Economics, School of Public Health, The University of Tokyo, 7-3-1 Hongo, Bunkyo-ku, Tokyo 113-0033, Japan.2Bunkyo City Public Health Center, 1-16-21 Kasuga, Bunkyo-ku, Tokyo 112-8555, Japan.3Department of Health Policy and Informatics, Tokyo Medical and Dental University Graduate School of Medicine, 1-5-45 Yushima, Bunkyo-ku, Tokyo 113-8510, Japan.
Received: 23 October 2014 Accepted: 22 May 2015
References
1. Dans PE. Looking for answers in all the wrong places. Ann Intern Med. 1993;119:855–7.
2. Halm EA, Chassin MR. Why do hospital death rates vary? N Engl J Med. 2001;345:692–4.
3. Lee TH, Meyer GS, Brennan TA. A middle ground on public accountability. N Engl J Med. 2004;350:2409–12.
4. Bufalino V, Peterson ED, Burke GL, LaBresh KA, Jones DW, Faxon DP, et al. Payment for quality: guiding principles and recommendations: principles and recommendations from the American Heart Association’s Reimbursement, Coverage, and Access Policy Development Workgroup. Circulation. 2006;113:1151–4.
5. Jollis JG, Ancukiewicz M, DeLong ER, Pryor DB, Muhlbaier LH, Mark DB. Discordance of databases designed for claims payment versus clinical information systems. Implications for outcomes research. Ann Intern Med. 1993;119:844–50.
6. Hannan EL, Kilburn Jr H, Lindsey ML, Lewis R. Clinical versus administrative data bases for CABG surgery. Does it matter? Med Care. 1992;30:892–907. 7. Hannan EL, Racz MJ, Jollis JG, Peterson ED. Using Medicare claims data to assess provider quality for CABG surgery: does it work well enough? Health Serv Res. 1997;31:659–78.
8. Pine M, Norusis M, Jones B, Rosenthal GE. Predictions of hospital mortality rates: a comparison of data sources. Ann Intern Med. 1997;126:347–54. 9. Southern DA, Quan H, Ghali WA. Comparison of the Elixhauser and
Charlson/Deyo methods of comorbidity measurement in administrative data. Med Care. 2004;42:355–60.
10. Glance LG, Dick AW, Osler TM, Mukamel DB. Accuracy of hospital report cards based on administrative data. Health Serv Res. 2006;41:1413–37. 11. Deyo RA, Cherkin DC, Ciol MA. Adapting a clinical comorbidity index for use
with ICD-9-CM administrative databases. J Clin Epidemiol. 1992;45:613–9. 12. Pine M, Jordan HS, Elixhauser A, Fry DE, Hoaglin DC, Jones B, et al.
Enhancement of claims data to improve risk adjustment of hospital mortality. JAMA. 2007;297:71–6.
13. Tabak YP, Johannes RS, Silber JH. Using automated clinical data for risk adjustment: development and validation of six disease-specific mortality predictive models for pay-for-performance. Med Care. 2007;45:789–805. 14. Escobar GJ, Greene JD, Scheirer P, Gardner MN, Draper D, Kipnis P.
Risk-adjusting hospital inpatient mortality using automated inpatient, outpatient, and laboratory databases. Med Care. 2008;46:232–9.
15. Tabak YP, Sun X, Nunez CM, Johannes RS. Using electronic health record data to develop inpatient mortality predictive model: Acute Laboratory Risk of Mortality Score (ALaRMS). J Am Med Inform Assoc. 2014;21:455–63. 16. Tabak YP, Sun X, Johannes RS, Hyde L, Shorr AF, Lindenauer PK. Development
and validation of a mortality risk-adjustment model for patients hospitalized for exacerbations of chronic obstructive pulmonary disease. Med Care. 2013;51:597–605.
17. Lagu T, Lindenauer PK, Rothberg MB, Nathanson BH, Pekow PS, Steingrub JS, et al. Development and validation of a model that uses enhanced administrative data to predict mortality in patients with sepsis. Crit Care Med. 2011;39:2425–30.
19. Rothberg MB, Pekow PS, Priya A, Zilberberg MD, Belforti R, Skiest D, et al. Using highly detailed administrative data to predict pneumonia mortality. PLoS ONE. 2014;9, e87382.
20. van Walraven C, Wong J, Bennet C, Forster AJ. The Procedural Index for Mortality Risk (PIMR): an index calculated using administrative data to quantify the independent influence of procedures on risk of hospital death. BMC Health Serv Res. 2011;11:258.
21. Hashimoto H, Ikegami N, Shibuya K, Izumida N, Noguchi H, Yasunaga H, et al. Cost containment and quality of care in Japan: is there a trade-off? Lancet. 2011;378:1174–82.
22. Healthcare Cost and Utilization Project (HCUP): Classifications Software (CCS) for Mortality Reporting [http://www.hcup-us.ahrq.gov/toolssoftware/icd_10/ ccs_icd_10.jsp]
23. Quan H, Sundararajan V, Halfon P, Fong A, Burnand B, Luthi J-C, et al. Coding algorithms for defining comorbidities in ICD-9-CM and ICD-10 administrative data. Med Care. 2005;43:1130–9.
24. Quan H, Li B, Couris CM, Fushimi K, Graham P, Hider P, et al. Updating and validating the Charlson comorbidity index and score for risk adjustment in hospital discharge abstracts using data from 6 countries. Am J Epidemiol. 2011;173:676–82.
25. Sullivan LM, Massaro JM, D’Agostino Sr RB. Presentation of multivariate data for clinical use: the Framingham Study risk score functions. Stat Med. 2004;23:1631–60.
26. Pencina MJ, D’Agostino Sr RB, D’Agostino Jr RB, Vasan RS. Evaluating the added predictive ability of a new marker: from area under the ROC curve to reclassification and beyond. Stat Med. 2008;27:157–72.
27. Silber JH, Rosenbaum PR, Ross RN. Comparing the contributions of groups of predictors: which outcomes vary with hospital rather than patient characteristics. J Am Stat Assoc. 1995;90:7–18.
28. Glance LG, Osler TM, Mukamel DB, Dick AW. Impact of the present-on-admission indicator on hospital quality measurement: experience with the Agency for Healthcare Research and Quality (AHRQ) Inpatient Quality Indicators. Med Care. 2008;46:112–9.
29. Ghali WA, Quan H, Brant R. Risk adjustment using administrative data: impact of a diagnosis-type indicator. J Gen Intern Med. 2001;16:519–24. 30. Miyaji T, Sha M, Hirose M. Nationwide study of ventilator management and
maintenance in Japan. Jpn J Respir Care. 2006;23:92–7 [in Japanese]. 31. Takinami M, Uchino S, Kase Y, Iwai K, Saito K, Iwaya R, et al. Current
management for clinically ill patients with mechanical ventilation on the ward. J Jpn Soc Intensive Care Med. 2011;18:417–8 [in Japanese].
Submit your next manuscript to BioMed Central and take full advantage of:
• Convenient online submission
• Thorough peer review
• No space constraints or color figure charges
• Immediate publication on acceptance
• Inclusion in PubMed, CAS, Scopus and Google Scholar
• Research which is freely available for redistribution