RESEARCH ARTICLE
10.1002/2016WR020358
Parameterization and prediction of nanoparticle transport in
porous media: A reanalysis using artificial neural network
Peyman Babakhani1,2 , Jonathan Bridge2,3 , Ruey-an Doong1,4 , and Tanapon Phenrat5,6
1Department of Biomedical Engineering and Environmental Sciences, National Tsing Hua University, Hsinchu, Taiwan, 2
Department of Civil Engineering and Industrial Design, University of Liverpool, Liverpool, UK,3Department of the Natural and Built Environment, Sheffield Hallam University, Sheffield, UK,4Institute of Environmental Engineering, National Chiao
Tung University, Hsinchu, Taiwan,5Research Unit for Integrated Natural Resources Remediation and Reclamation, Department of Civil Engineering, Faculty of Engineering, Naresuan University, Phitsanulok, Thailand,6Center of Excellence
for Sustainability of Health, Environment and Industry, Faculty of Engineering, Naresuan University, Phitsanulok, Thailand
Abstract
The continuing rapid expansion of industrial and consumer processes based on nanoparticles (NP) necessitates a robust model for delineating their fate and transport in groundwater. An ability to reli-ably specify the full parameter set for prediction of NP transport using continuum models is crucial. In this paper we report the reanalysis of a data set of 493 published column experiment outcomes together with their continuum modeling results. Experimental properties were parameterized into 20 factors which are commonly available. They were then used to predict five key continuum model parameters as well as the effluent concentration via artificial neural network (ANN)-based correlations. The Partial Derivatives (PaD) technique and Monte Carlo method were used for the analysis of sensitivities and model-produced uncer-tainties, respectively. The outcomes shed light on several controversial relationships between the parame-ters, e.g., it was revealed that the trend ofKattwith average pore water velocity was positive. The resultingcorrelations, despite being developed based on a ‘‘black-box’’ technique (ANN), were able to explain the effects of theoretical parameters such as critical deposition concentration (CDC), even though these param-eters were not explicitly considered in the model. Porous media heterogeneity was considered as a parame-ter for the first time and showed sensitivities higher than those of dispersivity. The model performance was validated well against subsets of the experimental data and was compared with current models. The robust-ness of the correlation matrices was not completely satisfactory, since they failed to predict the experimen-tal breakthrough curves (BTCs) at extreme values of ionic strengths.
Plain Language Summary
Models based on advection-dispersion-equation (ADE), have succeeded in describing a variety of nanoparticle (NP) transport mechanisms within subsurface porous media. These models are usually fitted against known observation data to obtain the unknown parameters. Nevertheless, the parameters determined in this way cannot be used for a new problem of the same type and again there exists the need for the data to calibrate the model parameters for a new problem. Black box models, such as artificial neural network (ANN), have been mostly, if not all the times, used in the same way of ADE models, i.e., single problem solver. In this paper we use the ability of ANN to develop a series of simple correlation matrices that can be easily used for the prediction of ADE parameters in the new problem without the need for additional calibration. Although comparisons between ANN model predictions and experimental data show that there is still further work to be done, our approach out-performs other compa-rable models and offers new insight into the complex interactions among the factors determining NP transport and fate in the environment.1. Introduction
The rapid development of nanotechnology is identified as sufficiently remarkable as to be comparable with the industrial revolution [Lanphere et al., 2013]. A comprehensive evaluation of the fate and transport of engineered nanoparticles (NP) is pivotal to enable robust prediction and management of nanoparticulate materials in environmental matrices. One of the endpoints of the NP life cycle is the subsurface soil and Key Points:
ANN-based correlations can be useful for predicting continuum model parameters
Sensitivity analysis of ANN gives valuable insights into the role of each experimental factor in continuum model parameters
A heterogeneity parameter is even more important than dispersivity
Supporting Information: Supporting Information S1
Data Set S1
Correspondence to: R. Doong,
Citation:
Babakhani, P., J. Bridge, R.-A. Doong, and T. Phenrat (2017),
Parameterization and prediction of nanoparticle transport in porous media: A reanalysis using artificial neural network,Water Resour. Res.,53, 4564–4585, doi:10.1002/
2016WR020358.
Received 1 JAN 2017 Accepted 2 MAY 2017
Accepted article online 13 MAY 2017 Published online 3 JUN 2017
VC2017. American Geophysical Union. All Rights Reserved.
thereby groundwater [Keller et al., 2013]. Nanoparticles can be introduced into groundwater unintentionally from various sources during manufacturing/application/disposal stages; or they may be injected intention-ally in applications such as in situ groundwater remediation or recovery enhancement of oil and gas reser-voirs [Ehtesabi et al., 2013;Tratnyek and Johnson, 2006;Yu et al., 2015b].
Diversity of the subsurface conditions on the one hand and variations in the characteristics of NP on the other hand limit the success of many current models in predicting the transport of NP. The ongoing devel-opment of hybrid NP with various architectures and coatings makes it inefficient to develop a specific model for each individual type of NP, suggesting the need for developing a robust model that can capture the transport behavior of as many types of NP as possible [Chou et al., 2013;Huang et al., 2010, 2012;Saleh et al., 2015]. To date, the most widely used theory to predict the transport of NP and colloids has been the clean-bed (or classical) colloid filtration theory (CFT) [Logan et al., 1995;Molnar et al., 2015;Rajagopalan and Tien, 1976;Yao et al., 1971]. However, models based on CFT still find it challenging to take into account the physical retention (straining) of colloid [Bradford et al., 2002, 2003, 2006a, 2006b], heterogeneity in the col-loid population [Jones and Su, 2012;Tong and Johnson, 2007], and heterogeneity in the surface chemistry [Bolster et al., 1999;Li et al., 2004;Tufenkji and Elimelech, 2005]. Its application when several transport phe-nomena occur simultaneously is under question.
Continuum-based models can describe the transport of NP in porous media when various mechanisms are involved concurrently and across various scales, provided that conceptual models of various transport phe-nomena can be defined and validated properly in the mathematical framework [Molnar et al., 2015;Nowack et al., 2015]. These models are construed as partial-differential equations developed based on the mass or particle number balance [Molnar et al., 2015]. The drawback in using continuum models is that the model parameters cannot be simply estimated and necessitate the output data of continuum models to be fitted against a set of experimental or field data which may not be available [Goldberg et al., 2015;Molnar et al., 2015;Peijnenburg et al., 2016]. Efforts to predict individual parameters of continuum model via regression analysis and/or mechanistic approaches, e.g., estimating attachment rate coefficient [Seetha et al., 2015], site blocking, or straining parameters, have been very limited [Bradford et al., 2003; Hassan et al., 2013;
Porubcan and Xu, 2011;Xu and Saiers, 2009;Xu et al., 2006, 2008]. Furthermore, the effects of many experi-mental and environexperi-mental factors such as soil heterogeneity and dispersivity on the continuum model parameters are still unknown.
Recently,Goldberg et al. [2015] used a machine learning technique known as ‘‘random forest ensemble’’ to find the most important environmental parameters in retention of NP transport. Although the outcomes of their paper provide very useful insights into the retention behavior of NP in porous media, they are limited to regression analysis of retained fraction and retained mass profiles of NP in porous media. The artificial neural network (ANN) is a powerful algorithm which emulates the processing system of the human brain in terms of the structure and interactions of neurons with the information signals [Lu et al., 2001;Maier and Dandy, 1996;Morshed and Kaluarachchi, 1998;Nourani and Sayyah-Fard, 2012;Yu et al., 2015a]. This concept, which was originally proposed in 1940s byMcCulloch and Pitts[1943], has been introduced as a versatile and universal tool for function approximation problems, especially in nonlinear systems, where other math-ematical/mechanistic techniques are difficult to implement [Morshed and Kaluarachchi, 1998;Nourani et al., 2012;Yerramareddy et al., 1993]. In spite of extensive applications in the fields of environmental, hydrology, and civil engineering over several decades [Lu et al., 2001;Morshed and Kaluarachchi, 1998], ANN is still rela-tively untested in colloidal transport problems. Particularly, a direct application of ANN to simulate or ana-lyze data related to the transport of NP in porous media has not been reported thus far, although it has been applied for the transport of other contaminants such as nitrate [Hosseini et al., 2012]. ANN is catego-rized as a ‘‘black-box’’ model because it is difficult to draw any conceptual relationship between the mathe-matics of the model and the underlying physical phenomena. Nevertheless, various sensitivity analysis techniques have been developed in order to gain insight into the influence of input variables on the ANN outputs [Gevrey et al., 2003, 2006;Lu et al., 2001;Nourani and Sayyah-Fard, 2012]. For instance,Gevrey et al. [2003] assessed seven methods for the sensitivity analysis of ANN in ecological systems and found that the ‘‘Partial Derivatives’’ technique (PaD) is the most useful and stable method [Gevrey et al., 2003;Lu et al., 2001;Nourani and Sayyah-Fard, 2012].
experimental or environmental factors that may influence the transport of NP in porous media in 493 sepa-rate experiments published in more than 50 peer-reviewed studies. Second, we investigate the ability of the ANN-based correlation matrices to independently predict the continuum model parameters. If the final cor-relation matrices are successful in predicting model parameters, they can be easily used to estimate the major parameters of continuum models based on NP characteristics and transport conditions that are known or simply measurable. This would mitigate the need for parameter calibration of the continuum model in future column transport studies. To the best of our knowledge, this is the first time such a thor-ough modeling, sensitivity, and uncertainty analysis has been conducted on the continuum model parame-ters associated with a wide variety of environmental/experimental factors.
2. Data Set and Parameterization
We extracted the data for NP comprising silver (AgNP), nanoscale zero valent iron (NZVI), Fe3O4,
hydroxyap-atite (HAp), graphene and graphene oxide (GO), cerium dioxide (CeO2), TiO2, zinc oxide (ZnO), quantum
dots (QDs), latex, silica, aluminum oxide (AlO), and boehmite NP. All the parameters together with their sta-tistics and ranges are given in Table 1. The parameters for which the data were collected were in two groups: (1) modeling parameters that result from fitting the continuum model to experimental break-through and/or retention profile data and (2) all the possible factors that could be feasibly measured from the experimental or real environmental properties without relying on current theories and without the need for performing any major experiment.
The required data for the first group of parameters, i.e., modeling parameters, were gathered for the attach-ment rate constant,Katt(1/h), which was common among all of these models. Other most common
parame-ters were the detachment rate constant,Kdet (1/h), the maximum retained-particle phase concentration or
colloidal retention capacity, Sm(mg/g), and the empirical depth-dependent retention parameter,b.
Investi-gations were also extended to the second attachment rate constant,Katt2(1/h), representing the second site
attachment rate. The second group of parameters—hereafter termed ‘‘factors’’—includes aqueous phase ionic strength (IS), pH, zeta-potential of particle and porous media surfaces, NP coating and free-polymer concentrations, input NP concentration, dimensions of the porous medium (column length and diameter), average pore water velocity, grain diameter, porosity, dispersivity, heterogeneity, number of injected pore volumes (PV), particle diameter, particle density, aspect ratio of NP, the pH of isoelectric point (or point of zero charge), and saturation magnetization. Note that in order to consider both negative and positive values of zeta-potential, in a consistent trend, zeta-potential data were normalized by the minimum of their range, as explained in Table 1.
We mostly considered saturated porous media—only in one paper the porous media was unsaturated [Liang et al., 2013b] which involved undisturbed soil with90% saturation degree. The temperature of experiments had to be close to 25C. We applied a criterion that the fittingR2for continuum modeling
parameters had to be at least 0.7 in order to incorporate the data of that modeling study. The isoelectric point (IEP) or the point of zero charge (PZC) was rarely reported in the given papers and therefore the same value was assumed for each type of NP according to other literature sources given in supporting informa-tion Table S1. It is difficult to put the data of ionic strength (IS) from various studies together into the model as a single parameter because of the diversity in the ionic compositions. In this study, we synchronized the IS data of various ionic species by drawing linear correlations between various ionic species. For this pur-pose, we first divided the data set based on the different ionic compositions and tried to seek linear correla-tions between IS data of each ionic species withKattas the most representative parameter of NP transport.
In this way, linear correlations were achieved for the data of NaCl, CaCl2, NaHCO3, KNO3, and MgSO4, with
correlation coefficients ranging from 0.42 to 0.93 (supporting information Table S2). Although these linear correlations were not very strong, they could be useful for pretreatment of IS data since they were also sta-tistically significant based on Fisher F test (supporting information Table S2) [Donaldson, 1966]. Eventually, based on these linear correlations, the IS values of CaCl2, NaHCO3, KNO3, and MgSO4were scaled to the IS
values of NaCl which was afterward used as input to the ANN modeling and extended to other model parameters as well. Other ionic compositions which did not show a linear relationship with Katt were
involved in the IS data without any specific treatment. These species were NaNO3, Ca(NO3)2, NaClO4, and
Table 1.List of the Two Groups of Parameters, Modeling Parameters and Experimental/Environmental Properties
Abbr. Description and Unit Min Max Mean STDV
Missing
Rate (%) Note
Free pol. conc.
Free-polymer conc. (mg/L) if cotransport
1.0E-07 1.0E104 9.7E101 5.8E102 7.3 The concentration of various polymers (e.g., NOM, surfactant, protein) which was added to the stock dispersion of nanoparticle prior to the injection into porous media in order to be cotransported with NPs
Zeta_NP Zeta-potential of nanoparticles (mV)
1.0E-02 1.1E102 4.4E101 1.5E101 11.6 All the values are offset by the absolute min of the original data,272 mV, i.e., all the data are added with 7210.01
dp Hydrodynamic diameter of
nanoparticles (average) (nm)
9.7E100 3.9E103 3.4E102 5.1E102 0.6 Hydrodynamic diameter of particles mostly measured by dynamic light scattering (DLS) or nanoparticle tracking analysis (NTA) or in few cases the physical size measured by other techniques including laser obscuration time [Laumann et al., 2014], TEM [Liu et al., 2013], and AFM [Qi et al., 2014a, 2014b] NP dens. Density of nanoparticles (g/cm3
) 1.1E100 1.0E101 5.6E100 3.3E100 0.0 Density of the bulk material of NP without considering the coatings C0 Injected concentration of NP
slurry (mg/L)
1.6E-03 2.0E104 3.4E102 1.8E103 0.0
Col. diam. Packed column diameter (cm) 6.6E-01 8.0E100 2.4E100 1.4E100 0.6 Inner diameter Col. leng. Packed column length (cm) 3.0E100 5.0E101 1.5E101 8.7E100 0.0
Heterogen. Heterogeneity parameter (%) 1.0E100 1.0E102 3.2E101 2.6E101 0.0 Categorization soil heterogeneity for this parameter is thoroughly described in this document
dg Size of porous media grains
(average diameter) (mm)
8.7E-02 1.8E100 4.7E-01 2.7E-01 0.0 In cases where porous media was made up of natural soil and grain size distribution was not given, the average grain size obtained by considering the size of clay, 0.002 mm, the size of silt in range of 0.002–0.064 mm and the size of sand in range of 0.064–2 mm
Zeta_Grain Zeta-potential of porous media grains (mV)
1.0E-02 1.4E102 4.8E101 1.8E101 30.6 All the values are offset by the absolute min of the original data,287 mV, i.e., all the data are added with 8710.01
Porosity Porosity of packed porous media 1.9E-01 5.7E-01 4.0E-01 5.9E-02 2.8 Veloc. Pore water velocity (cm/min) 2.2E-03 1.8E101 1.4E100 2.5E100 0.0
Disp. Dispersivity (cm) 1.2E-03 1.6E100 2.8E-01 3.6E-01 59.6 Commonly obtained by fitting to tracer BTC data. Only in few cases it was determined from the fit to the NP BTC data [e.g.,Laumann et al., 2014]
pH Acidity 3.0E100 1.1E101 6.8E100 1.4E100 3.9
IS Ionic strength (mM) 1.0E-02 7.9E102 2.9E101 6.8E101 2.6 Ionic species involved in the data were NaCl, CaCl2, NaNO3, MgSo4, KNO3,
Ca(NO3)2, NaClO4, NaHCO3, and KCl. The IS of some of these ions are scaled
to that of NaCl as described in the text PV No. Number of injected pore volumes
into porous media
1.0E100 1.2E102 1.1E101 1.5E101 0.0 In several studies it was estimated from the BTC. In cases where the injection was continues the maximum number of PV used in the simulation (shown in the graph) was used
Aspect ratio
Particle shape aspect ratio 1.0E100 3.8E103 1.5E102 5.0E102 0.6 Mostly calculated as the ratio of the hydrodynamic size to the smallest reported dimension of the particles, e.g., for GO the average thickness of 1.1 was considered as the smallest dimension. In other cases, it was estimated from the range of the size given or roughly from the shape of the particles in the TEM or SEM images, e.g., it was equal to unity for NPs that are expected to be roughly spherical, e.g., Ag NP and NZVI Coat.
conc.
Total average adsorbed coating concentration in the dispersion (mg/L)
1.0E-07 1.9E102 7.3E100 2.7E101 10.3 Coating were mostly various polymers (e.g., NOM, surfactant, and protein) or in few cases Cu (in three of papers:Hosseini and Tosco[2013] andWang et al. [2011b, 2012a]). If the amount of adsorbed
polymer was not clear and it was not mentioned as free polymer, then half the total initial polymer concentration was assumed as free-polymer concentration and half as coating concentration. Labeling on NPs was not considered as coating
Sat. magnet.
Saturation magnetization (kA/m) 1.0E-07 5.7E102 7.3E101 1.9E102 0.0 It was assumed according toPhenrat et al. [2007] as 570 kA/m for NZVI and 330 kA/m for Fe3O4and for other NPs as zero
IEP Isoelectric point pH or alternatively point of zero charge (PZC)
1.9E100 9.4E100 6.0E100 2.2E100 0.0 In most of the cases it was not reported in the given paper and thus obtained from other literatures as listed for various NPs in supporting information Table S1
Katt Attachment rate constant
parameter (1/h)
1.3E-05 2.1E103 7.6E101 2.7E102 NA Only in one study it was assumed zero [Kini et al., 2014] because the applied model involved using the partition coefficient parameter
Kdet Detachment rate constant
parameter (1/h)
1.0E-09 3.7E104 1.0E102 1.7E103 NA
Sm Maximum retained-particle phase
concentration (mg/g)
2.6E-08 1.0E109 4.1E108 4.9E108 NA
B Empirical depth-dependent retention parameter
1.0E-09 1.5E100 2.0E-01 2.7E-01 NA
Katt2 Attachment rate constant
parameter for the second attachment sites or the second transporting species (1/h)
1.0E-09 3.8E103 7.6E101 3.6E102 NA
C/C0 Eluted mass (concentration) per
injected mass (concentration) (%)
1.0E-01 1.0E102 5.8E101 3.2E101 NA Generally considered as the reported diluted mass obtained from the mass balance in the reference, otherwise it was roughly estimated by measuring the height of the BTC plateau at the middle of its width or the peak
a
The outliers in the data set were identified via statistical techniques such as box plot and the Grubbs test [Grubbs, 1969]. However, in order to prevent the loss of important data only certain outliers were removed or replaced that could be evidently true anomalies, e.g., a case that had been measured with a completely different technique than others in that family [Aggarwal, 2013;Yang, 2013]. After this stage, the percentage of missing data compared to the whole data set of input variables was 6.5%. This missingness mostly involved the dispersivity parameter—3.0% of the whole data set or 60% of the expected data for this parameter (Table 1). Therefore, a separate ANN network was developed to predict the missing data of dis-persivity and also for future modeling purposes via the available data. This was accomplished by assuming dispersivity to be dependent on six factors including (1) column length, (2) column diameter, (3) average pore water velocity, (4) heterogeneity, (5) porosity, and (6) grain diameter [Chrysikopoulos and Katzourakis, 2015;Howington et al., 1997;Illangasekare et al., 2010;James and Chrysikopoulos, 2003]. In order to avoid los-ing the effective data set, the rest of gaps in the data for experimental conditions parameters were imputed with the average of the available data for each parameter. This may not affect the overall result of ANN modeling significantly, because the total percentage of missing data was low (3.5%). Among these data gaps, the maximum missing rate was 31% associated with the grain zeta-potential, followed by 12% for par-ticle zeta-potential, and 10% for adsorbed coating concentration (Table 1). These missingness rates might not be significant because a missingness rate of 73% or more for each parameter has been common in the literature [Schafer and Graham, 2002]. It should be noted that there were also missingness in the data of predicted parameters, includingKdet,Sm,b, andKatt2. However, eliminating these gaps did not lead to
signif-icant loss in the data set. Finally, the used data set forKattandC/C0was 493 cases while forKdet,Sm,b, and
Katt2 it was reduced to 200, 286, 214, and 186 cases, respectively.
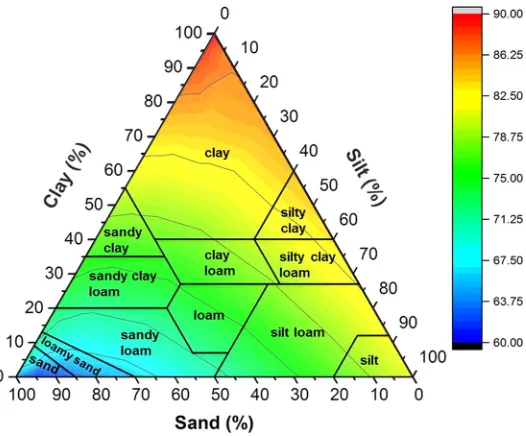
The heterogeneity of the soil texture is an important factor in the transport of NP in porous media [Cullen et al., 2010]. Nevertheless, there has not been any simple robust systematic definition of porous media het-erogeneity in the context of colloid transport so that it can be considered as a parameter in continuum models. Given the available information in the literature about the effective heterogeneities that affect the transport of NP at the continuum scale, and considering the practical purpose of current modeling study, we assume a rough categorization of porous media types in order to define a unified heterogeneity param-eter. This conceptualization of the unified heterogeneity parameter is merely a simplification based on a rationale that mainly considers the spatial variability of the porous media surface properties as opposed to the heterogeneity of the hydraulic conductivity (flow). This is based upon a series of intuitive assumptions imposed by the type of porous media, e.g., the nature of the soil sample (clean or treated laboratory porous media, disturbed, and undisturbed), grain coating, and grain size distribution. In doing so, porous media containing only glass beads was assumed to have the minimum heterogeneity (0.0%) compared to other possible types of porous media and the porous media consisting of undisturbed natural soil was assumed to have the highest heterogeneity (100%). Then three categories were considered between 0.0 and 100% heterogeneity.
H5 60163
1
23
PClay
PSilt1PClay
11
23
PClay
PClay1PSilt1PSand
11
23
PSilt
PSand1PSilt
133 PClay1PSilt
PClay1PSilt1PSand
1 PClay3PSand
PClay1PSilt3ðPSilt1PSandÞ
;
(1)
whereHis the estimated heterogeneity in this range (%),PClay,PSilt, andPSand are the percentages of clay,
silt, and sand in the soil, respectively. The ternary plot of the heterogeneity parameter in the soil subcate-gory is sketched in Figure 1, and for practical purposes and comparison, it is overlain by the "USDA Soil Tex-ture Triangle", a classification which has been used for soil texTex-ture in other contexts [e.g.,Jaisi and Elimelech, 2009;Plaster, 1997;Saey et al., 2009]. Supporting information Table S3 shows the variations ofHor hetero-geneity in the range of 60–90% for different amounts of clay, silt, and sand. According to this relationship, the maximum possible heterogeneity for disturbed soil (90%) will be obtained for a soil with 99.9% clay and 0.1% sand and the minimum heterogeneity of the soil category, 60.0%, is obtained for a soil with 99.9% sand and 0.1% silt. This minimum value of heterogeneity increases to 64.5% when the proportions of clay and silt change to 0.05 and 0.05%, respectively, and further increases to 69.0% when clay and silt contents are 0.1 and 0.0%, respectively. The diagram of this categorization of heterogeneous porous media is given in supporting information Figure S1. It should be noted that there are other types of heterogeneities such as microsurface and nanosurface roughness heterogeneities [Liang et al., 2013a;Molnar et al., 2015;
Torkzaban et al., 2008] as well as other similar concepts such as immobile zone [Molnar et al., 2015;
Torkzaban et al., 2008] that might be counted as heterogeneity. These are not considered here due to the lack of sufficient information in the current literature. It should also be mentioned that we believe a unifying approach for conceptualization of the heterogeneity parameter in sequential ranges is more efficient and flexible than considering different types of heterogeneities, each as an individual parameter, and it is also potentially more powerful when it comes to the comparison of sensitivities among 20 experimental factors.
3. Artificial Neural Network Modeling Procedure
We adopted a three-layer configuration for the ANN model as commonly used in the literature [Gevrey et al., 2006;Nourani and Sayyah-Fard, 2012;Yu et al., 2015a]. These layers comprise an input layer, a hidden layer, and an output layer. Each of these layers is composed of a series of nodes (neurons) as illustrated in support-ing information Figure S2. Each node in the hidden layer receives signals (its input information) from all nodes of the input layer and each node in the output layer receives signals from all nodes of the hidden layer. These signals depend upon the strength of connections which are defined as weights and biases. These weight and biases are also known as the network structure and their values are initially unknown. They can be determined by fitting the network against any known data set of interest which have both input and outputs sets. In this study, the inputs are defined as the 20 common factors identified within the literature data and the outputs against which the model is tested are the five key continuum model parameters plus the normalized effluent concentration. The model therefore operates by optimizing hidden layer node weight-bias combinations against the input-output data of all the literature data sets consisting of up to 493 column experiment records. This procedure is called training of the network. Once these weights and biases are estimated, the network can be used for prediction of unknown outputs of a new data set [Yu et al., 2015a].
The number of nodes in the input layer and in the output layer are the same as the number of input and output variables in the data set, respectively. The number of hidden layer nodes, however, should be selected by trial-and-error in which the best fit in the training process is achieved while the number of hid-den layer nodes is kept minimum [Yerramareddy et al., 1993;Yu et al., 2015a]. The training is performed with the Levenberg-Marqurdt back-propagation learning algorithm for optimization of the weights and biases. Levenberg-Marqurdt is a well-known, generic, and efficient algorithm that is widely used for nonlinear curve-fitting problems to minimize the errors between the given data and model-generated data in order to ascertain the parameters of the model [Doherty, 2004;Nourani and Sayyah-Fard, 2012;Yu et al., 2015a]. Back-propagation is the way of calculating the propagation of errors from the output layer toward the input layer and forward the information from input layer toward the output layer [Coulibaly et al., 2000; Yerramar-eddy et al., 1993;Yu et al., 2015a]. This approach has been proved to be efficient and fast enough for most of the problems [Hagan and Menhaj, 1994;Lu et al., 2001;Morshed and Kaluarachchi, 1998;Noori et al., 2015;
A potential defect in ANN analysis of sensitivity is the possibility of significant variation in the structure (weights and biases) of the trained network in different training times [Lu et al., 2001]. Furthermore, the optimum number of nodes in the hidden layer may change upon selecting various initial weights and biases. Although these variations may not affect the outputs of an established network, this hinders a deter-ministic analysis of sensitivity procedure [Lu et al., 2001]. Therefore, in this paper we assessed the uncertain-ties imposed by the variation in the structure of the network on the outcomes of the sensitivity analysis through a Monte Carlo approach [Dehghani et al., 2014]. This was conducted using a MATLABVC (Mathworks, USA) code that (1) finds the optimum number of hidden layer neurons (in a range of 5–35 nodes) by iterat-ing the trainiterat-ing process in an inner loop, (2) conducts the analysis of sensitivity method of PaD on the opti-mized model as described later, (3) iterates all this procedure for 1000 times in an outer loop so that the average result of the sensitivities can be ascertained together with the relevant uncertainty statistics, and (4) finds the network with the best generalization to be presented in a spreadsheet for future predictions. The result of this uncertainty analysis performed on the sensitivity analysis approach is presented by calcu-lating the 95% confidence interval (CI) according to the 2.5th and 97.5th percentiles of the Student’st distri-bution [Couto et al., 2013;Dehghani et al., 2014]. The details of the PaD method used for ANN sensitivity analysis along with further description of the uncertainty analysis and the validation of the code against artificial data are available in supporting information Figure S3.
4. Results and Discussion
4.1. General Fitting Results
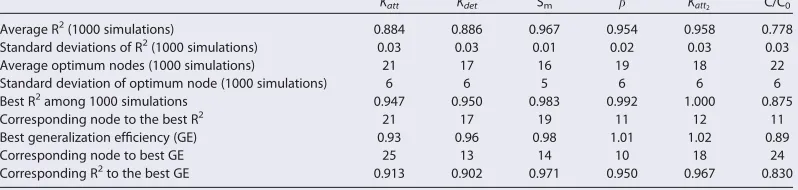
Over 1000 iterations the ANN was able to successfully find the relationships between the inputs and the outputs for each of five continuum model parameters with an average Nash and SutcliffR2 ranging from
0.884 to 0.967—mean overallR2of 0.930 (Table 2). The standard deviations of theseR2 values were
rela-tively low (<0.03, Table 2), suggesting the uncertainties that can result from poor fitting in certain iterations of the sensitivity analysis runs are minor. The goodness of fitting, however, was not as high whenC=C0was
considered as a direct predictable parameter from experimental factors (meanR250:778, Table 2). Overall,
these goodness-of-fit ranges are comparable with [Nourani and Sayyah-Fard, 2012] carrying out ANN sensi-tivity analysis on daily evaporation data, whereR2values were less than 0.9.
The numbers of optimum nodes which give the best fitting via the inner loop of the code were averaged over 1000 outer iterations. These figures were between 16 and 22 for different continuum parameters as well asC=C0(Table 2). Standard deviations for these values, however, were between 5 and 6 (Table 2),
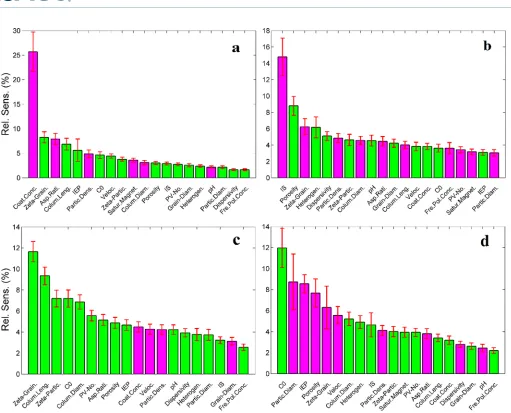
indi-cating the change in the structure of the network may be significant and might therefore diversify the results of the sensitivity analysis even though the model is able to gain a consistent goodness of fit to the experimental data as mentioned above. Therefore, as noted in the methods section we used the Monte Carlo approach to assess the uncertainties related to variable trained model structure. The outcomes, shown as error bars in Figures 2 and 3, indicate that the ranges of variations in the sensitivity outcomes with 95% CI are relatively small and do not preclude ranking of parameter sensitivities from high to low.
[image:7.630.185.584.654.749.2]In the following sensitivity analysis results, since a series of 20 experimental/environmental factors are involved in the analysis, one may expect that if all factors were equally significant (a null hypothesis for this work) then each would have a relative sensitivity (RS) of 5%. To generalize, if the number of input factors varies, then the baseline value and hence the ‘‘cutoff’’ value for significance, would vary accordingly. For
Table 2.Fitting Results and the Number of Optimum Nodes Obtained by ANN Code for Various Continuum Model Parameters
Katt Kdet Sm b Katt2 C/C0
Average R2
(1000 simulations) 0.884 0.886 0.967 0.954 0.958 0.778
Standard deviations of R2(1000 simulations) 0.03 0.03 0.01 0.02 0.03 0.03
Average optimum nodes (1000 simulations) 21 17 16 19 18 22
Standard deviation of optimum node (1000 simulations) 6 6 5 6 6 6
Best R2
among 1000 simulations 0.947 0.950 0.983 0.992 1.000 0.875
Corresponding node to the best R2 21 17 19 11 12 11
Best generalization efficiency (GE) 0.93 0.96 0.98 1.01 1.02 0.89
Corresponding node to best GE 25 13 14 10 18 24
Corresponding R2
example, if 10 input factors were considered in an ANN model, then within this frame-work, the baseline significance is at 10%. Since the objective of this study is to identify the rela-tive sensitivities, we do not
rec-ommend the omission of
relatively low sensitive factors in future modeling. Yet one may consider factors with RS below 2.5% (50% of the baseline sensi-tivity) as insignificant. Further targeted work is required to establish the practical interpre-tation of such a threshold.
[image:8.630.184.447.98.316.2]4.2. Sensitivity Results forKatt Figure 2a shows thatKattis more
sensitive to surface-related fac-tors, such as the coating concen-tration (RS525.7%), grain zeta-potential (RS58.3%), aspect ratio of NP (RS57.9%), and isoelectric point (IEP) of NP (RS55.6%), rather than pore-scale factors, such as dispersiv-ity (RS51.7%), heterogeneity (RS52.4%), and porosity (RS53.0%) (supporting information Table S4). The very high sensitivity ofKattto coating concentration, which is over 3 times higher than that of the next important
factor, the grain zeta-potential, is in agreement with a large number of experimental studies emphasizing the crucial role of NP surface coating, which can be various polymers (e.g., NOM, surfactant, and protein) or metal dopants such as Cu, in modifying the attachment of NP [Phenrat and Lowry, 2009;Phenrat et al., 2008, 2010a, 2010b;Wang et al., 2013].
In contrast, the free-polymer concentration appeared to have the least contribution to the attachment rate of NP (RS51:6%, supporting information Table S4). Free polymer is known to affect the attachment rates in several potentially conflicting ways. Higher concentration of free polymer can elevate the viscosity of the fluid [Becker et al., 2015]; it can block the attachment surfaces in competition with the NP [Becker et al., 2015;Wang et al., 2014b]; it can slow down the agglomeration process [Phenrat et al., 2010a]; on the other hand, in the presence of divalent cations polymer bridging can bring about a substantial level of agglomer-ation and deposition [Chen and Elimelech, 2006;Torkzaban et al., 2012;Wang et al., 2011b]. Our result, which is obtained for a broad range of NP and polymer types, e.g., NOM, surfactant, and protein, with a mean con-centration of100 mg/L (Table 1), suggests that these four effects counterbalance each other over a range of conditions. However, the bridging mechanism influence appears still to be the dominant process, because based on this investigation the trend between free-polymer concentration and the attachment rate is positive rather than negative (Figure 2a).
The aspect ratio of NP has a notable influence on the attachment rate (RS57:9%) with a negative correla-tion. Thus far, only few studies have addressed the effect of aspect ratio on the transport behavior of NP in porous media. It should be noted that here we define the aspect ratio as the ratio of the major dimension length to the minor dimension length of the particle, or plate diameter to plate thickness [Xu et al., 2008] which is different from the use of this terminology in colloid filtration theory literature [e.g.,Tufenkji and Elimelech, 2004a, 2004b] where it is interpreted as the ratio of particle to collector sizes. The reported trends for
Katt with aspect ratio include a rising trend for latex microsphere (aspect ratio range of 1:1–3:1) [Salerno et al.,
2006], a decreasing trend for carboxylate-modified fluorescent polystyrene NP (aspect ratio range of 1:1–4:1) under the favorable attachment conditions, and an increasing trend under the unfavorable conditions [Seymour et al., 2013]. Recently,Hedayati et al. [2016] compared the retention of cylindrical NP (multiwalled carbon nano-tubes) with spherical NP (C60) and observed that at low IS values (<11 mM) the spherical NP displayed a greater
mobility than the cylindrical NP whereas at a higher IS (60 mM) the mobility of cylindrical NP was considerably Figure 1.Ternary plot of heterogeneity parameter for the category of disturbed soils
higher than the spherical NP. In the present study which encompasses a broad range of aspect ratios from 1:1 to 1:3800 and also comprises the two-dimensional GO nanosheets, it appears that generally a higher aspect ratio results in a reduced attachment rate. Such interpretation is consistent with reduced translational diffusion because of the higher aspect ratios of particles [Ortega and de la Torre, 2003]. This can in turn decrease the mass transfer rate to the collector surface and thereby reducing the attachment rate. Initial particle size, however, is far less sensitive (RS52:2%). This might be because of the fact that the real size of the NP aggregates that con-trols the attachment rate is different from the initial size because of the occurrence of agglomeration within porous media as discussed below.
[image:9.630.62.573.73.486.2]Column length affected the attachment rate withRS56:9%, and with a positive correlation. It is complicated to draw any conclusion about this relationship since a variety of retention behaviors might occur along the length of the porous media which may not only involve the attachment process but also involve other phenomena, such as straining, site blocking, size exclusion, and agglomeration [Bradford et al., 2003;Braun et al., 2014;Liang et al., 2013a, 2013b;Raychoudhury et al., 2014;Saiers et al., 1994;Shen et al., 2008;Wang et al., 2012a, 2012b, 2015a, 2015b, 2015c, 2014a, 2014b]. Agglomeration of NP in porous media has been widely neglected in modeling studies. However, assuming that the agglomeration of NP is significant, the longer length of the col-umn may allow particles to agglomerate in sufficient time during their migration along the colcol-umn length. This can in turn intensify their consequent retention rates since the larger sizes of NP come with deeper energy min-imum wells and therefore higher retention rates [Babakhani et al., 2015;Phenrat et al., 2010a, 2009].
An increase in average pore water velocity causes a rise inKatt(RS54.4%). This agrees well with CFT which
suggests an increase in velocity promotes the mass transfer rate between the aqueous and attached phases whereby enhancing the attachment rate [Liang et al., 2013a;Logan et al., 1995;Yao et al., 1971]. This trend, however, contradicts with the study ofSeetha et al. [2015]. In the broad experimental data of NP transport used in this study, it is hard to figure out a linear or log linear model fit between velocity andKattdata. A
log linear fit between the logarithm transformed data of pore water velocity and logKattshows a poor
cor-relation coefficient of 0.2 (supporting information Figure S4). This line still demonstrates a positive slope (0.72) between the two variables. Therefore, here it is interesting to use the final ANN-based correlations, which will be discussed later, in order to compare the trend of predictedKatt versus pore water velocity
with correlations of other studies. We used the empirical correlations ofSeetha et al. [2015] forKattand
col-lector efficiencies ofPhenrat et al. [2010a] andTufenkji and Elimelech[2004a] to calculateKattbased on CFT.
[image:10.630.228.539.90.546.2]As shown in Figure 4, in the empirical model ofSeetha et al. [2015],Kattdecreases with velocity by a slope
Figure 3.Relative sensitivity outcomes for (a)Katt2and (b)C=C0with respect to 20 experimental factors. Green-colored bars indicate
of2272. However, according to the correlations of the present study,Kattincreases with the velocity with a
slope of 106.7. This is in agreement with the trend based on the correlations ofTufenkji and Elimelech
[2004a] yielding a positive slope of 440.0 and is also consistent with that ofPhenrat et al. [2010a] which yields a low positive slope of 0.76.
IS and pH have been among the most well-studied parameters in the context of NP transport because of their significant impacts revealed under individual experimental outcomes [e.g.,Liang et al., 2013a;Saleh et al., 2008;Shen et al., 2008;Wang et al., 2011a]. However, our analysis indicates they are not among the most crucial factors controlling the attachment rate as the most important parameter of the continuum model. Figure 5 shows modeling trends ofKattversus IS determined by the ANN-based correlation of this
study and by the correlations ofSeetha et al. [2015] andTufenkji and Elimelech[2004a]. It is evident that the impacts of the critical deposition concentration (CDC) and probably the critical coagulation concentration (CCC) [Grolimund et al., 2001] are reflected in the modeled curves of this study and those ofSeetha et al. [2015]. The decrease in the slope of the curve is slightly less in the present correlation compared to that of
Seetha et al. [2015] and CDC might not be clearly distinguishable in the current study’s results. It is reason-able because the current study’s model considers multiple NP types which may display various CCC and/or CDC. This comparison further shows that considering IS versus Katt, a satisfactory overall agreement
between the performances of this study’s model with others is obtained in the ranges of parameters used in this figure (given in the caption of Figure 5).
It should be noted that the low sensitivity of IS appears at odds with intuition based on major current concepts in colloid science, such as DVLO theory. One interpretation of the low sensitivity ofKattto IS
[image:11.630.222.546.97.336.2]is that the ranges of IS in the training data set are dominated by values above the CCC and CDC values Figure 4.Relationship betweenKattand the pore water velocity obtained from the final model of the present study,Seetha et al. [2015], and CFT, the collector efficiencies of which were obtained based on the correlations ofPhenrat et al. [2010a] orTufenkji and Elimelech
[2004a]. The input data for the pore water velocity were artificially generated in regular intervals and the rest of the input data were mostly selected similar toPhenrat et al. [2009]. These data were mostly in the ranges of simulated values inSeetha et al. [2015], except for Peclet number range which was extended to values above 50 when the velocity increased to more than 0.015 cm/min. The parameter values used here are a free-polymer concentration of 0 mg/L, a particle zeta-potential of230 mV, and a grain zeta-potential of250 mV, a particle diameter of 150 nm, a grain diameter of 0.15 mm, a NP density of 6.7 g/cm3
of major NP, after which attachment is less dependent or not dependent on the IS. Another possible interpretation is that the rate of attachment is more controlled by diffusion in the aqueous phase rather than the interaction energy minimum depth (controlled by IS), because once NP arrive in the vicinity of the surface of the collector, they can be retained no matter how deep the secondary mini-mum depth is. On the other hand, the effects of detachment processes (Kdet) may mask the role of IS
in attachment of NP, resulting in a less overall sensitivity for this factor as appeared in the result of the present study.
In terms of pH, it appears that the point of zero charge (PZC) or IEP, which is also taken into consideration as a factor in the model, is2.5 times more sensitive than pH (supporting information Table S4). Further-more, from the experimental viewpoint change in the pH may correspond to a simultaneous change in the zeta-potential. Therefore, it is possible that the effective role of pH in attachment rate is manifested in the model sensitivity results through IEP and zeta-potential rather than the pH itself. The ANN-based correlation trends, shown in supporting information Figure S5, reveal that our correlation predictions forKattis close to
those ofPhenrat et al. [2010a] when the saturation magnetization feature is considered nonzero, whereas they tend towardTufenkji and Elimelech[2004a] predictions when the saturation magnetization is assumed zero. The correlations ofPhenrat et al. [2010a] also consider the effect of particle magnetization while other current models do not. It might also suggest that when the particles are magnetic then the effect of solu-tion chemistry on the attachment rate is less pronounced because magnetic forces overshadow the solusolu-tion chemistry [Phenrat et al., 2010a].
4.3. Sensitivity Results forKdet
Figure 2b shows that the most important experimental factor in controlling the detachment rate is IS with
[image:12.630.194.577.97.323.2]RS514:8% and with a negative correlation, which is in agreement with other studies (supporting informa-tion Table S4) [e.g.,Bradford et al., 2015;Torkzaban et al., 2015]. Detachment of the attached particles should be mostly controlled by the strength of the forces between attached particle and the solid surface. This Figure 5.Relationship betweenKattand the IS obtained from the present study, andSeetha et al. [2015], as well as CFT, the collector effi-ciencies of which were obtained based on the correlation ofTufenkji and Elimelech[2004a]. The data were selected in the ranges of simu-lated values inSeetha et al. [2015], except forNE1andNDLthat were partly out of range. Most of experimental conditions used resembled those of [Wang et al., 2011a]. The parameter values are a free-polymer concentration of zero mg/L, a particle zeta-potential of240 mV, and a grain zeta-potential of250 mV, a particle diameter of 150 nm, a grain diameter of 0.15 mm, a NP density of 3.2 g/cm3
strength is related to depth of the DLVO minimum energy well which is in turn associated with IS [ Bergen-dahl and Grasso, 1999, 2000]. This is consistent with our observation that IS has a significant impact on detachment even though it was not highly sensitive forKatt, since the depth of the DLVO energy minimum,
is less important in determining the probability of entering it than of leaving it.
In contrast to the relatively low sensitivities obtained for factors representing the pore scale in the case of
Katt, for Kdet these factors, i.e., porosity (RS58:8%), heterogeneity (RS56:2%), and dispersivity (RS55:1%),
turned out to be among the most sensitive parameters, all showing a positive correlation. For particles which are already immobilized on the surface of grains, these factors may be more important, because they represent variation in the number and accessibility of low shear, low flow, and high-retention pore surface sites from which removal of particles by hydrodynamic forces may be difficult [Phenrat et al., 2010a;
Torkzaban et al., 2007].
Grain zeta-potential is also one of the most important three factors (RS56:2%) contributing to detachment rate as was also the case forKatt. The sensitivities to other factors are rather similar, and are ranging from
slightly below the baseline, i.e.,RS54:6% for particle zeta-potential down toRS53% for particle diameter.
4.4. Sensitivity Results forSm
Smrepresents the capacity of the porous media for retention of particles [Adamczyk et al., 1994; Saiers
et al., 1994]. Similar to the sensitivity results ofKatt andKdet, here the grain zeta-potential (RS511:6%) is
among the most sensitive factors along with the particle zeta-potential (RS57:2%) (Figure 2c and sup-porting information Table S4). According to this result when the zeta-potential increases (less negative), the capacity of the porous media to retain particles increases. High sensitivities are determined for factors related to the load of particles in porous media such as input concentration (RS57:2%) and the number of injecting PVs (RS55:6%) with a positive correlation—in agreement with elsewhere [Liang et al., 2013a;
Y. Sun et al., 2015]. The factors representing the available surface area such as column length, column diameter, aspect ratio, and porosity are also highly sensitive (RSranging from 4.9 to 9.3%) and show a direct relationship, which is in accordance with the underlying concept ofSmdescribing its capacity for
retaining particles and also in agreement withSaiers et al. [1994], mentioning a close correlation between the surface area andSm.
Similar to the sensitivity results ofKatt, here IS and pH are not among the most sensitive factors forSm—RS
is 3.2 and 4.2% for IS and pH, respectively. ElevatedSmwith the IS has been attributed to microscopic or
nanoscale surface heterogeneities since rising IS can screen the double layer and may therefore reduce the long range influence of these forces to below the influence range of microscopic heterogeneities [Liang et al., 2013a;Torkzaban et al., 2008]. In the light of the present modeling results forSm, which shows the
highest sensitivities for the factors related to the mean surface electrostatic charge, i.e., grain and particle zeta-potentials, while demonstrating two to fourfolds lower sensitivity for the IS, it is revealed that surface microscopic heterogeneities, even if important in triggering the IS-related influence on theSm, are still far
less relevant than the mean surface characteristics, such as zeta-potential, in controlling the capacity of the retention sites. This is also in line with the results of previous sections whereKattwas moderately sensitive
to IS whereasKdetwas most sensitive to IS among all the experimental features, suggesting that this is the
ionic strength and thereby the depth of the DLVO minimum that control the strength of the interfacial forces standing against the detachment of attached particles and not nanoscale and microscale surface het-erogeneities. Furthermore, according to the present results, the sensitivity ofSmto velocity is slightly below
the expected baseline sensitivity (RS54.3%) and velocity has an inverse relationship withSm(Figure 2c).
This negative relationship is in complete agreement with the hypothesis that larger torques resulting from fluid shear can reduce the quantity of retention sites with interactions at the secondary minimum [Liang et al., 2013a;Phenrat et al., 2009;Seetha et al., 2015;Torkzaban et al., 2007], also indicating against the domi-nation of microscopic heterogeneity over the secondary minimum interactions [Liang et al., 2013a].
4.5. Sensitivity Results forb
Forb50 an exponential RCP is expected whereas forb>0 one expects either a hyperexponential or uni-form RCP shape.
Our sensitivity analysis results forb(Figure 2d and supporting information Table S4) show that the most sensitive factor affecting the retention behavior of the NP is the influent concentration withRS512.0% and a direct relationship. This opposes the outcomes ofRaychoudhury et al. [2014] reporting a minor influence of influent CMC-NZVI concentration (ranging from 1.085 to 1.7 g/L) on the retention via straining, whereas this agrees with several other studies [Bradford et al., 2009;Kasel et al., 2013;Liang et al., 2013a;P. Sun et al., 2015] highlighting the effect of injected concentration on the depth-dependent behavior. Particle diameter is the second most important factor (RS58.7%) with a reverse association. This indicates the logic behind the use of particle-size to the grain-size ratio as a criteria for identifying whether or not straining is an underlying phenomena in transport of colloids [Bradford et al., 2002;Herzig et al., 1970;Shen et al., 2008]. However, the trend ofbwith particle size does not match that developed for traditional colloids, the reason for which is not clear. Recently, the use of these criteria in NP transport studies was criticized due to the potential role of agglomeration in altering the particle size during the transport in porous media (Johnson, 2011 #896).
Porous media heterogeneity showed a direct relationship (RS54.9%) while dispersivity revealed a negative correlation (RS52.8%). These trends perhaps suggest that higher heterogeneity, e.g., with more angular retention sites, can induce hyperexponential behavior or straining whereas a flow regime with higher dis-persivity gives more chance for detouring when the particles are going to be trapped in the contact angles in straining process.
4.6. Sensitivity Results forKatt2
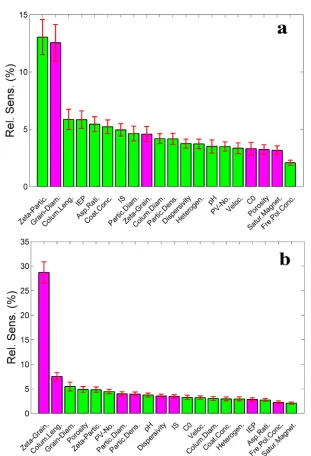
The results for the second site attachment rate is shown in Figure 3a and supporting information Table S4. The sensitivity ofKatt2 to particle zeta-potential and grain diameter was surprisingly high withRS513.0%
(positive correlation) andRS512.5% (negative correlation), respectively. In contradiction to the results of previous modeling parameters, particularly those ofKatt, where grain zeta-potential was mainly among the
most important factors, here it is the particle zeta-potential that is the most sensitive one, the increase of which promotes attachment in second sites. In spite of the fact that the aim of incorporatingKatt2 in the
continuum model is to capture the effect of secondary attachment sites, the conceptual model for using this parameter in the context of NP transport is not clear. We reinvestigated the literature studies and found that the common underlying phenomena reported by almost all of these papers [Cornelis et al., 2012;Fang et al., 2013;He et al., 2015;Qi et al., 2014a, 2014b;Rahman et al., 2013, 2014;P. Sun et al., 2015;Wang et al., 2012b, 2011b, 2014b] is agglomeration, although ripening and clogging have been reported as well [Hosseini and Tosco, 2013;Tosco and Sethi, 2010]. The current results clearly shows a high sensitivity to parti-cle zeta-potential, the increase of which (less negative) causes higher degree of agglomeration [Fan et al., 2015a, 2015b]. Interestingly, it matches the recently proposed model [Babakhani et al., 2015] in which the agglomeration model was linked with the continuum model through an additional first-order sink term which is mathematically similar toKatt2. Therefore, opposed to the proposed conceptual model for
deploy-ingKatt2, that is capturing the effect of secondary deposition sites, here it evident that this factor had to be
incorporated in models in order to represent the agglomeration effect on the transport of NP in porous media. The underlying reason for the high influence of grain diameter in curbingKatt2 is not clear. Yet if the
aforementioned conceptual model of agglomeration coexistence holds true, it suggests that agglomeration is more crucial for smaller grain diameters and thereby for narrower pore spaces than larger pore spaces. Experimental studies are needed to confirm this hypothesis.
4.7. Sensitivity Results forC=C0
(RS55.5%) with a positive correlation. The situation is similar for the porosity withRS54.9% and a direct relationship withC=C0, suggesting that after the surface charge and the filtration length, the dominant
fac-tors in controlling the transport of NP is the size of the pore space geometry. This is also in agreement with the study ofGoldberg et al. [2015] who found these factors moderately important. The load of particles, i.e., PV number and injecting concentration, are also moderately important predictors ofC=C0 withRS54.5%
andRS53.3%, respectively, with positive correlations.Goldberg et al. [2015] found these features even more important than the pore space geometry (porosity and grain diameter). Particle diameter is moderately sen-sitive (RS54.0%) and exhibits a negative correlation which is consistent with the current theories stating that larger deposition energy minima resulted from larger size cause less mobility. This is also in harmony with the concept of straining that larger particles have more chance of entrapment in grain-grain contact angles resulting in less mobility [Babakhani et al., 2015; Bradford et al., 2003;Phenrat et al., 2009;Tufenkji and Elimelech, 2004b].
The rest of parameters have relatively similar contribution toC=C0 withRS ranging from 3.9% down to
2.7%, except saturation magnetization withRS52:1% and free-polymer concentration withRS52:2%. The low sensitivity of free-polymer concentration, which was also the case in the results of modeling parameters discussed previously, suggests that the net contribution of this parameter might not be significant in the fate and transport of NP in the environment, since it causes equivocal influences on the transport phenom-ena as described previously. These results oppose those ofGoldberg et al. [2015] reporting the highest importance for the NOM concentration while the lowest importance for coating.
4.8. Model Validation
In this section we try to systematically validate the model predictions by comparing the performance ofKatt
predictions obtained via ANN with those resulted fromSeetha et al. [2015] and CFT, the collector efficiencies of which was determined afterTufenkji and Elimelech[2004a] orPhenrat et al. [2010a]. In doing so, we used the data of polymer-modified NZVI transport in saturated column experiments fromBabakhani et al. [2015] andPhenrat et al. [2009] for which the parameters of all four empirical models, namely, the present study,
[image:15.630.219.545.468.712.2]Seetha et al. [2015],Tufenkji and Elimelech[2004a], andPhenrat et al. [2010a], were available. For this pur-pose, instead of randomly dividing the data set into three categories of training, validation, and testing sets
in the ANN modeling procedure (described in supporting information), we designated the data from Baba-khani et al. [2015] andPhenrat et al. [2009] as the validation set and the rest of the data set as the training set (472 cases).
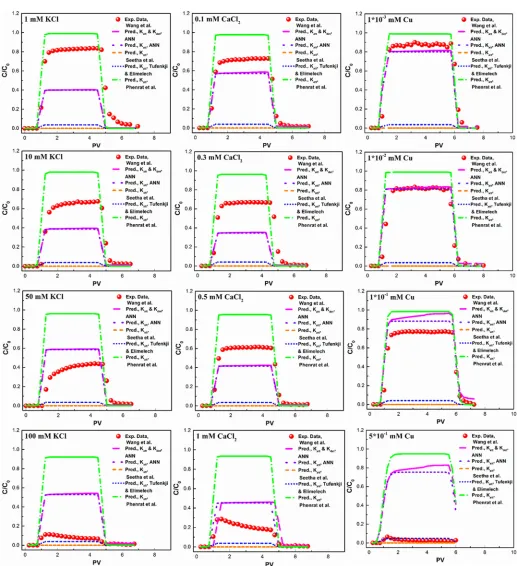
Figure 7.Testing the model predictions against experimental data ofWang et al. [2011a] (with permission from Elsevier) for various concentrations of KCl, CaCl2, and Cu as solution ionic
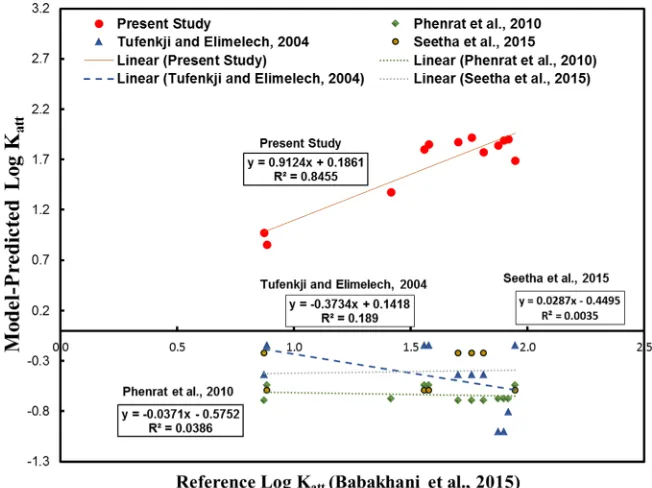
The results for this simulation are presented in Figure 6, which shows that none of the current models are able to predict Kattin the range of parameters used here. In sharp contrast, the ANN derived model
parame-terization can very closely predict theKattvalues obtained from calibration of the continuum model directly
to the data. It should be mentioned that the best network matrices chosen among 1000 iterations of the sensitivity analysis procedure were incorporated in a spreadsheet which can be easily used as empirical model for future predictions of a wide range of the continuum transport parameters orC=C0in the scale of
column experiment. The dimensions of the coefficient matrices in this model are comparable with those of
Seetha et al. [2015]. This spreadsheet is presented as supporting information.
4.9. Model Robustness
In the previous section an agreement was achieved between the predicted parameters by the ANN-based model and those determined by continuum model calibration in the literature. As a slight change in the values of continuum model parameters can significantly change the shape and/or position of the breakthrough curve, here it is worth to practically compare experimental BTCs with those generated using a continuum model based on the parameters predicted by this study’s correlations. To the best of our knowledge, only one studyLandkamer et al. [2013] has thus far performed this type of comparison, which was in a limited range of experimental parameters. For this study, we used MT3DMS code [Babakhani et al., 2015;Zheng and Wang, 1999] to generate the BTCs based on the prediction of the ANN-based model for either sets ofKattandKdet, or
Kattalone. The experimental BTC data of hydroxyapatite NP transport in porous media were used fromWang
et al. [2011a] which comprise transport in presence of humic acid together with either KCl or CaCl2as
electro-lyte or dissolved Cu as contaminant. Since the behavior of Cu21is deemed to be similar to that of Ca21, here
we added the concentration of Cu21as IS of the solution similar to that of Ca21.
As shown in Figure 7, the performance of the model with only one parameter,Katt, in reproducing BTCs at
mid-dle concentrations of KCl seems better (R250:53 andR250:43 for 10 mM and 50 mM KCl, respectively) than
that at low concentration of 1 mM (R250:22) and high concentration of 100 mM KCl (R2<0). Likewise, at high
concentration of divalent electrolyte (1 mM CaCl2),R2was less than zero, while at lower concentrations of 0.1,
0.3, and 0.5 mM CaCl2,R2values were 0.88, 0.30, and 0.74, respectively. Interestingly, the model was able to
cap-ture the BTC at low concentrations of Cu although such a data set, i.e., transport in presence of external contam-inant, had not been incorporated in the training phase of the ANN model. In these cases,R2values for 131023
mM, 131022mM, and 131021mM Cu were 0.92, 0.92, and 0.89, respectively. Yet similar to previous ionic spe-cies, at high concentration of Cu (531021mM), the model failed to predict experimental BTC (R2<0). The use
of parameter set ofKatt andKdetdid not change the result substantially—the differences of positiveR2values
between the two-parameter set and one-parameter set varied in the range of20.09 to 0.02.
The correlations proposed in this study overall show better performance than previous correlations in repro-ducing experimental BTCs based on mere experimental characteristics. However, still there are several cases where the model fails to predict the experimental BTC such as very high or low IS values. Although we used ‘‘early stopping’’ technique [Beale et al., 2015;Bishop, 1995;Coulibaly et al., 2000;Dehghani et al., 2014] along with a generalization efficiency criteria that selected the network with the best prediction performance in the iteration loops, there are other techniques that can be tried for improving the generalization of the model in future studies, e.g., Bayesian regularization.
5. Conclusions
This study used an artificial neural network to reanalyze a large data set of NP transport in porous media and develop nonlinear empirical correlations for predicting the continuum model parameters as well asC=C0. We analyzed the sensitivities of each continuum model parameter to experimental factors and determined the predominant and general trends between these parameters. Many interesting insights are gained from sensi-tivity analysis which can guide the future development of mechanistic models for predicting the fate and transport of NP as well as selections of influential factors for future modeling and experimental studies.
For instance, IS and pH were not as sensitive as coating concentration in determiningKatt. In contrast to the
cur-rent ambiguity regarding the trend of attachment rate with pore water velocity, ANN showed a clear positive correlation.Katt was more sensitive to the surface-related factors, than flow-regime-related factors whereasKdet
the solution. In the case ofSm, the factors relevant to the surface area, including column length, column
diame-ter, aspect ratio, and porosity were moderately to highly sensitive (RSranging from 4.9 to 9.3%). The most impor-tant feature in curbing the depth-dependent behavior of RCP was the influent concentration with a positive correlation. The pattern of sensitive factors aroundKatt2indicates toward the influence of agglomeration on the
NP transport rather than its commonly proposed conceptual model as the attachment rate of secondary sites.
The high sensitivity to grain zeta-potential was evident in almost all cases—ranging from 4.6 to 28.7%. This might oppose the important role of microscopic surface heterogeneities in transport of NP in porous media. Particle zeta-potential was mostly sensitive forSmandKatt2. One of the most well-studies factors in the
litera-ture, IS, showed a sensitivity in range of 2.9–14.8%. For the first time we considered a simple unified param-eter for the porous media hparam-eterogeneity, i.e., hparam-eterogeneity imposed by the nature of the soil sample (clean or treated laboratory porous media, disturbed, and undisturbed), grain coating, and grain size distribution. Although the conceptualization approach of this parameter was based on a series of simplifying rationale, its sensitivity turned out to be in range of 2.4–6.2%, suggesting that considering the porous media hetero-geneity in continuum modeling is even more important than dispersivity (RS51.7–5.1%) which has long been recognized as one of the most influential parameters affecting the transport of materials in porous media. Yet the development of the heterogeneity as a unified parameter from several relevant influences in this study is still in an infancy level and mainly aimed at satisfying the needs of the present study. Future studies are necessary to establish a more rigorous definition of heterogeneity as a unified parameter to be considered in continuum modeling of NP transport, as even a rough representation of this factor turned out to be significant. Here, the highest sensitivity to heterogeneity was revealed for theKdet.
The developed ANN-based correlations in this study performed very well in predicting the continuum model parameters, such asKattand turned out to be superior to current empirical correlation methods
avail-able in the literature of colloid and NP transport. Finally, we tried to reproduce the experimental break-through curves with continuum model based on the parameters fully predicted from our empirical correlations. From 12 cases of investigated BTCs, in three cases the model totally failed to predict BTCs (R2<0) which all involved very high IS values. Yet the model was able to predict other nine experimental
BTCs with a meanR2of 0:6560:26. The empirical correlations obtained in this study are formulated in a
spreadsheet file so that they can be easily tested against other data sets and used for future preestimation of continuum model parameters as well asC=C0.
References
Adamczyk, Z., B. Siwek, M. Zembala, and P. Belouschek (1994), Kinetics of localized adsorption of colloid particles,Adv. Colloid Interface Sci.,
48, 151–280.
Aggarwal, C. C. (2013),Outlier Analysis, Springer, New York.
Amoros, J. L., V. Beltran, V. Sanz, and J. C. Jarque (2010), Electrokinetic and rheological properties of highly concentrated kaolin dispersions: Influence of particle volume fraction and dispersant concentration,Appl. Clay Sci.,49(1), 33–43.
Aqil, M., I. Kita, A. Yano, and S. Nishiyama (2007), Analysis and prediction of flow from local source in a river basin using a Neuro-fuzzy modeling tool,J. Environ. Manage.,85(1), 215–223.
Babakhani, P., F. Fagerlund, A. Shamsai, G. V. Lowry, and T. Phenrat (2015), Modified MODFLOW-based model for simulating the agglomer-ation and transport of polymer-modified Fe nanoparticles in saturated porous media,Environ. Sci. Pollut. Res. Int., 1–20, doi:10.1007/ s11356-015-5193-0.
Beale, M. H., M. T. Hagan, and H. B. Demuth (2015),Neural Network ToolboxTM
User’s Guide, The MathWorks, Inc., Natick, Mass. [Available at www.mathworks.com.]
Becker, M. D., Y. Wang, K. D. Pennell, and L. M. Abriola (2015), A multi-constituent site blocking model for nanoparticle and stabilizing agent transport in porous media,Environ. Sci. Nano.,2(2), 155–166.
Bergendahl, J., and D. Grasso (1999), Prediction of colloid detachment in a model porous media: Thermodynamics,AIChE J.,45(3), 475–484. Bergendahl, J., and D. Grasso (2000), Prediction of colloid detachment in a model porous media: Hydrodynamics,Chem. Eng. Sci.,55(9),
1523–1532.
Bishop, C. M. (1995), Regularization and complexity control in feed-forward networks, inProceedings International Conference on Artificial Neural Networks ICANN’95, vol. 1, pp. 141–148, EC2 et Cie, Aston University, Birmingham, U. K.
Bolster, C. H., A. L. Mills, G. M. Hornberger, and J. S. Herman (1999), Spatial distribution of deposited bacteria following miscible displace-ment experidisplace-ments in intact cores,Water Resour. Res.,35(6), 1797–1807.
Bradford, S. A., and M. Bettahar (2006), Concentration dependent transport of colloids in saturated porous media,J. Contam. Hydrol.,82(1), 99–117.
Bradford, S. A., S. R. Yates, M. Bettahar, and J. Simunek (2002), Physical factors affecting the transport and fate of colloids in saturated porous media,Water Resour. Res.,38(12), 1327, doi:10.1029/2002WR001340.
Bradford, S. A., J. Simunek, M. Bettahar, M. T. van Genuchten, and S. R. Yates (2003), Modeling colloid attachment, straining, and exclusion in saturated porous media,Environ. Sci. Technol.,37(10), 2242–2250.
Bradford, S. A., J. Simunek, and S. L. Walker (2006a), Transport and straining ofE. coliO157: H7 in saturated porous media,Water Resour. Res.,42, W12S12, doi:10.1029/2005WR004805.
Acknowledgments