L
eurostat
Theme 2
Economy and finance
Series Β
Short-term trends
ISSN 1011-0844
ECU-EMS information
7-8 D 1994
Monthly
Evaluation of money market investments in various currencies on a 7 year period
The main purpose of the present study is monitoring the evolution of a one million ecu deposit invested in different currencies. The following assumptions have been made:
-On January 1st 1987, ie after a major realignment in the EMS deemed to bring the member currencies to equilibrium exchange rates, one invests one million ecu or its counter value in a one-month deposit account.
-In the end of each ensuing month, the principal plus the total accrued interests are re-invested in the same conditions, ie the position is rolled over.
-The interest rates used are those prevailing on the euromarket (Libid). -The amounts obtained every month are "converted" into ecus so as to ensure a basis for comparability.
-The interest and exchange rates applied are monthly averages of non weighted daily values.
-There are no transaction costs, no tax whatsoever and no restriction on capital movements.
We have displayed the results in two graphs. The first one includes the currencies with an "average" end of period return whereas the second one includes the currencies with an "extreme", good or bad, end of period return.
It can be observed that:
-Some currencies provided a 7 year return quite close to the return on the ecu (BFR, HFL, FF, OS, DM).
-Some currencies have had a relatively smooth evolution (in ecu terms) whereas others have shown a more turbulent performance. Among the currencies with a smooth behaviour are the BFR and the FF, especially until September 1992, when they slightly appreciated in relative terms. The currencies which followed a path more independent of the ecu are often located outside the EMS (FMK, DRA, USD, YEN...). These currencies have also followed a more oscillating path. These oscillations can be explained by the volatility of the exchange rates against the ecu. For example, the investment in yen underperformed the rest untili the middle of 1992, when the Japanese currency started to appreciate substantially and outperformed investments in any other currency. The british pound, the italian lira, the Portuguese escudo and the greek drachma are components of the ecu. However.the fluctuations of the pound and the lira around the ecu path is sometimes significant, in particular after September 1992, when these currencies left the ERM. Their behaviour may also be better understood if you consider that these two currencies usually pay
interest in excess of the average of the other currencies. It is interesting to observe that the drachma have had the highest return from afar. Its depreciation has not cancelled the high interest rate served on drachma deposits. The escudo, as well as the finnish marka, underperformed substancially the other currencies as a result of depreciation. It is interesting to observe that, over the period considered, investments in the USD have significantly underperformed investments in ecu. The observed oscillations on the investment in USD can be explained by the turbulent ecu/dollar exchange rate.
In order to have a better understanding of the performance of the different currencies, the average return of each currency expressed in ecu terms, in relation with the associated risk as measured by the standard deviation of monthly returns has been studied, (graph 3)
The most striking feature in this graph is a cloud of spots including the ecu component currencies plus the austrian schilling, which is virtually pegged to the deutsche mark, and the Swedish and norwegian krowns. It can also be observed that all the currencies, excluding the DRA, the USD, the ESC and the FMK, lies in a corridor defined by two upward sloping lines, (see graph). There seems to exist a relationship between risk and return for a majority of currencies.
There are two distinct groups in the corridor: the low risk group (ecu, BFR, FF, HFL.OS.DM, DKR and NKR) and the high risk group (PTA* LIT.SKR and UKL).
In the low risk group, the BFR and FF outperformed the DM and the closely associated HFL and OS whereas the risk is almost the same for these 5 currencies, the return on the BFR and FF is more than 100 bp higher.
In the high risk group, the PTA is the best performer, especially against LIT and SKR.
The figure also shows that investments in yen are in the corridor, but with an outstanding risk/return couple. The dollar is the riskiest currency and this is not compensated by the return as it lies under the previously defined corridor. The ESC and the FMK also underperformed substantially as their average return are the smallest ones and the associated risk lies between 12 and 20.
m
eurosta
OFICINA ESTADÍSTICA DE LAS COMUNIDADES EUROPEAS DE EUROPÆISKE FÆLLESSKABERS STATISTISKE KONTOR STATISTISCHES AMT DER EUROPÄISCHEN GEMEINSCHAFTEN ΣΤΑΤΙΣΤΙΚΗ ΥΠΗΡΕΣΙΑ ΤΩΝ ΕΥΡΩΠΑΪΚΩΝ ΚΟΙΝΟΤΗΤΩΝ STATISTICAL OFFICE OF THE EUROPEAN COMMUNITIES OFFICE STATISTIQUE DES COMMUNAUTÉS EUROPÉENNES ISTITUTO STATISTICO DELLE COMUNITÀ EUROPEE
BUREAU VOOR DE STATISTIEK DER EUROPESE GEMEENSCHAPPEN SERVIÇO DE ESTATÍSTICA DAS COMUNIDADES EUROPEIAS
L-2920 Luxembourg - Tél. 43 01-1 - Télex COMEUR LU 3423 B-1049 Bruxelles, rue de la Loi 200 - Tél. 299 11 11
Note
For any TEL:
FAX:
information + 352
on the statistics in this bulletin contact Luxembourg:
4301-34674 33288
32929
F.GARCIA-VALERO G. THOUVENIN
Eurostat
Monetary and Financial Statistics, Jean Monnet Building
A PC C4/04
L-2920 Luxembourg Contents
I. II. III. IV. V. VI. VII.
A graph of the bilateral fluctuations of the ERM currencies. Yearly and monthly issues of ecu bonds.
EMCF rate, interest rates on ecu deposits and yields on ecu bonds. Last month's ecu bond issues.
Consumer price indices in national currencies. Consumer price indices in ecus.
Yearly, monthly and daily ecu exchange rates.
ECSC-EC-EAEC, Brussels · Luxembourg, 1994
Reproduction is authorized, except for commercial purposes, provided the source is acknowledged.
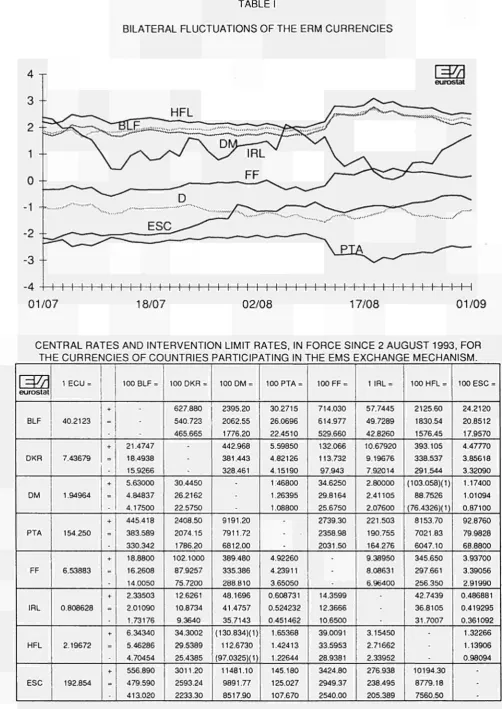
TABLE I
BILATERAL FLUCTUATIONS OF THE ERM CURRENCIES
I I I I I I I I I I I I 1 I I I I I I I I I I 1 I I I I I I I 1 I I I I I I I I I M
01/07
18/07
02/08
17/08
01/09
CENTRAL RATES AND INTERVENTION LIMIT RATES, IN FORCE SINCE 2 AUGUST 199G
TH
=
Jf
eurostat
BLF
DKR
DM
PTA
FF
IRL
HFL
ESC
ECURRENCI
1 ECU =
40.2123
7.43679
1.94964
154.250
6.53883
0.808628
2.19672
192.854 +
=
-+ -+=
-+ -+=
-+=
-+=
-+=
-ES OF COUNTRI-ES
100 BLF=
-21.4747 18.4938 15.9266 5.63000 4.84837 4.17500 445.418 383.589 330.342 18.8800 16.2608 14.0050 2.33503 2.01090 1.73176 6.34340 5.46286 4.70454 556.890 479.590 413.020100 DKR =
627.880 540.723 465.665
-30.4450 26.2162 22.5750 2408.50 2074.15 1786.20 102.100087.9257 75.7200 12.6261 10.8734 9.3640 34.3002 29.5389 25.4385 3011.20 2593.24 2233.30
PARTICIPATING IN THE EMS
100 DM =
2395.20 2062.55 1776.20 442.968 381.443 328.461
-9191.20 7911.72 6812.00 389.480 335.386 288.810 48.1696 41.4757 35.7143 (130.834)(1)112.6730 (97.0325)(1)
11481.10 9891.77 8517.90
100 PTA =
30.2715 26.0696 22.4510 5.59850 4.82126 4.15190 1.46800 1.26395 1.08800
-4.92260 4.23911 3.65050 0.608731 0.524232 0.451462 1.65368 1.42413 1.22644 145.180 125.027 107.670100 FF =
714.030 614.977 529.660 132.066 113.732 97.943 34.6250 29.8164 25.6750 2739.30 2358.98 2031.50
-14.3599 12.3666 10.6500 39.0091 33.5953 28.9381 3424.80 2949.37 2540.00Ì, FOR
EXCHANGE MECHANISM.
1 IRL =
57.7445 49.7289 42.8260 10.67920
9.19676 7.92014 2.80000 2.41105 2.07600 221.503 190.755 164.276 9.38950 8.08631 6.96400
-3.15450 2.71662 2.33952 276.938 238.495 205.389100 HFL =
2125.60 1830.54 1576.45 393.105 338.537 291.544 (103.058)(1)
88.7526 (76.4326)(1)
8153.70 7021.83 6047.10 345.650 297.661 256.350 42.7439 36.8105 31.7007
-10194.308779.18 7560.50
100 ESC =
24.2120 20.8512 17.9570 4.47770 3.85618 3.32090 1.17400 1.01094 0.87100 92.8760 79.9828 68.8800 3.93700 3.39056 2.91990 0.486881 0.419295 0.361092 1.32266 1.13906 0.98094
-(1) These buying and selling rates will not be operational. Reflecting a bilateral agreement between the German and the Dutch monetary authorities, the following rates will continue to apply: selling rate Fl. 100 in Frankfurt: DM 90.7700; buying rate Fl. 100 in Frankfurt: DM 86.7800; selling rate DM 100 in Amsterdam: Fl. 115.235; buying rate DM 100 in Amsterdam: Fl. 110.1675.
TABLE II
ECU BOND ISSUES (Mio ECU) *
M
eurostat
1988 1989 1990 1991 1992 1993
1992 IV 1993
I II III IV 1994
I II
J J A
TOTAL
9 248 11 127 15 040 27 163 19 242 6 870
80
1 980 1 130 1 070 2 690
2 4 1 0 1 815
165 150 445
European Community
Total
5 335 6 461 10 525 19 266 11675 5 020
80
1 480 630 770 2 140
2 285 1 215
65 150 295
Business sector
3 390 4 400 3 990 6 581 4 870 1 565
80
300 130 720 415
910 415
65 150 0
Govern-ments
100 500 5 000 7 900 2 475 250
0
0 250 0 0
1 150 0
0 0 0
Institutions
1 845 1 561 1 535 4 785 4 330 3 205
0
1 180 250
50 1 725
225 800
0 0 295
Total
3 9 1 3 4 666 4 515 7 897 7 567 1 850
0
500 500 300 550
125 600
100 0 150
Non-European Community
Business sector
3 138 4 141 3 565 3 932 3 902 250
0
0 0 200 50
125 200
100 0 150
Govern-ments
575 425 550 3 790 2 850 1 600
0
500 500 100 500
0 400
0 0 0
Organi-sations
200 100 400 175 815 0
0
0 0 0 0
0 0
0 0 0
C) Recording based on the payment date
TABLE III
OPERATIONS RATES OF THE EMI (CALCULATION MONTH, APPLICABLE THE FOLLOWING MONTH) AND INTEREST RATES AND YIELDS OF ECU INVESTMENTS (%)
=VA
eurostat1990 1991 1992 1993
1993
A
S O N D 1994
J F M
A M
J J
A
EMI
10.52 10.06 10.29 7 . 8 8 '
7.50 7.25 7.00 6.75*
6.25
6.25 6.25 6.00 6.00 5.75 5.75 5.75 5.75
Deposits
1 month
10.07 9.73 10.43 8 . 2 7 '
7.89 7.73 7.36 7.01 · 6.71
6.52 6.43 6.30 6.12 5.96 5.83 5.78 5.78
3 months
10.32 9.80 10.41 7.99*
7.61 7.50 7.30 6 . 8 6 '
6.37
6.29 6.27 6.18 6.05 5.75 5.84 5.88 5.86
6 months
10.55 9.84 10.27 7 . 6 5 '
7.16 6.98 6.94 6 . 5 9 ' 6.09
6.03 6.10 6.06 5.97 5.70 5.87 6.02 6.09
1 year
10.69 9.83 10.01 7.11 '
6.63 6.38 6.40 6.06*
5.68
5.57 5.76 5.93 5.91 5.70 6.08 6.26 6.46
3 years
6.740
6.394 6.295 6.148 5.822 5.493
5.351 5.659 6.170 6.401 6.589 7.167 7.283 7.562
Ecu
5 years
6.909
6.514 6.421 6.307 6.002 5.668
5.513 5.771 6.296 6.584 6.857 7.492 7.463 7.779
yield
7 years
7.137
6.840 6.650 6.461 6.262 5.974
5.800 6.103 6.646 6.937 7.179 7.825 7.786 8.055
10 years
7.187
6.915 6.632 6.527 6.445 6.131
5.950 6.228 6.754 7.039 7.300 7.811 7.767 8.046
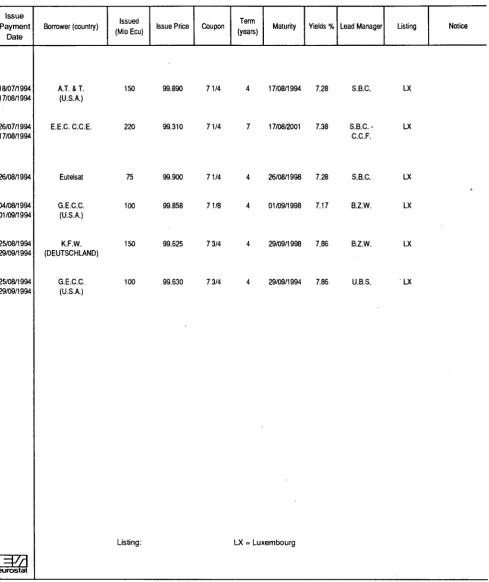
TABLE IV
LAST MONTH'S ECU BOND ISSUES
Issue Payment
Date
Borrower (country) Issued
(Mio Ecu) Issue Price Coupon Term
(years) Maturity Yields % Lead Manager Listing Notice
18/07/1994 17/08/1994
26/07/1994 17/08/1994
26/08/1994
04/08/1994 01/09/1994
25/08/1994 29/09/1994
25/08/1994 29/09/1994
AT. & T. (U.S.A.)
Eutelsat
G.E.C.C. (U.S.A.)
K.F.W. (DEUTSCHLAND)
G.E.C.C. (U.S.A.)
150 99.890 71/4 4
E.E.C.C.C.E. 220 99.310 71/4 7
Listing:
eurostat
17/08/1994
17/08/2001 7.28
7.38
S.B.C
S.B.C. C.C.F
75 99.900 71/4 4 26/08/1998 7.28 S.B.C.
100 99.858 71/8 4 01/09/1998 7.17 B.Z.W.
LX = Luxembourg
LX
LX
LX
LX
150 99.625 73/4 4 29/09/1998 7.86 B.Z.W. LX
TABLE V
CONSUMER PRICE INDICES IN NATIONAL CURRENCY
1985=100
Atf
B DK D ELL E F IRL I L NL Ρ UK EUR 12 ERM 1980 71.2 68.3 82.6 39.1 56.2 63.3 56.1 52.5 70.3 81.8 35.2 70.7 65.3 66.71990 1988
111.0 104.1 121.2 112.7 107.0 101.4 222.6 162.5 136.8 120.0 116.3 108.7 117.6 109.4 131.8 116.5 109.0 101.7 104.3 100.6 170.9 133.9 133.3 113.0 123.0 110.7 116.9 107.6 1989 107.3 118.1 104.2 184.9 128.2 112.7 113.9 123.7 105.1 101.7 150.8 121.8 116.4 111.9 1990 111.0 121.2 107.0 222.6 136.8 116.3 117.6 131.8 109.0 104.3 170.9 133.3 123.0 116.9 1991 114.6 124.1 110.7 264.7 145.0 120.0 121.3 140.2 112.4 108.4 189.5 141.1 129.1 122.4 1992 117.3 126.7 115.1 308.1 153.5 123.0 125.1 147.4 115.9 112.5 206.7 146.4 134.6 127.2
1993 1994
οι I
120.6 122.2 128.3 129.2 119.8 122.2 352.6 369.3 160.6 165.6 125.6 126.6 126.9 128.5 153.9 157.4 120.1 121.6 114.9 115.9 220.0 227.4 148.7 149.4 139.1 141.3 131.6 134.1 02 | 122.6 129.6 122.6 370.1 165.7 126.9 128.5 158.0 122.0 116.5 228.8 150.3 141.8 134.3 03 | 122.6 129.8 122.8 381.0 166.2 127.2 128.5 158.3 121.9 117.3 229.3 150.7 142.2 134.4 04 I 122.8 130.3 123.1 386.8 166.9 127.5 129.5 158.7 122.0 117.5 230.6 152.5 142.9 134.6 05 | 123.2 131.1 123.4 389.8 167.3 127.8 129.5 159.3 122.3 117.5 231.1 153.0 143.3 134.8 06 | 123.4 131.0 123.6 393.7 167.4 127.8 129.5 159.6 122.4 117.3 231.5 153.0 143.5 134.9 07 124.2 130.8 123.7 387.3 168.0 127.7 129.5 160.1 122.8 117.7 231.9 152.2 143.5 134.8Annual rate of increase (%)
=
M
eurostat Β DK D ELL E F IRL I L NL Ρ UK EUR 12 ERM EUR 12 ERM EUR 12 ERM 71-80 7.4 9.8 5.1 14.5 15.4 9.7 13.7 14.1 6.7 7.4 18.7 13.8 9.9 8.4 3.5 3.0 4.8 3.381-90 1988
4.6 1.2 5.9 4.6 2.6 1.2 19.0 13.5 9.3 4.8 6.3 2.7 7.8 2.1 9.7 5.1 4.5 1.4 2.5 0.9 17.3 9.6 6.6 4.9 6.6 3.6 5.4 2.7 2.4 1.8 2.5 1.4 4.1 2.8 2.9 1.9 1989 3.1 4.8 2.8 13.8 6.8 3.7 4.1 6.2 3.3 1.1 12.6 7.8 5.1 4.0 2.2 1.4 4.1 2.9 1990 3.4 2.6 2.7 20.4 6.7 3.2 3.2 6.5 3.7 2.5 13.3 9.4 5.7 4.5 2.7 1.8 Dis 3.5 2.3 1991 3.2 2.4 3.5 18.9 6.0 3.2 3.1 6.4 3.1 3.9 10.9 5.9 5.0 4.7 Aver 1.8 1.4 parity be 2.7 2.3 1992 2.4 2.1 4.0 16.4 5.9 2.5 3.1 5.1 3.1 3.8 9.1 3.8 4.3 4.1 age devi 1.2 0.9 tween th 2.3 2.0
1993 1994
01 I 2.8 2.4 1.3 1.8 4.1 3.5 14.5 11.1 4.6 5.0 2.1 1.9 1.4 1.7 4.5 4.4 3.6 2.6 2.1 3.0 6.5 6.4 1.6 2.5 3.4 3.4 3.3 3.1
ation around the mean
1.4 1.1 1.0 0.9 02 | 2.5 1.8 3.4 11.0 5.0 1.8 1.7 4.4 2.6 3.0 6.1 2.4 3.3 3.1 1.1 0.9
e average and the minimum
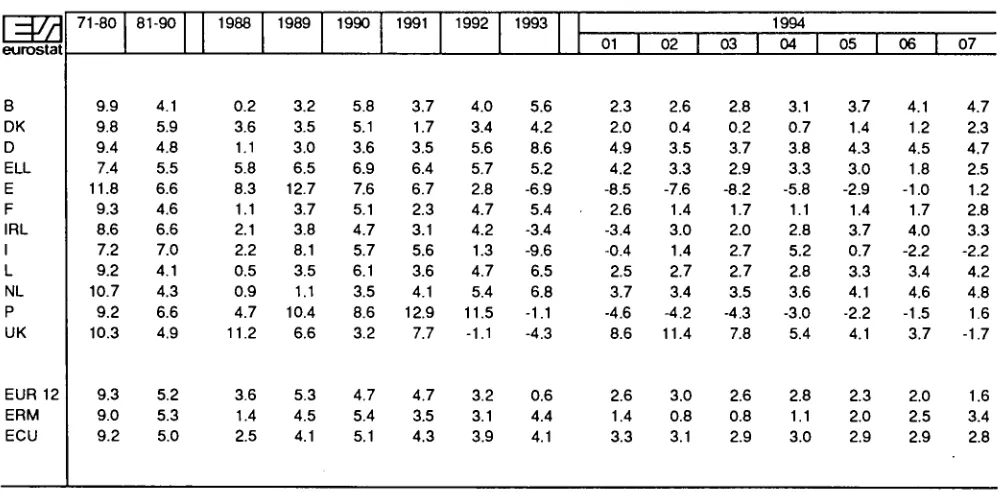
TABLE VI
CONSUMER PRICE INDICES IN ECU
1985=100
A
eurostat Β DK D ELL E F IRL I L NL Ρ UK EUR 12 ERM ECU 1980 78.7 70.0 72.9 68.6 72.7 73.1 58.5 63.8 77.7 74.4 65.8 69.7 70.9 71.3 71.71990 1988
117.5 107.6 123.7 113.7 116.1 108.8 114.9 100.9 136.4 112.5 114.3 105.0 109.3 100.6 125.2 109.6 115.4 105.2 113.2 108.2 122.6 102.3 110.0 100.2 117.8 106.8 119.0 108.0 117.0 106.9 1989 111.1 117.7 112.1 107.5 126.8 108.9 104.4 118.5 108.8 109.4 112.9 106.6 112.5 112.9 111.3 1990 117.5 123.7 116.1 114.9 136.4 114.3 109.3 125.2 115.4 113.2 122.6 110.0 117.8 119.0 117.0 1991 121.9 125.8 120.2 122.2 145.5 116.9 112.7 132.2 119.6 117.8 138.4 118.5 123.3 123.2 122.0 1992 126.7 130.1 126.9 129.8 149.6 122.3 117.4 133.9 125.2 124.2 153.8 117.3 127.2 127.0 126.8
1993 1994
01 I 133.8 136.0 135.5 137.4 137.8 140.8 136.6 137.8 139.3 133.9 128.7 130.4 113.4 117.4 120.9 120.1 133.3 135.4 132.6 133.9 152.1 150.6 112.2 117.8 127.9 129.7 134.0 127.8 131.0 133.2 02 | 137.7 137.3 140.6 137.5 135.4 130.7 116.5 121.2 136.9 134.5 151.7 117.0 129.9 126.9 133.5 03 | 138.3 137.5 141.6 140.7 135.2 131.3 115.5 120.1 137.6 135.7 149.9 115.8 129.9 127.2 133.8 04 | 138.5 137.8 141.7 141.9 136.8 130.7 116.2 123.9 137.6 135.8 151.6 116.8 130.9 128.3 134.3 05 | 139.2 139.1 142.3 141.9 135.6 131.3 116.7 124.1 138.2 136.2 150.5 116.3 131.1 130.3 134.5 06 l 139.7 139.1 142.7 141.2 135.7 131.8 116.9 122.4 138.4 136.3 150.5 116.0 130.9 130.6 134.6 07 141.1 139.2 143.6 139.1 136.9 132.1 115.8 121.1 139.6 137.3 152.9 1.13.3 130.6 130.2 131.5
Annual rate of increase (%)
=
Jr
eurostat Β DK D ELL E F IRL I L NL Ρ UK EUR 12 ERM ECU 71-80 9.9 9.8 9.4 7.4 11.8 9.3 8.6 7.2 9.2 10.7 9.2 10.3 9.3 9.0 9.2
81-90 1988
4.1 0.2 5.9 3.6 4.8 1.1 5.5 5.8 6.6 8.3 4.6 1.1 6.6 2.1 7.0 2.2 4.1 0.5 4.3 0.9 6.6 4.7 4.9 11.2 5.2 3.6 5.3 1.4 5.0 2.5 1989 3.2 3.5 3.0 6.5 12.7 3.7 3.8 8.1 3.5 1.1 10.4 6.6 5.3 4.5 4.1 1990 5.8 5.1 3.6 6.9 7.6 5.1 4.7 5.7 6.1 3.5 8.6 3.2 4.7 5.4 5.1 1991 3.7 1.7 3.5 6.4 6.7 2.3 3.1 5.6 3.6 4.1 12.9 7.7 4.7 3.5 4.3 1992 4.0 3.4 5.6 5.7 2.8 4.7 4.2 1.3 4.7 5.4 11.5 -1.1 3.2 3.1 3.9
1993 1994
TABLE VII
ECU EXCHANGE RATES
1985 1986 1987 1988 1989 1990 1991 1992 1993 93/08 93/09 93/10 93/11 93/12 94/01 94/02 94/03 94/04 94/05 94/06 94/07 94/08 08/01 08/02 08/03 08/04 08/05 08/08 08/09 08/10 08/11 08/12 08/15 08/16 08/17 08/18 08/19 08/22 08/23 08/24 08/25 08/26 08/29 08/30 08/31
B/LFR DKR
-Vf
eurostat 44.9137 43.7979 43.0410 43.4285 43.3806 42.4257 42.2233 41.5932 40.4713 40.7313 41.0548 41.4857 40.8884 40.3146 40.3580 40.0000 39.7980 39.8323 39.7402 39.6927 39.5323 39.4299 39.4920 39.5113 39.5209 39.4993 39.5227 39.5254 39.5069 39.4824 39.4791 39.3887 39.3532 39.3546 39.3539 39.3441 39.3554 39.3359 39.3490 39.3996 39.3963 39.3792 39.4328 39.4565 39.4483 8.01877 7.93565 7.88472 7.95152 8.04929 7.85652 7.90859 7.80925 7.59359 7.83353 7.83300 7.71285 7.63939 7.56812 7.54171 7.56953 7.56754 7.58603 7.55863 7.55808 7.53595 7.56621 7.55375 7.55248 7.55313 7.54902 7.55645 7.55258 7.55655 7.56225 7.57759 7.57463 7.56963 7.58064 7.58463 7.58331 7.56374 7.55084 7.55172 7.57299 7.57691 7.57251 7.58320 7.58023 7.56413 DM 2.22632 2.12819 2.07153 2.07440 2.07015 2.05209 2.05076 2.02031 1.93639 1.92126 1.91165 1.90647 1.91956 1.93091 1.94163 1.94082 1.93113 1.93467 1.93076 1.92800 1.91818 1.91357 1.91824 1.91955 1.91991 1.91923 1.92006 1.91994 1.91845 1.91644 1.91639 1.90841 1.90832 1.90879 1.91007 1.90600 1.90782 1.90729 1.90885 1.91026 1.91117 1.91055 1.91415 1.91609 1.91619 DRA 105.739 137.425 156.268 167.576 178.840 201.412 225.216 247.026 268.568 269.231 273.811 276.322 274.968 276.996 278.817 280.085 281.644 283.714 285.832 289.972 289.751 289.807 290.035 290.136 289.911 289.901 289.990 289.990 289.727 289.426 289.564 289.127 289.958 289.178 289.274 288.891 289.488 289.455 289.682 289.850 290.130 290.062 290.345 290.669 290.782 ESC 130.252 147.088 162.616 170.059 173.413 181.109 178.614 174.714 188.370 196.343 196.052 197.089 196.356 197.082 196.212 195.976 198.705 197.568 199.416 199.872 197.036 195.458 195.154 195.537 195.755 195.541 195.063 195.192 195.075 194.785 195.366 196.031 196.115 195.863 195.910 195.977 195.714 195.974 195.578 195.457 195.399 195.252 194.959 194.817 195.026FF HFL IRL
EXPLANATORY NOTES
Bilateral currency deviation (graph on page 3).
The various curves should be compared in pairs. To find the differential between two currencies, subtract the (positive or negative) values along the y-axis corresponding to each currency.
The graph is drawn with the curve of the strongest currency above that of the weakest. It shows therefore the relative position of each currency vis-à-vis the other currencies.
When two curves intersect or merge over a period of time there is no differential between the two currencies and their market exchange rate equals their bilateral central rate.
The graph is drawn within a horizontal band corresponding to the maximum 15% margin of fluctuation applying at any given moment to market exchange rates and the bilateral central rates of the ERM currencies. This band is divided symmetrically by a horizontal axis along which the points would be plotted if all currencies were at their bilateral central rate and there were therefore no fluctuations.
The daily market exchange rates of all currencies are compared with the relevant bilateral central rates and the differentials between the two calculated.
The maximum fluctuation between two currencies is shown within the band, symmetrical with the horizontal axis. The fluctuations of the other currencies in relation to either of the two currencies in question are shown within the maximum permissible fluctuation.
The curves are drawn by linking the daily points showing the relative positions of each currency.
Exchange rate grid (Table I).
The intervention limit rates fixed in the official grid do not always correspond exactly to + or - 15 % of the central rates, since for each currency pair (whose exchange rates are inversely proportional to one another) the lower limit of the one corresponds to the upper limit of the other.
Ecu bond issues (Table II & IV).
In table II, issues are recorded as at the payment date. This bulletin only covers international and foreign issues in ecus, including ecu issues offering the option of conversion into other currencies. Main source:
International Financing Review
Table II shows, under the headings:
-Business sector and Governments: national issuers, both private and public.
-Institutions: the European Investment Bank and the Commission of the European Communities (EEC, ECSC, Euratom).
-Organizations: the specialist institutions of the United Nations, the World Bank, the Council of Europe, etc
Table IV shows detailled information of the latest known issues, whatever the payment date.
Interest rates and yields on ecu investments (Table III).
The interest rates for 1, 3, 6, months and 1 year deposits are calculated on the basis of the London market rates LIBID as follows:
- until October 1993 : (source: Financial Times, Friday rate).
- from November 1993 : (source : Bank of England, British Banker's Association, daily rates).
The yields of ecu bonds at 3, 5, 7 and 10 years are those provided by Eurostat's yield curve. These are redemption yields. Eurostat's yield curve, which portrays the interest rate structure of maturities ranging from 1 to 10 years, is based on highest quality issues with a triple-Α rating of at least ecu 500 million outstanding, with a very high liquidity (bid-offer spread less than 50 basis points). The curve is calculated daily by fitting by regression a third order polynomial function to the price/yield values of bonds provided by ISMA (International Securities Market Association, London). These values reflect the mean of bid and offered prices communicated by a comprehensive range of financial institutions. The monthly figures included in the table are the non-weighted arithmetic average of daily figures whereas the yearly figures are the non-weighted arithmetic average of monthly figures.
Operations rates of the EMI (Table III).
Consumer price indices in national currency (Table V).
The consumer price indices in the national currency of each country measure changes in the purchasing power of one unit of national currency spent in the country concerned;
Two composite indices are calculated, covering all the Member States of the Community (EUR 12) and the nine Member States with currencies participating in the European Monetary System exchange rate mechanism (ERM). (Although the peseta has been participating in the exchange rate mechanism since 19/06/89 and has been included in the calculation of the ecu since 21/09/89, it is only taken into account in the indices relating to the ERM which are included in this bulletin for data after 30/09/89.)
These indices are calculated as weighted arithmetic means (chain indices) of the national indices, the weighting for each Member State being its relative share in the final consumption of households of the group of countries in question (EUR 12, ERM), expressed in purchasing power standards, at current prices and purchasing power parities.
At the foot of the table, the average weighted fluctuations around the mean and the minimum are given for the same groups of countries, with the same weightings. (These are calculated as weighted averages of the absolute fluctuations in relation to the mean and the minimum respectively). They show the degree to which price movements in the Member States in the Community converge.
Consumer price indices in ecus (Table VI).
For each country the index of consumer prices in ecus is calculated by dividing the national consumer price index by the average movement of the national currency in relation to the ecu during the month. It measures the change in the purchasing power of one ecu in the country concerned.
Three composite indices are calculated, covering all the Member States of the Community (EUR 12 and ECU), the 9 Member States participating in the European Monetary System exchange rate mechanism (ERM). (Although the peseta has been participating in the exchange rate mechanism since 19/06/89 and has been included in the calculation of the ecu since 21/09/89, it is only taken into account in the indices relating to the ERM which are included in this bulletin for data after 30/09/89.)
These three indices are calculated as weighted arithmetic means (chain-indices). The weightings are defined as follows: for the EUR 12 and ERM indices, the relative share of each Member State in the final consumption of households for the group of countries in question (EUR 12 or ERM), expressed in ecus at current prices and exchange rates (annual weighting). For the ECU index, the relative share of each Member State's currency in the calculation of the ecu (monthly weighting).
Ecu exchange rates (Table VII).
The exchange rates for the ecu against the national currencies of the Member States of the Community, the USD and yen are shown as annual averages, monthly averages (for the current year), and daily rates (for the latest available month).
I=M
eurostat1ecu =
100 =
BFR DKR DM DRA* ESC FF HFL IRL LFR LIT* PTA
From 21/09/89 the ecu basket has been made up as follows :
3.301 0.1976 0.6242 1.44 1.393 1.332 0.2198 0.008552 0.13 151.8 6.885
Ecu central rates from 14/05/93
40.2123 7.43679 1.94964 264.513 192.854 6.53883 2.19672 0.808628 40.2123 1793.19 154.250
Weights of currencies on 14/05/93, calculated on the basis of current central rates, expressed in
8.21 2.66 32.02 0.54 0.72 20.37 10.01 1.06 0.32 8.47 4.46
UKL*
0.08784
0.786749
% : 11.16
does not participate in the exchange rate mechanism.
Venta y suscripciones · Salg og abonnement · Verkauf und Abonnement · Πωλήσεις και συνδρομές
Sales and subscriptions · Vente et abonnements · Vendita e abbonamenti
Verkoop en abonnementen · Venda e assinaturas
BELGIQUE/BELGIË ITALIA SCHWEIZ / SUISSE / SVIZZERA ISRAEL
Moniteur belge / Belgisch staatsblad
Rue de Louvain 42 / Leuvenseweg 42 1000 Bruxelles / 1 0 0 0 Brussel Tél. (02)512 00 26 Fax (02) 511 01 84
Jean De Lannoy
Avenue du Roi 202 / Koningslaan 202 1060 Bruxelles/1060 Brussel Tél. (02)538 51 69 Télex 63220 UNBOOK Β Fax (02) 538 08 41 Autres distributeurs/ Overige verkooppunten:
Librairie européenne/ Europese boekhandel
Rue de la Loi 244/Wetstraat 244 1040 Bruxelles / 1 0 4 0 Brussel Tél. (02) 231 04 35 Fax (02) 735 08 60 DANMARK
J. H. Schultz Information A/S
Herstedvang 10-12 2620 Albertslund Tlf. 43 63 23 00 Fax (Sales) 43 63 19 69 Fax (Management) 43 63 19 49 DEUTSCHLAND
Bundesanzeiger Verlag
Breite Straße 78-80 Postlach 10 05 34 50445 Köln Tel.(02 2 1 ) 2 0 29-0 Fax (02 21) 202 92 78 GREECE/ΕΛΛΑΔΑ
G . C Eleftheroudakis SA
International Bookstore Nikis Street 4 10563 Athens Tel. (01)322 63 23 Telex 219410 ELEF Fax 323 98 21 ESPANA
Boletín Oficial del Estado
Trafalgar. 27-29 28071 Madrid Tel. (91)538 22 95 Fax (91 )538 23 49 Mundi-Prensa Libros, SA
Castello. 37 28001 Madrid
Tel. (91)431 33 99 (Libros) 431 32 22 (Suscripciones) 435 36 37 (Dirección) Télex 49370-MPLI-E Fax (91) 575 39 98 Sucursal:
Librería Internacional AEDOS
Consejo de Ciento. 391 08009 Barcelona Tel. (93) 488 34 92 Fax (93) 487 76 59
Llibreria de la Generalität de Catalunya
Rambla dels Estudis. 118 (Palau Moja) 08002 Barcelona
Tel. (93) 302 68 35 Tel. (93) 302 64 62 Fax (93) 302 12 99 FRANCE
Journal officiel Service des publications des Communautés européennes
26. rue Desaix 75727 Paris Cedex 15 Tél. (1)40 58 77 01/31 Fax (1)40 58 77 00 IRELAND
Government Supplies Agency
4-5 Harcourt Road Dublin 2 Tel (1)66 13 111 Fax (1)47 80 645
Licosa SpA
Via Duca di Calabria 1/1 Casella postale 552 50125 Firenze Tel. (055) 64 54 15 Fax 64 12 57 Telex 570466 LICOSA I
Messageries du livre
5. rue Raiffeisen 2411 Luxembourg Tél. 40 10 20 Fax 49 06 61 NEDERLAND
SDU Overheidsinformatie
Externe Fondsen Postbus 20014 2500 EA s-Gravenhage Tel (070) 37 89 880 Fax (070) 37 89 783 PORTUGAL
ICELAND
BOKABUD LARUSAR BLÖNDAL
Skólavõrdustig. 2 101 Reykjavik Tel. 11 56 50 Fax 12 55 60
OSEC
Stamptenbachstraße 85 8035 Zürich
Tel. (01)365 54 49 Fax (01) 365 54 11
GRAND-DUCHE DE LUXEMBOURG
Imprensa Nacional Casa da Moeda. EP
Rua D. Francisco Manuel de Melo. 1092 Lisboa Codex
Tel. (01 ) 387 30 02/385 83 25 Fax (01) 384 01 32
Distribuidora de Livros Bertrand. Ld.a
Grupo Bertrand, SA
Rua das Terras dos Vales. 4-A Apartado 37
2700 Amadora Codex
Tel. (01)49 59 050
Telex 15798 BERDIS Fax 49 60 255 UNITED KINGDOM
HMSO Books (Agency section)
HMSO Publications Centre 51 Nine Elms Lane London SW8 5DR Tel.(071)873 9090 Fax 873 8463 Telex 29 71 138 ÖSTERREICH
Manz'sche Verlags
und Universitätsbuchhandlung
Kohlmarkt 16 1014 Wien Tel. (1)531 610 Telex 112 500 BOX A Fax (1) 531 61-181 SUOMI/FINLAND
Akateeminen Kirjakauppa
Keskuskatu 1 PO Box 218 00381 Helsinki Tel. (0) 121 41 Fax (0) 121 44 41 NORGE
Narvesen Info Center
Bertrand Narvesens vei 2 PO Box 6125 Etterstad 0602 Oslo 6 Tel. (22) 57 33 00 Telex 79668 NIC N Fax (22) 68 19 01 SVERIGE
BTJ AB
Traktorvgen 13 22100 Lund Tel. (046) 18 00 00 Fax (046) 18 01 25 30 79 47
BALGARIJA
Europress Klassica BK Ltd
66. bd Vitosha 1463 Sofia Tel./Fax 2 52 74 75 CESKA REPUBLIKA
NIS CR
Havelkova 22 130 00 Praha 3 Tel. (2) 24 22 94 33 Fax (2) 24 22 14 84 HRVATSKA
Mediatrade
P. Hatza 1 4100 Zagreb Tel.(041)430 392 MAGYARORSZAG
EuroInfoService
Honvéd Europa Haz Margitsziget 1138 Budapest Tel/Fax 1 111 60 61 1 111 62 16 POLSKA
Business Foundation
ul. Krucza 38/42 00-512 Warszawa Tel. (2) 621 99 93. 628-28-82 International Fax&Phone
(0-39) 12-00-77
ROMANIA
Euromedia
65. Strada Dionisie Lupu 70184 Bucuresti Tel/Fax 1-31 29 646 RUSSIA
CCEC
9,60-letiya Oktyabrya Avenue 117312 Moscow
Tel/Fax (095) 135 52 27 SLOVAKIA
Slovak Technical Library
Nrn. slobody 19 812 23 Bratislava 1 Tel. (7)5220 452 Fax : (7) 5295 785 CYPRUS
Cyprus Chamber of Commerce and Industry
Chamber Building 38 Grivas Dhigenis Ave 3 Deligiorgis Street PO Box 1455 Nicosia
Tel. ( 2 ) 4 4 9 Ü 0 0 M O ¿ 3 1 2
Fax (2) 458630 MALTA
Miller distributors Ltd
PO Box 25
Malta International Airport LOA 05 Malta Tel. 66 44 88 Fax 67 67 99 TURKIYE
Pres AS
Istiklal Caddesi 469 80050 Tünel-Istanbul
Tel. 0(212) 252 81 41 - 251 91 96 Fax 0(212) 251 91 97
ROY International
PO Box 13056
41 Mishmar Hayarden Streel Tel Aviv 61130
Tel. 3 496 108 Fax 3 648 60 39
EGYPT/ MIDDLE EAST
Middle East Observer
41 Sherif St. Cairo
Tel/Fax 39 39 732
UNITED STATES OF AMERICA / CANADA
UNIPUB
4611-F Assembly Drive Lanham. MD 20706-4391 Tel. Toll Free (800) 274 4888 Fax (301) 459 0056
CANADA Subscriptions only Uniquement abonnements
Renouf Publishing Co. Ltd
1294 Algoma Road Ottawa. Ontario K1B 3W8 Tel. (613)741 43 33 Fax (613) 741 54 39 Telex 0534783
AUSTRALIA
Hunter Publications
58A Gipps Streel Collingwood Victoria 3066 Tel. (3)417 5361 Fax (3) 419 7154
JAPAN
Kinokuniya Company Ltd
17-7 Shinjuku 3-Chome Shinjuku-ku
Tokyo 160-91 Tel. (03) 3439-0121
Journal Department
PO Box 55 Chitóse
Tokyo 156
Tel. (03) 3439-0124
SOUTH-EAST ASIA
Legal Library Services Ltd
Orchard PO Box 05523 Singapore 9123 Tel. 73 04 24 1 Fax 24 32 47 9
SOUTH AFRICA
Safto
5th Floor, Export House Cnr Maude & West Streets Sandton2146
Tel. (011)883-3737 Fax (011 ) 883-6569
AUTRES PAYS OTHER COUNTRIES ANDERE LÄNDER
Office des publications officielles des Communautés européennes
S2
e u r o s t a t
/ '
06/87 04/68 12/66 08/8« 04/90 1?'90 08/91 04/92 12/92 08/93 04/94
eurostat
Price (excl. VAT) in Luxembourg: Single copy ECU 1 1 · Subscription: ECU 79
OFICINA DE PUBLICACIONES OFICIALES DE LAS COMUNIDADES EUROPEAS KONTORET FOR DE EUROPÆISKE FÆLLESSKABERS OFFICIELLE PUBLIKATIONER AMT FÜR AMTLICHE VERÖFFENTLICHUNGEN DER EUROPÄISCHEN GEMEINSCHAFTEN ΥΠΗΡΕΣΙΑ ΕΠΙΣΗΜΩΝ ΕΚΔΟΣΕΩΝ ΤΩΝ ΕΥΡΩΠΑΪΚΩΝ ΚΟΙΝΟΤΗΤΩΝ
OFFICE FOR OFFICIAL PUBLICATIONS OF THE EUROPEAN COMMUNITIES OFFICE DES PUBLICATIONS OFFICIELLES DES COMMUNAUTÉS EUROPÉENNES UFFICIO DELLE PUBBLICAZIONI UFFICIALI DELLE COMUNITÀ EUROPEE BUREAU VOOR OFFICIËLE PUBLIKATIES DER EUROPESE GEMEENSCHAPPEN SERVIÇO DAS PUBLICAÇÕES OFICIAIS DAS COMUNIDADES EUROPEIAS