International Journal of Innovative Technology and Exploring Engineering (IJITEE) ISSN: 2278-3075, Volume-8, Issue- 9S2, July 2019
Abstract— This paper presents the results of an experimental investigation to study the effectiveness of the control jets to control base pressure in rapidly expanded circular tubes. Four tiny jets of 1 mm orifice diameter located at ninety degrees interval in cross shape along a pitch circle diameter of 1.3. The Mach number, the L/D ratio, and the area ratio of the study were 2.8, from 1 to 10, and 4.84, respectively. The nature of the flow field, the development of the flow in the duct, as well as the static wall pressure distribution in the duct was measured and discussed. The results indicate that the tiny jets can be used as an active dynamic controller for the base pressure. The wall pressure distribution is not adversely influenced by the small jets. From the present investigation, it is evident that for a given Mach number and nozzle pressure ratio one can identify the minimum duct L/D needed for the flow remained attached with the wall of the duct. The trend for the duct length L = 5D seems to show different results, due to the influence of back pressure and the peak pressure values are also less than that those were for higher L/D ratios, especially in respect of L/D = 5. Further, the flow field has smoothened in the duct, and wall pressure values with and without micro jets are identical. This trend continues until L/D = 4, then later for lower L/Ds like L/D = 3, the flow seems to be attached at higher NPRs. But for lower NPRs the flow is not attached.
Keywords— Nozzle, Area ratio, Nozzle pressure ratio, Microjet, Flow Control.
INTRODUCTION
The flow over a rounded base experiences a sudden increase in the area at the base corner as the turbulent boundary layer separates at the exit of the nozzle and forms a free shear layer. Later in the downstream, this shear layer undergoes compression, recompression, and expansion in the wake region of the duct, later it is turned outward along the geometrical axis of the body. The shear layer entrains the fluid from the central jet region in this process. The study with the internal flow has many distinct advantages over the study done with an external flow. The enormous volume of air supply which needed to conduct the wind tunnel tests. As it is essential to simulate the flow in a wind tunnel with test-section large enough so that the boundary layer and the wall interference of the test section do not influence and disturbs the flow over the model. These measured values are valuable, especially in the case if one
Revised Manuscript Received on July 18, 2019.
Mohammad Nishat Akhtar, School of Aerospace Engineering, Universiti Sains Malaysia14300 Nibong Tebal, Penang, Malaysia. (E-mail: [email protected])
Elmi Abu Bakar, School of Aerospace Engineering, Universiti Sains
Malaysia14300 Nibong Tebal, Penang, Malaysia. (E-mail:
Abdul Aabid, Department of Mechanical Engineering, Faculty of
Engineering, IIUM, Kuala Lumpur, Malaysia. (E-mail:
Sher Afghan Khan, Department of Mechanical Engineering, Faculty
of Engineering, IIUM, Kuala Lumpur, Malaysia. (E-mail:
wants to compare the tests and theoretical prediction adequately, a view of the sudden expansion flow field is shown in figure 1.
An experimental study was conducted for the effectiveness of microjets to control base pressure in the suddenly expanded duct at Mach numbers 2.8 for area 4.84. The micro jets employed in the wake region act as a dynamic controller to control the base pressure; the results revealed that the wall pressure flow field in the duct is not affected by the dynamic control. It is also observed that the duct length, which varies from 10 to 1 results in maximum increase and decrease of base pressure for a selected geometrical and the inertia parameters [1]–[14].
The influence of the micro jets as a dynamic control mechanism was investigated experimentally by doing the experiments through the CD nozzle with sudden expansion. The significant parameters considered to conduct the tests are Mach number, area ratio, L/D, and the level of expansion. Optimization techniques were used before conducting the experiments for various flow and geometric parameters. The design of experiments method has been used with different analysis techniques like analysis of variance (ANOVA), multiple linear regression analysis, response surface method, and other techniques. The Taguchi and full experimental design will help to the analysis, the accuracy of the results as a dynamic control in the form of micro jets. The control effectiveness was at its best for a given Mach number and the area ratio to control the base pressure in the duct [15]–[18]. Furthermore, the experimental investigation also found in terms of active and passive control of baseflow using cylinders [19]–[23].
Computational fluid dynamics (CFD) method has gain popularity due to its simplicity in solving the fluid flow problems with an intended output. Therefore, with the above review, indicates that the CFD technique to analyze the effectiveness of the control mechanism using micro jets as a dynamic controller to control the CD nozzle flow with a suddenly expanded duct. The numerical simulations were done to obtain the results; with the finite element method. The design and modeling of the nozzle with an enlarged duct had been modeled using ANSYS commercial code [24]. For the CFD analysis; K-ε standard wall function turbulence model was used [25]–[37].
PROBLEM DEFINITION
The experimental setup has been made to conduct the experiments and simulate the flow field at the base of the blunt base that exists at the base of a missile. This low
Effects of Micro jets on the Flow Field of the
Duct with Sudden Expansion
pressure at the blunt base is strongly related to the type of the boundary layer at the upstream of the flow, the boundary layer thickness, and the location of the transition point. A view of the suddenly expanded flow field is shown in figure 1.
Figure 1: A view of Flow Field with Sudden Expansion EXPERIMENTAL SETUP
Figure 2 demonstrates the setup used for the experiments in the present study, as discussed in Ref. [9]. The experimental setup used during the wind tunnel tests comprises of the primary storage tank of air, where the air stored at fifteen bar from an air-cooled air compressor of 25 HP. The air from the atmosphere was passed through the heater and drier to remove the moisture content of the air and then later the air is passed through the filter to separate the contaminations present as impurities are removed. The air from the storage tank was passed through the mixing length, gate valve, and the regulatory pressure valve. Now the air is passed through the piping network into the settling chamber where the air is passed through the wire mesh to eliminate the flow angularity. After all these processes the flow is passed through the nozzle and exhausted into a suddenly expanded duct where all the measurements were done with and without control. For measuring the base pressure as well as the wall pressures of the initial ten taps, the pressure transducer was used, which can measure the pressure in the range from 0 to 15 bar. Takes two-hundred and fifty samples per second and display the average reading of the base pressure as well as the wall pressure on the monitor of the integrated desktop PC. In view of the high sampling rate, it ensures that we do not miss any information about the flow. For the measurements of the wall pressure for the remaining points, the multi-tube manometer was used. At the base of the nozzle, eight holes were made out of which four are the control, and the rest were for the measurements. For the initial ten pressure tapings, the distance with then was 5 mm, but after the wall tapings no 10, the distance between them was kept as 10 mm. It is well known that the significant flow interactions will take place for the initial 2 to 3D. Normally the shear layer which separates at the exit of the nozzle will get reattached with the duct wall at a distance around 3D. Then from this point of the reattachment, the boundary layer will grow, and the flow recovery will take place, and a smooth increase in the wall pressure is expected till it attains the
Figure 2: Experimental Setup [9]
[image:2.595.62.277.124.237.2](a) (b)
Figure 3. Photograph (a) Duct with pressure tabs and (b) setup
RESULTS AND DISCUSSION
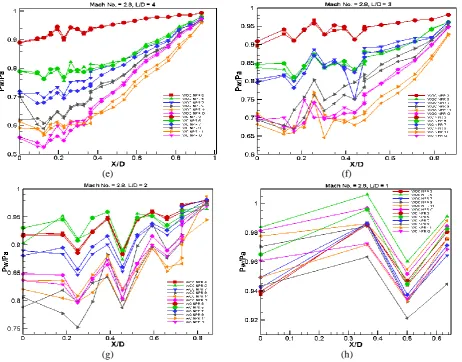
The measured values of the base pressure, as well as the wall pressure, were non-dimensionalized by dividing them with the ambient atmospheric pressure. The wall results for area ratio 4.84 are plotted with respect to the duct length for all the expansion level (i.e., NPR) and non-dimensional duct length are presented in Figs. 4, for Mach number 2.8.
The wall pressure results for area ratio 4.84 are presented in Figs. 4, for Mach number 2.8, all the NPRs, and the L/Ds in the range from 3 to 11, and from 10 to 1 of the present study. The area ratio 4.84 is the case of slightly increased relief for the expanding flow. Since the location of the microjets as the control mechanism was fixed hence due to the increase in the area ratio, the microjets have further shifted away from the base and tend to go near the main jet, and the microjets do not adversely influence the wall pressure field.
[image:2.595.311.543.189.319.2]International Journal of Innovative Technology and Exploring Engineering (IJITEE) ISSN: 2278-3075, Volume-8, Issue- 9S2, July 2019
expanded and they have attained higher wall pressure values at the exit of the nozzle, hence the peak values are less predominant than the ambient pressure as the significant wall pressure recovery has taken at the initial stage itself while exiting from the nozzle. Therefore, further enhancement in the wall pressure is not observed. At L/D = 10, the control does not alter the wall pressure for all the NPRs, and the dynamic control effectiveness is marginal. The trend which was seen at NPR 3 at lower Mach numbers this trend continues at Mach 2.8 for NPR from 3 to 11 (Figs. 4 (a)).
Fig. 4 (b) presents the wall pressure results for L/D = 8 as it is observed in the figure with the exception that the wall pressure fluctuation has increased considerably and remained within 20 % of the duct length. For the largest NPRs, namely 9 and 11, the flow oscillations have increased considerably due to the decrease in the duct length and the influence of the backpressure. Figs. 4 ((c) to (d)) represent the wall pressure results for L/D = 6 and 5 with the difference that due to the reduction in the L/D ratio there are no oscillations in the wall pressure for duct length L = 5D.
However, for L/D = 8, the oscillations still persist as the duct length 8D and 6D show similar results, as for these lengths, the influence of the backpressure remains the same. The trend for the duct length L = 5D seems to show different results. These are due to the influence of backpressure and the peak pressure values are also less than that those were for higher L/D ratios namely (L/D = 10 and 8) especially in respect of L/D = 5. Further, the flow field has smoothened in the duct, and wall pressure values with and without microjets are identical. This trend continues until L/D = 4 (Figs. 4 ((e), then later for lower L/Ds like L/D = 3, the flow seems to be attached at higher NPRs. But for lower NPRs the flow is not attached. Hence, for the duct length, the flow is not at all attached with the duct wall when the duct length is in the range from 2 to1. It is evident that these lengths are not sufficient for the flow to remain attached with the duct wall, and hence, it may be ignored. Hence, if we are interested in the wall pressure results where the flow remained attached with the duct wall, then the duct length L = 4D is the length to be considered.
(a) (b)
(e) (f)
[image:4.595.70.533.49.411.2](g) (h)
Figure 4. Flow development in the enlarged duct
CONCLUSIONS
From the above discussions on the results, we can draw the following conclusions:
The control of the base in the re-circulation zone of the base corner and the flow field in the duct by micro jets has been discussed in detail.
The microjets are found to be effective at this Mach number and area ratio 4.84.
The use of microjets as a dynamic control results in the decrement of suction at the base region and this decrease of associated drag at these combinations of parameters, resulting in an eighty-three percent increase in the base pressure.
For the largest NPRs, namely 9 and 11, the flow oscillations have increased considerably due to the decrease in the duct length and the influence of the backpressure.
The trend for the duct length L = 5D seems to show different results.
These are due to the influence of backpressure and the peak pressure values are also less than that those were for higher L/D ratios namely (L/D = 10 and 8) especially in respect of L/D = 5.
Further, the flow field has smoothened in the duct,
This trend continues until L/D = 4, then later for lower L/Ds like L/D = 3, the flow seems to be attached at higher NPRs (i.e., 9 and 11). But for lower NPRs the flow is not attached.
The active dynamic control does not adversely affect the duct wall pressure distribution
Hence, if we are interested in the wall pressure results where the flow remained attached with the duct wall, then the duct length L = 4D is the length to be considered.
ACKNOWLEDGMENT
The authors would like to acknowledge the Bridging Insentif Grant FASA 1/2019 (304.PAERO.6316572) and the RUI grant (RUI 1001/PAERO/8014035) provided by the Research Creativity and Management Office, Universiti Saint Malaysia to support this research.
REFERENCES
1. R. K. Singh, M. R. Ahmed, M. A. Zullah, and Y. H. Lee, Renew. Energy, 42, 66–76, (2012).
2. M. A. A. Baig, F. Al-Mufadi, S. A. Khan, and E. Rathakrishnan, Int. J. Turbo Jet Engines, 28, 59–69, (2011).
3. S. A. Khan and E. Rathakrishnan, Aircr. Eng. Aerosp. Technol. An Int. J., 78, 293–309, (2006).
International Journal of Innovative Technology and Exploring Engineering (IJITEE) ISSN: 2278-3075, Volume-8, Issue- 9S2, July 2019
6. S. Rehman and S. A. Khan, Aircr. Eng. Aerosp. Technol., 80, 158–164, (2008).
7. S. A. Khan and E. Rathakrishnan, Int. J. Turbo Jet Engines, 21, 255–278, (2004).
8. S. A. Khan and E. Rathakrishnan, Int. J. Turbo Jet Engines, 20, 63–82, (2003).
9. S. A. Khan and E. Rathakrishnan, Int. J. Turbo Jet Engines, 19, 119–126, (2002).
10. F. A. G. M, M. A. Ullah, and S. A. Khan, ARPN J. Eng. Appl. Sci., 11, 10041–10047, (2016).
11. S. Ashfaq, S. A. Khan, and E. Rathakrishnan, Int. Rev. Mech. Eng., 8, 1–10, (2014).
12. S. A. Khan and E. Rathakrishnan, J. Aerosp. Eng. Inst. Eng. India, 87, 3–11, (2006).
13. Z. I. Chaudhary, V. B. Shinde, M. Bashir, and S. A. Khan, Int. J. Energy, Environ. Econ., 24, 59–66, (2016).
14. M. A. A. Baig, S. A. Khan, C. Ahmed Saleel, and E. Rathakrishnan, ARPN J. Eng. Appl. Sci., 7, 992–1002, (2012). 15. J. D. Quadros, S. A. Khan, and A. J. Antony, J. Appl. Fluid Mech.,
(2016).
16. J. D. Quadros, S. A. Khan, A. J. Antony, and J. S. Vas, Int. J. Energy, Environ. Econ., 23, 1–11, (2016).
17. J. D. Quadros, S. A. Khan, and A. J. Antony, Int. J. Recent Res. Asp. 4, 53–58, (2017).
18. J. D. Quadros, S. A. Khan, and A. J. Antony, J. Appl. Math. Comput. Mech., 17, 59–72, (2018).
19. S. A. Khan, M. Asadullah, and J. Sadhiq, Int. J. Mech. Mechatronics Eng., 8, 69–74, (2018).
20. S. A. Khan and M. Asadullah, Int. J. Mech. Prod. Eng. Res. Dev., 8, 39–44, (2018).
21. M. Asadullah, S. A. Khan, W. Asrar, and E. Sulaeman, “Int. J. Mech. Eng. Robot. Res., 7, 428–432, (2018).
22. M. Asadullah, S. A. Khan, W. Asrar, and E. Sulaeman, “Passive control of base pressure with the static cylinder at supersonic flow,” in IOP Publishing House, IOP Conf. Series: Materials Science and Engineering, 2018, pp. 1–10.
23. M. Asadullah, S. A. Khan, W. Asrar, and E. Sulaeman, “Active control of base pressure with the counter-clockwise rotating cylinder at Mach 2,” 2017 4th IEEE Int. Conf. Eng. Technol. Appl. Sci., vol. 8, no. 6, pp. 1–6, 2017.
24. ANSYS Inc, “ANSYS FLUENT 18.0: Theory Guidance,”
Canonsburg PA, 2017.
25. A. G. M. Fharukh, A. A. Alrobaian, A. Aabid, and S. A. Khan, Int. J. Mech. Prod. Eng. Res. Dev., 8, 373–382, (2018).
26. A. Khan, A. Aabid, and S. A. Khan, Int. J. Eng. Technol., 7, 232– 235, (2018).
27. S. A. Khan and A. Aabid, Int. J. Mech. Prod. Eng. Res. Dev., 8, 1147–1158, (2018).
28. S. A. Khan, A. Aabid, F. A. G. M, A. A. Al-Robaian, and A. S. Alsagri, CFD Lett., 11, 61–71, (2019).
29. A. Aabid, N. M. Mazlan, M. A. Ismail, N. Akhtar, and S. A. Khan, Int. J. Eng. Adv. Technol., 8, 457–462, (2019).
30. S. A. Khan, A. Aabid, and C. A. Saleel, Int. J. Mech. Mechatronics Eng. IJMME-IJENS, 19, 70–82, (2019).
31. K. A. Pathan, P. S. Dabeer, and S. A. Khan, “CFD Analysis of Effect of Mach number, Area Ratio, and Nozzle Pressure Ratio on Velocity for Suddenly Expanded Flows,” in 2nd International Conference for Convergence in Technology (I2CT), 2017, pp. 1104–1110.
32. K. A. Pathan, “CFD Analysis of Effect of Area Ratio on Suddenly Expanded Flows,” in 2nd International Conference for Convergence in Technology (I2CT), 2017, pp. 1192–1198. 33. K. A. Pathan, P. S. Dabeer, and S. A. Khan, “CFD Analysis of
Effect of Flow and Geometry Parameters on Thrust Force Created by Flow from Nozzle,” in 2nd International Conference for Convergence in Technology (I2CT), 2017, pp. 1121–1125. 34. K. Ahmed, P. S. Dabeer, and S. Afghan, Case Stud. Therm. Eng.,
12, 696–700, (2018).
35. S. A. Khan, A. Aabid, and A. S. C, Int. J. Mech. Mechatronics Eng. IJMME-IJENS, 19, 170–177, (2019).
36. S. A. Khan, A. Aabid, I. Mokashi, A. A. Al-Robaian, and A. S. Alsagri, CFD Lett., 11, 80–97, (2019).
![Figure 2: Experimental Setup [9]](https://thumb-us.123doks.com/thumbv2/123dok_us/8191687.258147/2.595.312.539.51.158/figure-experimental-setup.webp)