https://doi.org/10.5194/bg-15-4003-2018 © Author(s) 2018. This work is distributed under the Creative Commons Attribution 4.0 License.
Inferring the effects of sink strength on plant carbon balance
processes from experimental measurements
Kashif Mahmud1, Belinda E. Medlyn1, Remko A. Duursma1, Courtney Campany1,2, and Martin G. De Kauwe3
1Hawkesbury Institute for the Environment, Western Sydney University, Locked Bag 1797, Penrith, NSW 2751, Australia 2Department of Biology, Colgate University, NY 13346, USA
3ARC Centre of Excellence for Climate Extremes, University of New South Wales, Sydney, NSW 2052, Australia
Correspondence:Kashif Mahmud ([email protected]) Received: 21 February 2018 – Discussion started: 26 February 2018 Revised: 13 June 2018 – Accepted: 15 June 2018 – Published: 3 July 2018
Abstract. The lack of correlation between photosynthe-sis and plant growth under sink-limited conditions is a long-standing puzzle in plant ecophysiology that currently severely compromises our models of vegetation responses to global change. To address this puzzle, we applied data assim-ilation to an experiment in which the sink strength of Euca-lyptus tereticornisseedlings was manipulated by restricting root volume. Our goals were to infer which processes were affected by sink limitation and to attribute the overall reduc-tion in growth observed in the experiment to the effects on various carbon (C) component processes. Our analysis was able to infer that, in addition to a reduction in photosynthetic rates, sink limitation reduced the rate of utilization of non-structural carbohydrate (NSC), enhanced respiratory losses, modified C allocation and increased foliage turnover. Each of these effects was found to have a significant impact on fi-nal plant biomass accumulation. We also found that inclusion of an NSC storage pool was necessary to capture seedling growth over time, particularly for sink-limited seedlings. Our approach of applying data assimilation to infer C balance processes in a manipulative experiment enabled us to extract new information on the timing, magnitude and direction of the internal C fluxes from an existing dataset. We suggest that this approach could, if used more widely, be an invaluable tool to develop appropriate representations of sink-limited growth in terrestrial biosphere models.
1 Introduction
Almost all mechanistic models of terrestrial vegetation func-tion are based on the carbon (C) balance: plant growth is rep-resented as the difference between C uptake (through pho-tosynthesis) and C loss (through respiration and turnover of plant parts). This approach to modeling plant growth dates back to early crop and forest production models (McMurtrie and Wolf, 1983; de Wit and van Keulen, 1987; de Wit, 1978) and now provides the fundamental quantitative framework to integrate our scientific understanding of plant ecosystem function (Makela et al., 2000).
However, C balance models have been criticized for being “source focused” (Fatichi et al., 2014). Most C balance mod-els predict growth from the environmental responses of pho-tosynthesis (“source limitation”). In contrast to this assump-tion, many experimental studies demonstrate that growth is directly limited by environmental conditions (“sink limita-tion”) rather than the availability of photosynthate. For exam-ple, growth is more sensitive to water limitation than is pho-tosynthesis (Bradford and Hsiao, 1982; Müller et al., 2011; Mitchell et al., 2014); low temperatures are considerably more limiting to cell division than to photosynthesis (Körner et al., 2014); nutrient limitation may slow growth without reducing photosynthesis (Reich, 2012; Crous and Ellsworth, 2004); and physical sink limitation may reduce growth with a decline in photosynthetic capacity and an accumulation of leaf starch (Arp, 1991; Campany et al., 2017; Poorter et al., 2012a; Paul and Foyer, 2001).
in vegetation models; because of their multiple roles in plant functioning, such an implementation provides a buffer against discrepancies in source and sink activity. Some C bal-ance models include a “storage” pool of NSC (Running and Gower, 1991; Bossel, 1996; Thornley and Cannell, 2000), but most of these models make the assumption that the NSC pool acts merely as a buffer between C sources and sinks, bal-ancing out seasonally or at least over several seasons (Fatichi et al., 2014; Friend et al., 2014; De Kauwe et al., 2014; Schiestl-Aalto et al., 2015). There is mounting evidence that the NSC plays a more active role in tree physiology (Buck-ley, 2005; Sala et al., 2012; Wiley and Helliker, 2012; Hart-mann et al., 2015). For example, NSC accumulation can lead to downregulation of photosynthesis (Nikinmaa et al., 2014). Therefore, the need to quantify the NSC pool and to better understand the prioritization of storage vs. growth is of great importance.
An understanding of the dynamics of storage is also essen-tial to correctly represent the C balance in models (Hartmann and Trumbore, 2016). If, for example, a direct growth limi-tation is implemented into models, how should the surplus of accumulated photosynthates be treated? In their proof-of-concept sink-limited model, Fatichi et al. (2014) allowed re-serves to accumulate indefinitely. Alternatively, some models (e.g., CABLE; Law et al., 2006, O-CN; Zaehle and Friend, 2010) increase respiration rates when excess labile C accu-mulates. Both approaches can be seen as model-oriented so-lutions to maintain C balances that are unsatisfactory because they are not based on empirical data. Experiments in which sink strength is manipulated may provide the key to improv-ing our understandimprov-ing of C balance processes under direct growth limitation.
Efforts have been made to understand the physiologi-cal and morphologiphysiologi-cal changes in response to belowground C sink limitation by manipulating rooting volume in tree seedlings (Arp, 1991; Campany et al., 2017; Poorter et al., 2012a). These experiments often reveal photosynthetic downregulation and accumulation of leaf starch and re-ductions in growth (Arp, 1991; McConnaughay and Baz-zaz, 1991; Gunderson and Wullschleger, 1994; Sage, 1994; Poorter et al., 2012a; Robbins and Pharr, 1988; Maina et al., 2002; Campany et al., 2017). In a recent study with eucalyp-tus seedlings, Campany et al. (2017) showed that the reduc-tion in seedling growth when rooting volume was restricted could not be completely explained by the negative effects of sink limitation on photosynthesis, suggesting that other com-ponents of the C balance were affected in the process. How-ever, Campany et al. (2017) could not accurately quantify all components of tree C balance, i.e., photosynthesis, carbohy-drate storage, biomass partitioning and respiration.
Quantifying all components of C balance is not an easy task given that not all processes are measured with equal fidelity, and data gaps will always occur. Klein and Hoch (2015) used a C mass balance approach with a tabular pro-cess flowchart to decipher C components and provide a full
description of tree C allocation dynamics. Here, rather than using a manual process, we used a data assimilation mod-eling (DA-modmod-eling) framework, which has been proven to be a powerful tool in analyzing complex C balance problems (Williams et al., 2005; Richardson et al., 2013). For exam-ple, Richardson et al. (2013) use DA to discriminate among alternative models for the dynamics of nonstructural carbon (NSC), finding that a model with two NSC pools, fast and slow, performed best; Rowland et al. (2014) applied DA to experimental observations of ecosystem C stocks and fluxes to infer seasonal shifts in C allocation and plant respiration in an Amazon forest; and Bloom et al. (2016) used DA to constrain a C balance model with satellite-derived measure-ments of leaf C to simulate continental-scale patterns in C cycle processes.
Our goal in this paper was to use DA to quantify the im-pact of sink limitation on C balance processes. We utilized data from an experiment in which sink limitation was in-duced by restricting the rooting volume ofEucalyptus tereti-cornisseedlings over the course of 4 months (Campany et al., 2017). We assimilated photosynthesis and growth measure-ments from the experiment into a simple C balance model to infer the effects of sink limitation on the main C balance processes, namely respiration, carbohydrate utilization, allo-cation and turnover.
Although in reality plants do have a storage component, it is not necessarily the case that including such a storage com-ponent in the model leads to model improvement. Hence, it is important to test whether or not adding the storage compo-nent improves the performance of the model enough to jus-tify the additional complexity. Therefore, we first tested two null hypotheses.
H1: There is no need to consider storage in the model: growth can be adequately predicted from current-day photosynthate.
H2: There is no effect of sink limitation on C balance pro-cesses other than via a reduction of photosynthesis. We were then interested to test the following specific hy-potheses about the impact of sink limitation on C balance. H3: We hypothesized that the rate of utilization of
carbohy-drate for plant growth would be lower under sink lim-itation, causing growth rates to slow and nonstructural carbohydrate to accumulate.
H4: We hypothesized that under sink limitation a larger pro-portion of C would be lost to growth respiration and less used for production. We have dubbed this the “wasteful plant” hypothesis; this hypothesis corresponds to the as-sumption embedded in some models that respiration is upregulated when labile C accumulates; e.g., CABLE, O-CN (Law et al., 2006; Zaehle and Friend, 2010). H5: We hypothesized that foliage and root C allocation
limitation induced by nutrient and/or water stress often results in a shift in C allocation away from foliage and towards fine roots (Poorter et al., 2012b). However, for this experiment, the physical restriction of root growth limits the potential for root allocation. Hence, we pre-dicted that both foliage and fine root allocation would decrease.
2 Materials and methods 2.1 Experiment description
The site and experimental setup have been described in detail by Campany et al. (2017), so we only provide a brief descrip-tion here. The experiment was carried out at the Hawkesbury Forest Experiment site (33◦370S, 150◦440E) in Richmond, NSW, Australia. The site is located in the subhumid tem-perate region and experiences warm summers and cool win-ters. The seedlings were planted on 21 January 2013 (mid-summer) and harvested on 21 May 2013 (late autumn). Mean daily temperatures ranged from 22.8 to 46.4◦C (monthly mean of 32.1◦C) in January 2013, which was the warmest month of the year, and cooled down in May 2013 with an average of 21◦C (BoM, 2017).
From a single local Cumberland plain cohort, 20-week-old Eucalyptus tereticornisseedlings in tube stock were chosen. A total of 10 seedlings were harvested at the start of the ex-periment to measure initial leaf area and dry mass of foliage, woody components and roots. There were 49 seedlings used in the main experiment, allocated to seven treatments. The plants were grown in containers of differing volume set into the ground (5, 10, 15, 20, 25 or 35 L) or were planted directly into soil (free seedlings, used as the control). All plants were grown in the open under field conditions, but were watered regularly to avoid moisture stress.
2.2 Experimental data acquisition
Full details of all measurements are given in Campany et al. (2017). The mass of each pool (foliage, wood, root, stor-age) was estimated over time as follows. The initial dry mass of leaves, woods and roots was measured for 10 seedlings at the start of the experiment using the harvesting procedure described in Campany et al. (2017). The dry mass of all ex-perimental plants was measured at the end of the experiment following the same procedure. Seedling growth was tracked during the 4 months of the experiment by measuring stem height (h), diameter at 15 cm height (d) and number of leaves on a weekly basis. These measurements were used to esti-mate the time course of wood and foliage biomass: for root total C we used only initial and final harvest measurements. Initial root C was estimated by averaging all 10 harvested seedlings.
We estimated weekly total C in wood (Cs,w) from the
mea-surements of stem height and diameter by using an allometric
model fitted to initial and final harvest data. log Ct,w
=b1+b2log(d)+b3log(h) (1)
For each seedling, the total leaf area (LA) and foliage to-tal C (Ct,f) over time (t) were estimated based on harvested
data (T=time of harvest) and weekly leaf counts (LCs) over time.
LA(t )=LA(T )
LC(T )LC(t ) (2)
Ct,f(t )=
Mf(T )
LC(T )LC(t ) (3)
Fully expanded new leaves were sampled for total nonstruc-tural carbohydrate (NSC) concentration on a fortnightly ba-sis. These concentrations were multiplied by leaf biomass to estimate the foliage TNC pool (Cn,f) at each time point. The
partitioning of the nonstructural C amongst foliage, wood and root tissues according to empirically determined frac-tions was then used to estimate the wood and root compo-nents of the total TNC pool. Structural C mass for each com-ponent was estimated by subtracting nonstructural C mass from total C mass.
Only foliage nonstructural C (Cn,f) was measured, so to
es-timate the partitioning of the nonstructural C among different organs, we used data from a different experiment on similar-sized seedlings of a related species (Eucalyptus globulus), which were grown in 5 L pots until 4 months of age (Duan et al., 2013). We used data from the ambient well-watered con-trol treatments. In that experiment, foliage, wood and root NSC were measured repeatedly over 2 months. There was no statistically significant change over time in the NSC dis-tribution, so we used the mean distribution for mass-specific Cnover time, which was calculated to be a ratio of 75:16:9
among foliage, wood and root pools.
We estimated daily GPP from leaf-level gas exchange measurements and a simple canopy scaling scheme, as de-scribed in Campany et al. (2017) and summarized be-low. Measurements of photosynthesis were made fortnightly throughout the experiment on one fully expanded leaf per plant (Campany et al., 2017). Photosynthetic CO2response
(ACi) curves and leaf dark respiration rates (R) were mea-sured on two occasions, 13–14 March 2013 (when new leaves were first produced) and 14–15 May 2013 (prior to the final harvest). The ACi curves were used to estimate pho-tosynthetic parameters (the maximum rate of Rubisco car-boxylation,Vcmaxand the maximum rate of electron
trans-port for RuBP regeneration under saturating light,Jmax)
us-ing the biochemical model of Farquhar et al. (1980) and fit with the “plantecophys” package (Duursma, 2015) in R. The parameterg1, reflecting the sensitivity of stomatal
conduc-tance (gs) to the photosynthetic rate, was estimated by
fit-ting the optimal stomatal conductance model of Medlyn et al. (2011) to measured stomatal conductance data.
Campany et al. (2017) did not observe variation over time in photosynthetic rates. Hence, the photosynthesis parame-ters were assumed not to change over time but were spe-cific for each treatment. Therefore, daily net C assimilation per unit leaf area (Cday) was estimated by using a coupled
photosynthesis–stomatal conductance model (Farquhar et al., 1980; Medlyn et al., 2011) using mean photosynthetic pa-rameters (Jmax,Vcmax,g1andRd) for each treatment and
me-teorological data from the on-site weather station. The daily GPP was estimated by multiplying Cday, total leaf area (LA)
and a self-shading factor. The self-shading factor, which is a linear function of LA, is calculated via simulation with a detailed radiative transfer model, using R package Yplan-tQMCversion 0.6-6 by Duursma and Cieslak (2014) for indi-vidual treatment. The leaf maintenance respiration rate (Rm,
g C g−1C plant day−1) was calculated for each seedling by scaling the measured rate (R) to air temperature using aQ10
value of 1.86 (Campany et al., 2017). The daily total main-tenance respiration, Rm,tot, is calculated as a
temperature-dependent respiration rate,Rm, multiplied by plant biomass.
We assumed the same tissue-specific dark respiration rates for leaf, woody and root tissues for these seedlings, as was observed for seedlings of this species by Drake et al. (2017). 2.3 Carbon balance model (CBM)
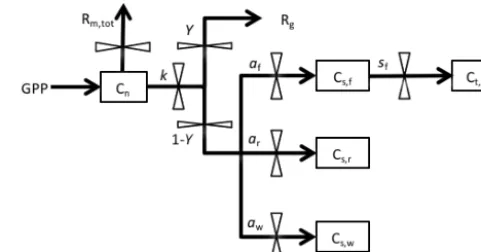
We used a DA-modeling framework similar to that used by Richardson et al. (2013). This approach uses a simple car-bon balance model shown in Fig. 1. The model is driven by daily input of gross primary production (GPP), which di-rectly enters into a nonstructural C pool (Cn). The daily total
maintenance respiration,Rm,tot, is subtracted from Cnpool.
The pool is then utilized for growth at a rate k (i.e.,kCn).
Of the utilization flux, a fractionY is used in growth respira-tion (Rg), and the remaining fraction (1−Y) is allocated to
structural C pools (Cs) among foliage, wood and root (Cs,f,
Cs,w, Cs,r). The foliage pool is assumed to turn over with rate
sf. We assume there is neither wood or root turnover as the
seedlings in the experiment were young.
The dynamics of the four carbon pools are described by four difference equations:
1Cn=GPP−Rm Ct,f+Ct,w+Ct,r−kCn, (4)
1Cs,f=kCn(1−Y ) af−sfCs,f, (5)
1Cs,w=kCn(1−Y ) aw, (6)
1Cs,r=kCn(1−Y ) ar, (7)
where GPP is the gross primary production (g C plant−1day−1); Rm is the maintenance respiration
rate (g C g−1C day−1); Ct,f, Ct,w and Ct,r are the total C in
foliage, wood and root, respectively (g C plant−1); k is the storage utilization coefficient (g C g−1C day−1); Y is the growth respiration fraction; af,awandar are the allocation
to foliage, wood and root, respectively; and sf is the leaf
[image:4.612.308.549.67.193.2]turnover rate (g C g−1C day−1).aris defined as 1−af−aw.
Figure 1.Structure of the carbon balance model. Pools are shown as boxes: Cn, nonstructural storage C; Cs,f, structural C in foliage;
Cs,r, structural C in roots; Cs,w, structural C in wood. Fluxes,
de-noted by arrows, include the following: GPP, gross primary produc-tion;Rm,tot, total maintenance respiration;Rg, growth respiration;
Ct,lit, structural C in leaf litterfall. Fluxes are governed by six key
parameters:k, storage utilization coefficient;Y, growth respiration fraction;af, allocation to foliage;aw, allocation to wood;ar,
allo-cation to roots;sf, leaf turnover rate.aris defined as 1−af−aw.
The nonstructural (storage) C pool (Cn) is assumed to
be divided amongst foliage, wood and root tissues (Cn,f,
Cn,w, Cn,r) according to an empirically determined ratio of
75:16:9. Total carbon in each tissue (Ct) is then calculated
as the sum of nonstructural carbon (Cn) and structural carbon
(Cs) for that tissue.
Ct,f=0.75×Cn+Cs,f (8)
Ct,w=0.16×Cn+Cs,w (9)
Ct,r=0.09×Cn+Cs,r (10)
2.4 Application of data assimilation (DA) algorithm DA was used to estimate the six parameters (k,Y, af,aw,
ar,sf) of the CBM for this experiment. All parameters were
allowed to vary quadratically with time; i.e., each parameter was represented as
p=p1+p2t+p3t2. (11)
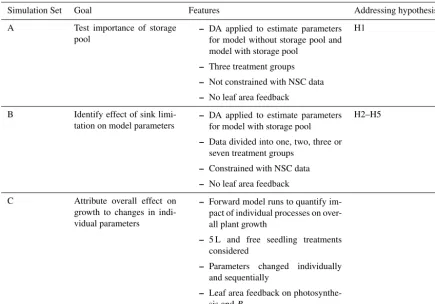
Quadratic variation over time was found to yield significantly better model fits than either constant parameter values or lin-ear variation over time (see Supplement Sect. S1). We exe-cuted three distinct sets of model simulations (Table 1), with the goals of (1) testing the need for a storage pool; (2) deter-mining the effect of sink limitation on model parameters; and (3) attributing the overall effect of sink limitation on growth to the change in individual parameters.
For each set of model simulations, GPP andRmwere used
Table 1.Summary of the three model simulation sets.
Simulation Set Goal Features Addressing hypothesis
A Test importance of storage pool
– DA applied to estimate parameters for model without storage pool and model with storage pool
– Three treatment groups
– Not constrained with NSC data
– No leaf area feedback
H1
B Identify effect of sink limi-tation on model parameters
– DA applied to estimate parameters for model with storage pool
– Data divided into one, two, three or seven treatment groups
– Constrained with NSC data
– No leaf area feedback
H2–H5
C Attribute overall effect on growth to changes in indi-vidual parameters
– Forward model runs to quantify im-pact of individual processes on over-all plant growth
– 5 L and free seedling treatments considered
– Parameters changed individually and sequentially
– Leaf area feedback on photosynthe-sis andRm
of Ct,f and Ct,w, two measurements of Ct,r (start and end
of the experiment) and six measurements of foliage NSC. There were 5 quadratically varying parameters to determine for each treatment, summing to a total of 15 (3×5) coeffi-cients to determine, compared with total 44 data measure-ments available, for each treatment.
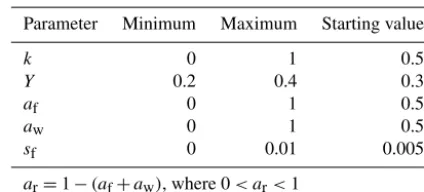
We used the Metropolis algorithm (Metropolis et al., 1953) as implemented by Zobitz et al. (2011), with broad prior probability density functions (PDFs) for the parameters (Ta-ble 2). Values ofk,af,arandsfwere allowed to vary within
the maximum possible range, while parameter Y was con-strained according to the literature on growth respiration (Villar and Merino, 2001). Parameterarwas calculated from
af andaw with a check onar to ensure that it had
reason-able values (0< ar<1). Standard error (SE) was used as an
estimate of uncertainty on the assimilated data (Rowland et al., 2014; Richardson et al., 2010) and was calculated based on six replicate measurements. When combining errors, the errors were assumed to be uncorrelated (Hughes and Hase, 2010).
Model parameters were assumed to be real, positive and to have a lognormal probability distribution (Rowland et al., 2014). Therefore, all processes of parameter selection and the acceptance and rejection of parameters in relation to prior ranges were performed in lognormal space (Knorr and
Kattge, 2005). We performed the first iteration starting from the prior set of parameters. To generate subsequent values for each parameter, a new point was generated by varying all vector elements by some step chosen with a Gaussian-distributed random number generator having a mean of 0 and an SD of 0.005 in lognormal space. We adjusted the step length for each parameter to values that lead to an av-erage acceptance rate of the new points of around 35–40 %. We confirmed the chain convergence, having 3000 iterations to adequately explore the posterior parameter space, by vi-sual inspection of the trace plots of different parameters as suggested by Van Oijen (2008). The trace plots show how the chain moves through parameter space for each individ-ual parameter. The parameter vectors sampled during the first phase of the chain were not representative and therefore the first 10 % of the chain was discarded from the posterior sam-ple.
2.4.1 Importance of storage pool
We tested the hypothesis (H1) on the importance of includ-ing a nonstructural C storage pool in CBM by contrastinclud-ing fits of the full model with fits of a simplified model without the nonstructural C pool (Simulation Set A, Table 1). The sim-plified model omits the nonstructural C pool (Cs) from the
uti-Table 2.Prior parameter PDFs (with uniform distribution) and the starting point of the iteration for all parameters.
Parameter Minimum Maximum Starting value
k 0 1 0.5
Y 0.2 0.4 0.3
af 0 1 0.5
aw 0 1 0.5
sf 0 0.01 0.005
ar=1−(af+aw), where 0< ar<1
lized for growth each day. We applied the DA framework to both model options and calculated the Bayesian information criterion (BIC; Schwarz, 1978) to determine the better model structure. BIC measures how well the model predicts the data based on a likelihood function and compares model perfor-mance taking into account the number of fitted parameters, with the lowest BIC number indicating the best model set-ting. For this comparison, both models were fit to the biomass data only, not leaf NSC data, in order to ensure that both models were fit to the same number of data points.
2.4.2 Effects of sink limitation on model parameters
The effects of sink limitation on C balance were investigated by applying the DA framework to data from all treatments combined and then subsets of treatments (Simulation Set B, Table 1). Considering all treatments pooled together gives the same parameters for all the treatments and effectively as-sumes no effect of sink limitation. On the other hand, tak-ing more subsets of treatments produces more parameter sets (one for each subset) and allows for parameters to vary ac-cording to the degree of sink limitation. We first fitted the model to all data ignoring treatment differences, then consid-ered two treatment groups (free seedling/5–35 L container-ized seedlings), three groups (free/5–15/20–35 L) and four groups (free/5–10/15–20/25–35 L). We also fitted the model to each of the seven treatments individually, with the parame-ter set for each treatment being unique. The BIC values were compared across treatment groupings.
2.4.3 Attribution analysis
We performed a sensitivity analysis to quantify the impact of the response of each individual process to sink limitation on overall plant growth (Simulation Set C, Table 1). This anal-ysis consisted of forward runs of the model, including a leaf area feedback to GPP. That is, rather than taking GPP based on measured LA (Eq. 9) as input, in this version of the model we calculated daily GPP using the modeled LA, the photo-synthesis rate and corresponding self-shading factor. Adding the LA feedback to the model was necessary to quantify how the treatment effect on individual model parameters affects
final seedling biomass through its effect on foliage mass, and consequently GPP, over time.
LA in each time step is estimated from NSC-free specific leaf area (SLAnonsc) and the predicted foliage structural
car-bon (Cs,f) in that time step. SLAnonsc is calculated at
har-vest, discarding the foliage NSC portion, and is assumed to be constant for a given treatment throughout the experiment.
LA=SLAnonsc×Cs,f (12)
Once the LA feedback was implemented in the CBM, we ran the model with the inputs and modeled parameters from the smallest pot seedling (5 L), then changed the parame-ters to those for the free seedling sequentially in order to quantify the effect of each parameter on the final seedling biomass. The parameters we considered for this attribution analysis were daily photosynthetic rate per unit leaf area (Cday), maintenance respiration rate (Rm), C allocation
frac-tions to biomass (af,aw,ar), growth respiration rate (Y),
fo-liage turnover rate (sf) and utilization coefficient (k). We
ad-ditionally carried out a sensitivity analysis in which we var-ied each parameter from its baseline value separately.
3 Results
3.1 Importance of storage pool
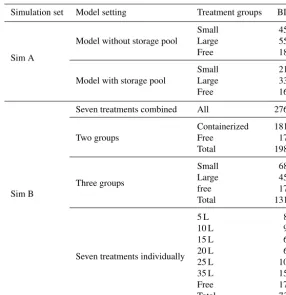
First, we tested the null hypothesis (H1) that there is no need for a nonstructural carbohydrate storage pool in the carbon balance model. We compared BIC values for model structures with and without a storage pool. Table 3 (Simu-lation Set A) shows the results for model fits with the opti-mal grouping strategy (three treatment groups). BIC values were consistently lower for the model including the storage pool; the improvement in model fit is most noticeable for the containerized seedlings. This analysis demonstrates that the model does need to include a storage pool to correctly repre-sent the experimental data. In all remaining analyses, the full CBM (with nonstructural C pool) is applied to data from all four plant C pools (NSC, foliage, wood and root biomass). 3.2 Sink limitation effect on C balance processes
[image:6.612.60.272.96.192.2]Table 3.BIC values from model fits. The lowest BIC values indicate the best performing parameter settings for any particular simulation. Note that for Sim A, leaf NSC data were not used to constrain either model to ensure that both models were fit to the same dataset, resulting in lower BICs compared to Sim B. Treatment groups are as follows: “small” – 5, 10 and 15 L containers; “large” – 20, 25 and 25 L containers; “free” – freely rooted seedlings; “All” – all data; “containerized” – all plants in containers.
Simulation set Model setting Treatment groups BIC
Sim A
Model without storage pool
Small 459 Large 550 Free 182
Model with storage pool
Small 215 Large 338 Free 167
Sim B
Seven treatments combined All 2768
Two groups
Containerized 1813 Free 170 Total 1983
Three groups
Small 683 Large 457 free 170 Total 1310
Seven treatments individually
5 L 85
10 L 98
15 L 60
20 L 63
25 L 106 35 L 152 Free 170 Total 734
parameter changes became more difficult as the number of groups increased. Hence, further analyses in this paper used unique parameter sets for three treatment groups: small con-tainers, large containers and free seedlings.
3.3 Analysis of carbon stock dynamics
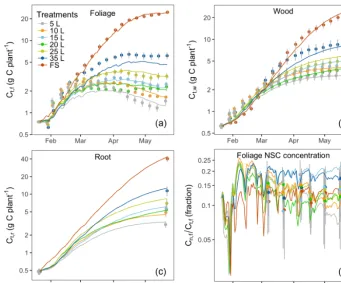
Figure 2 shows the correspondence between modeled C pools and data. The model reproduced the key features of biomass growth over time in response to treatment. Biomass growth (Fig. 2a, b and c) and the foliage storage pool (Fig. 2d) were very clearly impacted by sink limita-tion: biomass growth was strongly reduced for containerized seedlings, which was very well mimicked by the model. Fo-liage growth in the free seedlings slowed towards the end of the experiment. Wood and root growth continued through-out the experiment in freely rooted seedlings but slowed down during the second half of the experiment in container-ized seedlings. NSC concentrations (Cn,f/Ct,f) in seedlings
in small containers were higher compared those in free seedlings at the beginning of the season but all treatments had similar concentrations after 4 months (Fig. 2d). In March, at the time of the first leaf NSC measurements, the foliage stor-age pool (Supplement Fig. S1) was similar in size across all
treatments, but it increased over time in the free seedlings as these plants continued to grow and decreased over time in the plants in small containers.
Modeled C stocks for all seven treatments closely tracked their corresponding observations (Fig. 2) as most of the pre-dicted biomass values were within 1 standard error of the measurements. The exception is the 35 L container treatment, which is underestimated slightly because the grouping of 20, 25 and 35 L treatments into one group makes it difficult for the model to fit all treatments in this group.
3.4 Parameter estimates
Figure 2.C stocks (lines) with the inferred parameter set and corresponding observations (symbols):(a)total C mass in foliage Ct,f,(b)total
C mass in wood Ct,w,(c)total C mass in root Ct,rand(d)foliage NSC concentration (Cn,f/Ct,f). Note that the carbon pools and foliage
NSC concentration (yaxes) are plotted on log scale to visualize the changes at the beginning of the experiment. Error bars (1 SE,n=6) are shown for each observation.
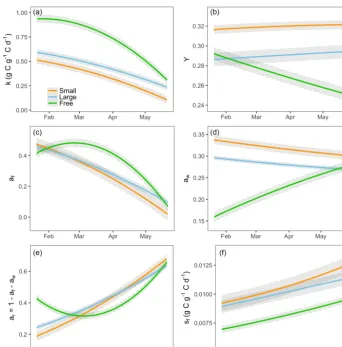
In agreement with hypothesis H4, the estimated growth respiration rate (Y) varied according to the sink strength of the treatment groups and was highest in the lowest sink strength treatments (Fig. 3b). Moreover,Y did not vary sig-nificantly over time for the sink-limited treatment groups. However, the rate of growth respiration for the free seedlings slowed down over time.
The data assimilation process also indicated that the growth allocation fractions vary among treatments and over time. Consistent with hypothesis H5, the wood allocation fraction was highest in the smallest container treatments and lowest in the free seedlings (Fig. 3d). For the free seedlings, allocation was initially highest to foliage and roots (Fig. 3c– e); over time, the plants reduced allocation to foliage and in-creased it to wood and roots. In the containerized seedlings, allocation was initially highest to wood and foliage; over time, foliage allocation decreased to almost zero and root al-location increased.
The estimated leaf turnover rate, sf, was also notably
higher for sink-limited treatments compared to free seedlings (Fig. 3f). The large value of modeled leaf litterfall for sink-limited treatments is consistent with observations during the experiment that containerized seedlings had relatively large leaf litterfall, beyond normal senescence. Estimated sf
in-creased over time for all treatment groups (most notably in
free seedlings) due to a combination of ontogeny, seasonal change and growth restriction in the sink-limited seedlings. 3.5 Carbon budget
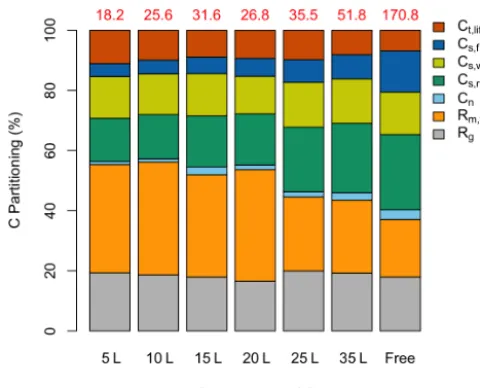
The model was used to partition total GPP (g C plant−1) from the entire experiment period into different C pools (growth respiration, maintenance respiration, nonstructural carbon, structural foliage, wood and root carbon, and litter-fall) for all seven treatments (Fig. 4). Total GPP was consid-erably lower for the containerized seedlings, owing to lower photosynthetic rates per unit leaf area, Cday (Fig. 5a), and
lower total leaf area (LA) per plant. Though starting with the same total LA of 0.016 m2, the 5 L containerized and free seedlings had total LA of 0.031 and 0.516 m2, respectively, after 4 months of treatment. Simultaneously, the partitioning of GPP changed considerably across different treatments.
fi-Figure 3.Modeled final parameters for three groups of treatments during the experiment period (21 January to 21 May 2013):(a)storage utilization coefficient,k;(b)growth respiration fraction,Y;(c)allocation to foliage,af;(d)allocation to wood,aw;(e)allocation to roots,ar;
and(f)leaf turnover rate,sf.aris defined as 1−af−aw. The gray shaded area shows the 95 % confidence intervals of modeled parameters.
nal allocation to storage was also higher in free seedlings. The sink-limited seedlings had a higher proportional C lost through maintenance respiration. Tissue-specific respiration rates were similar in free and containerized seedlings, so the ∼35 % reduction in photosynthetic rate for the smallest con-tainerized seedlings led to a higher overallRm,tot/GPP
frac-tion. In summary, the estimated total respiration (Rm,tot+Rg)
to GPP ratio was considerably lower for the free seedlings compared to the sink-limited treatments. The carbon use ef-ficiency (CUE) remained relatively constant and high over time for free seedlings (∼0.65), whereas CUE in the small-est container treatments showed a sharp reduction over time down to∼0.25 (Supplement Fig. S2).
3.6 Attribution analysis
Sink limitation affected biomass growth via a range of pro-cesses, namely reduction in photosynthesis and variation in the utilization rate, growth respiration, leaf litterfall and C allocations to foliage, wood and root across various treat-ment groups. We quantified the contribution of each of these
process responses separately by running the CBM with pa-rameter inputs changing both sequentially and individually (one at a time). Table 4 presents the effect of the param-eters changing individually from the value of the smallest container treatment (5 L) to that of free seedlings (FS) and the other way around, resetting the previous parameter to the baseline value. The final biomass values in Table 4 indicate the contribution of each individual parameter separately and sequentially. Photosynthetic capacity had the largest individ-ual effect on total plant growth (+15.28 and−71.9 g C) com-pared to the rest of the parameters. However, the allocation pattern and utilization rate also had a sizeable effect on final biomass (Table 4).
Figure 5 shows how biomass (Mf, Mw and Mr) is
[image:9.612.128.471.62.409.2]com-Figure 4.Simulated proportional C partitioning for the whole ex-perimental period. The total accumulated GPP (g C plant−1) for in-dividual treatments is shown (in red) at the top of each column. “Free” stands for free seedling. Different C partitions are in the color legend: total litterfall, Ct,lit; foliage structural C, Cs,f; wood
structural C, Cs,w; root structural C, Cs,r; nonstructural C pool, Cn;
total maintenance respiration,Rm,tot; and growth respiration,Rg.
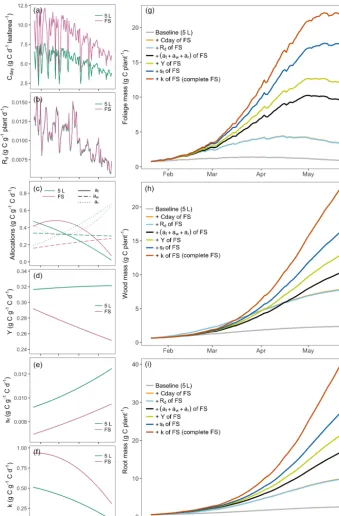
pared to the 5 L container treatment (Fig. 5a), had a large impact on plant growth (final total biomass was increased by 11 g; Table 4 and Fig. 5g–i, gray to orange). Maintenance respiration rate (Rm) did not vary significantly across
treat-ments (Fig. 5b), in line with the data presented in Campany et al. (2017), and consequently its impact was insignificant (the final total biomass is reduced by only 0.24 g; Table 4 and Fig. 5g–i, orange to light blue). The modeled biomass allocation fractions (af,awandar) in Fig. 5c had important
but mixed effects on C stocks. The final foliage mass was in-creased from 3.4 to 9.6 g due to the increase in C allocation to foliage (Fig. 5g, light blue to green), which has a positive feedback on GPP. Concomitant changes in C allocation to wood and root resulted in smaller changes to these biomasses as shown in Fig. 5h–i (2.5 and 7.0 g rise, respectively). Over-all, the change in allocation pattern resulted in an increase in final total biomass by 15.74 g (Table 4). Growth respira-tion rate (Y) was∼20 % lower in free seedlings (Fig. 5d), which had a considerable impact on C budgets (the final to-tal biomasses were increased by 9.56 g; Table 4 and green to yellow Fig. 5g–i). Leaf turnover,sf, was low in the free
[image:10.612.47.287.64.258.2]seedlings compared to the 5 L container treatment (Fig. 5e), which had a large positive effect on final C pools (Fig. 5g– i, yellow to blue). The foliage mass was increased by 5.6 g; the wood and root masses were also further increased (3.4 and 5.8 g, respectively) due to the increase in GPP when fo-liage is retained for longer. Finally, the utilization coefficient, k, was higher in free seedlings (Fig. 5f), causing a 20–30 %
Table 4.Estimates of final biomass due to parameter change (in-dividual and sequential), showing the contribution of each parame-ter separately and successively to biomass changes. All values in g C plant−1. +/− indicates biomass increase or decrease due to particular parameter change. The final column corresponds to the changes shown in Fig. 5.
Parameter change Individually Sequentially
5 LFS FS5 L 5 LFS
Baseline Ct 5.81 83.99 5.81
Cday +15.28 −71.9 +15.28 Rd −0.08 +1.1 −0.24 (af+aw+ar) +1.53 −45.5 +15.74 Y +0.41 −19.22 +9.56 sf +1.13 −19.17 +14.77 k +0.44 −23.08 +23.08
FS total observed Ct 83.99
positive feedback on C budgets (total biomass increased by 23.08 g; Table 4 and Fig. 5g–i, blue to red).
4 Discussion
4.1 Effects of sink limitation on C balance
Our DA model analysis of this root volume restriction ex-periment provided significant new insights into the response of key C balance processes to sink limitation. We were able to infer that, in addition to a reduction in photosyn-thetic rates, sink limitation reduced NSC utilization rates, in-creased growth respiration, modified allocation patterns and enhanced senescence. Our attribution analysis indicated that all of these process responses contributed significantly to the overall reduction in biomass observed under low rooting vol-ume.
We first tested the null hypothesis (H1) that seedling growth rates could be adequately predicted from current-day photosynthate. This hypothesis was rejected, with a storage pool being necessary to simulate growth, particularly for con-tainerized seedlings (Sim A, Table 3). The approach of sim-ulating growth from current-day photosynthate is commonly used in models, particularly for evergreen plants (e.g., Jain and Yang, 2005; Law et al., 2006; Thornton et al., 2007), but several authors have proposed the need for a storage pool to balance the C sources and sinks in the short term, as well as to simulate the effects of photosynthetic downregulation in the long term (Pugh et al., 2016; Richardson et al., 2013; Fatichi et al., 2016). Our results support the need for an NSC pool in CBMs.
[image:10.612.314.541.141.274.2]Figure 5.Attribution analysis. Left column(a–f): changes in inferred parameters. Right column(g–i): associated impacts on C budgets due to sequential parameter changes from 5 L container treatment to that of free seedlings (right column,g–i). Different colors in the figure indicate the parameter shifts (left column,a–f) and their associated impacts on C budgets (right column,g–i). Legend: 5 L, highly sink-limited treatment with a container size of 5 L; FS, free seedlings without any sink limitation. Note that the orange line is overlain by the light blue line; the small change in maintenance respiration results in a very minor effect on biomass growth.
set of parameters (ignoring sink limitation effect) gave a low goodness of fit (Sim B, Table 1). This result is consistent with the finding of Campany et al. (2017) that the observed effects of sink limitation on photosynthesis in this experiment were
in-cluding carbohydrate utilization, growth respiration, alloca-tion patterns and turnover.
Our results suggested a significant effect of sink limita-tion on the carbohydrate utilizalimita-tion rate, k (Fig. 3a). The modeledkvalues were approximately twice as large in free seedlings compared to the small containers. This result sup-ports the hypothesis (H3) that plants would have the lowest utilization rate under sink-limited conditions. At the start of the measurement period, the free seedlings were utilizing al-most all C produced immediately in growth (k close to 1.0; Fig. 3a). The utilization coefficient of the free seedlings de-creased over time, causing a buildup in C storage (Fig. 2d). This decrease in utilization rate could potentially be an onto-genetic effect, with free seedlings initially allocating all car-bon to growth during establishment but increasing storage with increasing size. However, ontogenetic effects are con-founded with season in this experiment, such that decreasing utilization rates over time could also be a result of decreas-ing temperatures movdecreas-ing into autumn. There is a real need to quantify how the carbohydrate utilization rate varies with environmental conditions and ontogeny; data assimilation of experiments in which photosynthesis and growth rates have been monitored over time offer one means to do so.
Although the carbohydrate utilization rate was highest in the free seedlings, leaf carbohydrate concentrations were not lower in these plants at the end of the experiment. As shown in the final C budget analysis (Fig. 4), there was a higher to-tal C allocation to the NSC pool in free seedlings than sink-limited treatments. Final carbohydrate storage was high in free seedlings despite highkbecause the carbohydrate pool was recharged throughout the experiment (Fig. 2d), as the free seedlings had high photosynthetic rates but no higher maintenance respiration requirement. In contrast, NSC was depleted for the smallest pot treatments after mid-March (Fig. 2d) when demand exceeded supply due to both the lim-ited production of photoassimilates and enhanced leaf litter-fall (Fig. 3f).
The modeled rate for growth respiration, Y, was larger for sink-limited treatments than the free seedlings (Fig. 3b). Overall, there was lower C utilization (i.e., CUE) in plant structural growth in sink-limited treatments (∼45 %) com-pared to free seedlings (∼60 %). This finding supports the “wasteful plant” hypothesis H4. Inferred Y remained con-stant over time for the containerized treatments, implying a fixed portion of C loss due to growth respiration despite sea-sonal variation. However, a reduction inY over time was in-ferred for the free seedlings, suggesting a possible ontoge-netic effect. However, it is important to note that we have in-ferred growth respiration from the CBM framework. There-fore, these estimates could possibly also include C losses via other pathways. Direct measurements of growth respiration rates would be useful to confirm the inferred effects of sink limitation and investigate potential underlying mechanisms.
We also demonstrated that the allocation fractions among organs change in sink-limited conditions, with sizeable
con-sequences for plant growth rates. Previous analyses of pot-size experiments have generally only been able to estimate changes in final biomass partitioning (e.g., Poorter et al., 2012a). Campany et al. (2017) analyzed final biomass par-titioning in the experiment and did not find any significant difference in biomass partitioning in sink-limited seedlings compared to free seedlings once ontogenetic drift was taken into account. Our analysis adds to that of Campany et al. (2017) by calculating the dynamics of allocation over time and taking estimated foliage loss into account. Our analysis showed that modeled allocation fractions vary significantly over time (Fig. 3c, d and e). In the free seedlings, alloca-tion to foliage decreased, and allocaalloca-tion to both wood and roots increased, reflecting the ontogenetic effects mentioned by Campany et al. (2017). However, our analysis also high-lights significant variations among treatments in the modeled C allocation fractions to foliage, wood and root that are not ontogenetic. At the beginning of the experiment, foliage al-location fractions were similar for all treatment groups, but wood allocation was higher and root allocation lower in the containerized seedlings compared to the free seedlings. For the containerized seedlings, changes over time also differed from those in the free seedlings: wood allocation decreased marginally rather than increasing, foliage allocation declined steeply over time and root allocation increased steeply. These allocation patterns in seedlings supported our hypothesis H5 that sink limitation due to root restriction would favor alloca-tion to wood over foliage or fine roots. Calculating dynamic allocation patterns over the course of an experiment thus pro-vides additional insights beyond analysis of the final biomass outcome.
4.2 Application of DA to infer C balance processes
We have demonstrated that the DA approach can be an in-valuable tool for quantifying C fluxes in experimental sys-tems, enabling us to extract important new information from existing datasets to inform carbon balance models, such as the rate and timing of the transfer of photosynthate to and from storage pools. The DA-modeling approach is able to draw together the experimental data to estimate all the com-ponents of C balance, including photosynthesis, respiration, NSC, biomass partitioning and turnover. This approach could readily be applied to other experiments to derive new infor-mation, allowing for a better representation of C balance pro-cesses in vegetation models.
sug-gested that measurements of foliage turnover would have been particularly useful to better constrain the model. Any experiment having estimates of GPP, maintenance respira-tion and structural biomass could potentially be investigated with this framework. However, additional measurements of storage and turnover would be highly beneficial for the per-formance of the simulation. Repeated observations over time are also useful, particularly for young plants, to account for variations in parameter values over time. We found signif-icant changes in parameter values during the course of the 4-month experiment, which may be linked to both ontogeny and seasonal variation in temperature.
One major caveat to our results is that belowground carbon cycling processes were not well characterized. For practical reasons, processes such as root growth, respiration, turnover and exudation are rarely well quantified in empirical stud-ies. Here, we had access to initial and final estimates of root biomass. Root respiration was estimated; root turnover and exudation were assumed to be zero. There is evidence that stress can increase rates of root exudation: for exam-ple, Karst et al. (2017) demonstrate increased exudation rates in seedlings exposed to cold soils. They also showed that stressed plants may exude C beyond that predicted by sim-ple concentration gradients in NSC between root and soil. The loss of C independent of NSC in roots suggests that ex-udation may be actively enhanced once plant growth is lim-ited (Hamilton et al., 2008; Karst et al., 2017). As our CBM does not include this process, it would attribute any C loss through root exudation to another process removing C from the plant, such as growth respiration. The increase in growth respiration that we inferred may thus potentially include root exudation. We have reasonable confidence, from the combi-nation of measurements available, in our inference that the C loss term was increased with sink limitation. However, direct measurements of one or both processes would be required to determine the role of root exudation.
In addition, we did not have access to estimates of root or wood NSC. We used data measured in a previous exper-iment on 4-month-old E. globulus seedlings (Duan et al., 2013) to estimate these values from foliage NSC. It would have been useful to obtain these values, particularly since wood and root tissue can act as storage organs, and the timing of storage development would be extremely useful to quan-tify. The concentration of NSC in plant roots measured by Duan et al. (2013) was relatively small compared to that of foliage (mean 2.15 %). However, fine root NSC values in a nearby experiment on 17-month-old E. parramattensis saplings were even lower (0.78 %; Morgan E. Furze et al., unpublished data, 2016). It is possible that these very fast-growing eucalypt species only start to accumulate root re-serves when they are established. Further research is needed to quantify the trade-off between allocation to growth and storage during establishment.
4.3 Implications for modeling plant growth under sink-limited conditions
The goal of our study was to examine how carbon balance models should be modified to represent the sink limitation of growth while maintaining mass balance. Our results demon-strate that several process representations need to be mod-ified. Firstly, we demonstrate a clear need to incorporate a carbohydrate storage pool with a dynamic utilization rate for growth. We demonstrate that the utilization rate is slowed by sink limitation and may also vary with ontogeny. Targeted experimental work is needed to better quantify this variation in utilization rates. Secondly, in addition to a feedback on photosynthetic rates, other plant processes including growth respiration, turnover and allocation are also affected by sink limitation. Applying a DA-modeling framework to experi-mental data with rooting volume restriction has allowed us to quantify these effects in this experiment. Applying this ap-proach more broadly would potentially allow us to identify general patterns that could then be formulated for inclusion into models.
The inferences on carbohydrate dynamics from seedling studies could be used to infer mature tree responses that can subsequently be integrated at ecosystem level and beyond us-ing the concepts of Hartmann et al. (2018). We are enthusi-astic to see the approach applied to other experiments, but there are likely to be gaps in the datasets to constrain the key C balance processes. Fortunately, the DA approach does not require continuous measurements of all of the C stocks and fluxes. In the absence of measurements, the model can be re-lied upon to project the time evolution of missing stocks and fluxes, although of course the precision of model estimates and insights that can be gained increases with data availabil-ity. DA can also be applied at ecosystem scale. There are several successful examples of DA being applied to forest growth, albeit without a focus on storage (e.g., Van Oijen, 2008; Williams et al., 2005; Bloom et al., 2016; Quaife et al., 2008; Pinnington et al., 2016). Overall, this approach pro-vides important insights into the regulation of carbohydrate storage and would significantly advance our ability to pre-dict the impacts of environmental changes on plant growth and vulnerability to stress.
Code and data availability. The raw data are freely available on Figshare (Mahmud et al., 2018). The R source code to perform all the data processing and analysis to replicate the figures is freely available as a Git repository (https://github.com/kashifmahmud/ DA_Sink_limited_experiment, last access: 18 June 2018) and on Figshare (Mahmud and Medlyn, 2018).
Author contributions. KM analyzed the data, developed the model code, performed the simulations and wrote the paper. BEM con-ceived the idea and helped in data analysis. RAD and CC provided the experimental data. BEM, RAD, CC and MGDK provided in-depth editing of the paper.
Competing interests. The authors declare that they have no conflict of interest.
Acknowledgements. This research was supported by the Australian Research Council (Discovery, DP DP160103436), the Hawkesbury Institute for the Environment and Western Sydney University. Martin De Kauwe acknowledges support from the ARC Centre of Excellence for Climate Extremes (CE170100023). The authors wish to thank Burhan Amiji for his technical assistance and all individuals from the Hawkesbury Institute for the Environment who helped during the experimental harvest. We thank Mathew Williams for advice on implementing the data assimilation framework.
Edited by: Sönke Zaehle
Reviewed by: Simone Fatichi and Henrik Hartmann
References
Arp, W. J.: Effects of source sink relations on photosynthetic accli-mation to elevated carbon dioxide, Plant Cell Environ., 14, 869– 876, 1991.
Bloom, A. A., Exbrayat, J.-F., van der Velde, I. R., Feng, L., and Williams, M.: The decadal state of the terrestrial carbon cycle: Global retrievals of terrestrial carbon allocation, pools, and residence times, P. Natl. Acad. Sci. USA, 113, 1285–1290, https://doi.org/10.1073/pnas.1515160113, 2016.
BoM: Climate Data Online (Station 067105), Bureau of Meteo-rology Melbourne, available at: http://www.bom.gov.au/climate/ data/, last access: 26 August 2017.
Bossel, H.: treedyn3 forest simulation model, Ecol. Model., 90, 187–227, https://doi.org/10.1016/0304-3800(95)00139-5, 1996. Bradford, K. J. and Hsiao, T. C.: Stomatal behavior and water
re-lations of waterlogged tomato plants, Plant Physiol., 70, 1508– 1513, 1982.
Buckley, T. N.: The control of stomata by water balance, New Phytol., 168, 275–292, https://doi.org/10.1111/j.1469-8137.2005.01543.x, 2005.
Campany, C. E., Medlyn, B. E., and Duursma, R. A.: Reduced growth due to belowground sink limitation is not fully ex-plained by reduced photosynthesis, Tree Physiol., 37, 1042– 1054, https://doi.org/10.1093/treephys/tpx038, 2017.
Crous, K. Y. and Ellsworth, D. S.: Canopy position affects photo-synthetic adjustments to long-term elevated CO2concentration
(FACE) in aging needles in a mature Pinus taeda forest, Tree Physiol., 24, 961–970, 2004.
De Kauwe, M. G., Medlyn, B. E., Zaehle, S., Walker, A. P., Di-etze, M. C., Wang, Y. P., Luo, Y. Q., Jain, A. K., El-Masri, B., Hickler, T., Warlind, D., Weng, E. S., Parton, W. J., Thornton, P. E., Wang, S. S., Prentice, I. C., Asao, S., Smith, B., McCarthy, H. R., Iversen, C. M., Hanson, P. J., Warren, J. M., Oren, R., and
Norby, R. J.: Where does the carbon go? A model-data intercom-parison of vegetation carbon allocation and turnover processes at two temperate forest free-air CO2enrichment sites, New Phytol., 203, 883–899, https://doi.org/10.1111/nph.12847, 2014. de Wit, C. T.: Simulation of assimilation, respiration, and
transpira-tion of crops, Wiley, Pudoc, Wageningen, 140 p., 1978. de Wit, C. T. and van Keulen, H.: Modelling production of
field crops and its requirements, Geoderma, 40, 253–265, https://doi.org/10.1016/0016-7061(87)90036-X, 1987.
Drake, J. E., Vårhammar, A., Kumarathunge, D., Medlyn, B. E., Pfautsch, S., Reich, P. B., Tissue, D. T., Ghannoum, O., and Tjoelker, M. G.: A common thermal niche among geographically diverse populations of the widely distributed tree species Eucalyptus tereticornis: No evidence for adapta-tion to climate-of-origin, Glob. Change Biol., 23, 5069–5082, https://doi.org/10.1111/gcb.13771, 2017.
Duan, H., Amthor, J. S., Duursma, R. A., O’Grady, A. P., Choat, B., and Tissue, D. T.: Carbon dynamics of euca-lypt seedlings exposed to progressive drought in elevated [CO2] and elevated temperature, Tree Physiol., 33, 779–792,
https://doi.org/10.1093/treephys/tpt061, 2013.
Duursma, R. A.: Plantecophys – An R Package for Analysing and Modelling Leaf Gas Exchange Data, Plos One, 10, e0143346, https://doi.org/10.1371/journal.pone.0143346, 2015.
Duursma, R. and Cieslak, M.: YplantQMC: plant architectural analysis with Yplant and QuasiMC, available at: https://www. bitbucket.org/remkoduursma/yplantqmc/ (last access: 18 June 2018), 2014.
Farquhar, G. D., Von Caemmerer, S., and Berry, J. A.: A biochemi-cal model of photosynthetic carbon dioxide assimilation in leaves of 3-carbon pathway species, Planta, 149, 78–90, 1980. Fatichi, S., Leuzinger, S., and Körner, C.: Moving
be-yond photosynthesis: from carbon source to sink-driven vegetation modeling, New Phytol., 201, 1086–1095, https://doi.org/10.1111/nph.12614, 2014.
Fatichi, S., Pappas, C., and Ivanov, V. Y.: Modeling plant– water interactions: an ecohydrological overview from the cell to the global scale, WIRes Water, 3, 327–368, https://doi.org/10.1002/wat2.1125, 2016.
Friend, A. D., Lucht, W., Rademacher, T. T., Keribin, R., Betts, R., Cadule, P., Ciais, P., Clark, D. B., Dankers, R., Fal-loon, P. D., Ito, A., Kahana, R., Kleidon, A., Lomas, M. R., Nishina, K., Ostberg, S., Pavlick, R., Peylin, P., Schaphoff, S., Vuichard, N., Warszawski, L., Wiltshire, A., and Wood-ward, F. I.: Carbon residence time dominates uncertainty in terrestrial vegetation responses to future climate and atmo-spheric CO2, P. Natl. Acad. Sci. USA, 111, 3280–3285,
https://doi.org/10.1073/pnas.1222477110, 2014.
Gunderson, C. A. and Wullschleger, S. D.: Photosynthetic acclima-tion in trees to rising atmospheric CO2: a broader perspective,
Photosynth. Res., 39, 369–388, 1994.
Hamilton, E. W., Frank, D. A., Hinchey, P. M., and Mur-ray, T. R.: Defoliation induces root exudation and triggers positive rhizospheric feedbacks in a temperate grass-land, Soil Biology and Biochemistry, 40, 2865–2873, https://doi.org/10.1016/j.soilbio.2008.08.007, 2008.
mea-sure to what we want to know, New Phytol., 211, 386–403, https://doi.org/10.1111/nph.13955, 2016.
Hartmann, H., McDowell, N. G., and Trumbore, S.: Alloca-tion to carbon storage pools in Norway spruce saplings under drought and low CO2, Tree Physiol., 35, 243–252,
https://doi.org/10.1093/treephys/tpv019, 2015.
Hartmann, H., Adams, H. D., Hammond, W. M., Hoch, G., Landhäusser, S. M., Wiley, E., and Zaehle, S.: Iden-tifying differences in carbohydrate dynamics of seedlings and mature trees to improve carbon allocation in mod-els for trees and forests, Environ. Exp. Bot., 152, 7–18, https://doi.org/10.1016/j.envexpbot.2018.03.011, 2018. Hughes, I. G. and Hase, T. P. A.: Measurements and their
Uncertain-ties A Practical Guide to Modern Error Analysis, Oxford Univer-sity Press, Oxford, UK, 2010.
Jain, A. K. and Yang, X.: Modeling the effects of two different land cover change data sets on the carbon stocks of plants and soils in concert with CO2and climate change, Global Biogeochem. Cy.,
19, GB2015, https://doi.org/10.1029/2004GB002349, 2005. Karst, J., Gaster, J., Wiley, E., and Landhäusser, S. M.: Stress
dif-ferentially causes roots of tree seedlings to exude carbon, Tree Physiol., 37, 154–164, https://doi.org/10.1093/treephys/tpw090, 2017.
Klein, T. and Hoch, G.: Tree carbon allocation dynamics deter-mined using a carbon mass balance approach, New Phytol., 205, 147–159, https://doi.org/10.1111/nph.12993, 2015.
Knorr, W. and Kattge, J.: Inversion of terrestrial ecosystem model parameter values against eddy covariance measurements by Monte Carlo sampling, Glob. Change Biol., 11, 1333–1351, 2005.
Körner, M., Waser, B., Rehmann, R., and Reubi, J. C.: Early over-expression of GRP receptors in prostatic carcinogenesis, The Prostate, 74, 217–224, https://doi.org/10.1002/pros.22743, 2014. Law, R. M., Kowalczyk, E. A., and Wang, Y. P.: Using atmospheric CO2 data to assess a simplified carbon-climate simulation for the 20th century, Tellus B, 58, 427–437, 2006.
Mahmud, K. and Medlyn, B.: R project to reproduce the fig-ures and analyses presented in the manuscript “Inferring the ef-fects of sink strength on plant carbon balance from experimen-tal measurements” by Mahmud et al. (2018), figshare, Code, https://doi.org/10.6084/m9.figshare.6594344.v3, 2018.
Mahmud, K., Medlyn, B., Duursma, R., and Campany, C.: Raw data files associated with the manuscript “Inferring the effects of sink strength on plant carbon balance from experimental measurements” by Mahmud et al. (2018), figshare, Dataset, https://doi.org/10.6084/m9.figshare.5125087.v13, 2018. Maina, G. G., Brown, J. S., and Gersani, M.: Intra-plant versus
inter-plant root competition in beans: avoidance, resource matching or tragedy of the commons, Plant Ecol., 160, 235–247, 2002. Makela, A., Landsberg, J., Ek, A. R., Burk, T. E., Ter-Mikaelian,
M., Agren, G. I., Oliver, C. D., and Puttonen, P.: Process-based models for forest ecosystem management: current state of the art and challenges for practical implementation, Tree Physiol., 20, 289–298, 2000.
McConnaughay, K. D. M. and Bazzaz, F. A.: Is Phys-ical Space a Soil Resource?, Ecology, 72, 94–103, https://doi.org/10.2307/1938905, 1991.
McMurtrie, R. and Wolf, L.: A model of competition between trees and grass for radiation, water and nutrients, Ann. Bot.-London, 52, 449–458, 1983.
Medlyn, B. E., Duursma, R. A., Eamus, D., Ellsworth, D. S., Pren-tice, I. C., Barton, C. V. M., Crous, K. Y., de Angelis, P., Free-man, M., and Wingate, L.: Reconciling the optimal and em-pirical approaches to modelling stomatal conductance, Glob. Change Biol., 17, 2134–2144, https://doi.org/10.1111/j.1365-2486.2010.02375.x, 2011.
Metropolis, N., Rosenbluth, A. W., Rosenbluth, M. N., Teller, A. H., and Teller, E.: Equation of State Calculations by Fast Computing Machines, J. Chem. Phys., 21, 1087–1092, https://doi.org/10.1063/1.1699114, 1953.
Mitchell, R. J., Liu, Y., O’Brien, J. J., Elliott, K. J., Starr, G., Miniat, C. F., and Hiers, J. K.: Future climate and fire interactions in the southeastern region of the United States, Forest Ecol. Manag., 327, 316–326, https://doi.org/10.1016/j.foreco.2013.12.003, 2014.
Müller, C., Cramer, W., Hare, W. L., and Lotze-Campen, H.: Climate change risks for African agri-culture, P. Natl. Acad. Sci. USA, 108, 4313–4315, https://doi.org/10.1073/pnas.1015078108, 2011.
Nikinmaa, E., Sievänen, R., and Hölttä, T.: Dynamics of leaf gas exchange, xylem and phloem transport, water po-tential and carbohydrate concentration in a realistic 3-D model tree crown, Ann. Bot.-London, 114, 653–666, https://doi.org/10.1093/aob/mcu068, 2014.
Paul, M. J. and Foyer, C. H.: Sink regulation of photosynthesis, J. Exp. Bot., 52, 1383–1400, 2001.
Pinnington, E. M., Casella, E., Dance, S. L., Lawless, A. S., Morison, J. I. L., Nichols, N. K., Wilkinson, M., and Quaife, T. L.: Investigating the role of prior and obser-vation error correlations in improving a model forecast of forest carbon balance using Four-dimensional Variational data assimilation, Agr. Forest Meteorol., 228–229, 299–314, https://doi.org/10.1016/j.agrformet.2016.07.006, 2016.
Poorter, H., Bühler, J., van Dusschoten, D., Climent, J., and Postma, J. A.: Pot size matters: a meta-analysis of the effects of root-ing volume on plant growth, Funct. Plant Biol., 39, 839–850, https://doi.org/10.1071/fp12049, 2012a.
Poorter, H., Niklas, K. J., Reich, P. B., Oleksyn, J., Poot, P., and Mommer, L.: Biomass allocation to leaves, stems and roots: meta-analyses of interspecific variation and environmental con-trol, New Phytol., 193, 30–50, https://doi.org/10.1111/j.1469-8137.2011.03952.x, 2012b.
Pugh, T. A. M., Müller, C., Arneth, A., Haverd, V., and Smith, B.: Key knowledge and data gaps in modelling the influence of CO2
concentration on the terrestrial carbon sink, J. Plant Physiol., 203, 3–15, https://doi.org/10.1016/j.jplph.2016.05.001, 2016. Quaife, T., Lewis, P., De Kauwe, M., Williams, M., Law, B.
E., Disney, M., and Bowyer, P.: Assimilating canopy re-flectance data into an ecosystem model with an Ensem-ble Kalman Filter, Remote Sens. Environ., 112, 1347–1364, https://doi.org/10.1016/j.rse.2007.05.020, 2008.
Reich, P. B.: Key canopy traits drive forest productivity, P. Roy. Soc. B, 279, 2128–2134, https://doi.org/10.1098/rspb.2011.2270, 2012.
Hughes, H., Lee, J. T., Rodrigues, C., and Savage, K.: Estimating parameters of a forest ecosystem C model with measurements of stocks and fluxes as joint constraints, Oecol., 164, 25–40, https://doi.org/10.1007/s00442-010-1628-y, 2010.
Richardson, A. D., Carbone, M. S., Keenan, T. F., Czimczik, C. I., Hollinger, D. Y., Murakami, P., Schaberg, P. G., and Xu, X. M.: Seasonal dynamics and age of stemwood nonstructural carbo-hydrates in temperate forest trees, New Phytol., 197, 850–861, https://doi.org/10.1111/nph.12042, 2013.
Robbins, N. S. and Pharr, D. M.: Effect of Restricted Root Growth on Carbohydrate Metabolism and Whole Plant Growth of Cucumis sativus L., Plant Physiol., 87, 409–413, https://doi.org/10.1104/pp.87.2.409, 1988.
Rowland, L., Hill, T. C., Stahl, C., Siebicke, L., Burban, B., Zaragoza-Castells, J., Ponton, S., Bonal, D., Meir, P., and Williams, M.: Evidence for strong seasonality in the carbon stor-age and carbon use efficiency of an Amazonian forest, Glob. Change Biol., 20, 979–991, https://doi.org/10.1111/gcb.12375, 2014.
Running, S. W. and Gower, S. T.: FOREST-BGC, A general model of forest ecosystem processes for regional applications. II. Dy-namic carbon allocation and nitrogen budgets, Tree Physiol., 9, 147–160, https://doi.org/10.1093/treephys/9.1-2.147, 1991. Sage, R. F.: Acclimation of photosynthesis to increasing
atmo-spheric CO2: the gas-exchange perspective, Photosynth. Res.,
39, 351–368, 1994.
Sala, A., Woodruff, D. R., and Meinzer, F. C.: Carbon dynam-ics in trees: feast or famine?, Tree Physiol., 32, 764–775, https://doi.org/10.1093/treephys/tpr143, 2012.
Schiestl-Aalto, P., Kulmala, L., Mäkinen, H., Nikinmaa, E., and Mäkelä, A.: CASSIA – a dynamic model for pre-dicting intra-annual sink demand and interannual growth variation in Scots pine, New Phytol., 206, 647–659, https://doi.org/10.1111/nph.13275, 2015.
Schwarz, G.: Estimating the Dimension of a Model, Ann. Statist., 6, 461–464, https://doi.org/10.1214/aos/1176344136, 1978.
Thornley, J. H. M. and Cannell, M. G. R.: Modelling the Components of Plant Respiration: Representa-tion and Realism, Ann. Bot.-London, 85, 55–67, https://doi.org/10.1006/anbo.1999.0997, 2000.
Thornton, P. E., Lamarque, J.-F., Rosenbloom, N. A., and Mahowald, N. M.: Influence of carbon-nitrogen cycle cou-pling on land model response to CO2 fertilization and climate variability, Global Biogeochem. Cy., 21, GB4018, https://doi.org/10.1029/2006GB002868, 2007.
Van Oijen, M.: Bayesian Calibration (BC) and Bayesian Model Comparison (BMC) of Process-Based Models: Theory, Imple-mentation and Guidelines, NERC/Centre for Ecology & Hydrol-ogy, 16 p., 2008.
Villar, R. and Merino, J.: Comparison of leaf construc-tion costs in woody species with differing leaf life-spans in contrasting ecosystems, New Phytol., 151, 213–226, https://doi.org/10.1046/j.1469-8137.2001.00147.x, 2001. Wiley, E. and Helliker, B.: A re-evaluation of carbon storage in
trees lends greater support for carbon limitation to growth, New Phytol., 195, 285–289, https://doi.org/10.1111/j.1469-8137.2012.04180.x, 2012.
Williams, M., Schwarz, P. A., Law, B. E., Irvine, J., and Kurpius, M. R.: An improved analysis of forest carbon dynamics using data assimilation, Glob. Change Biol., 11, 89–105, 2005.
Zaehle, S. and Friend, A. D.: Carbon and nitrogen cy-cle dynamics in the O-CN land surface model: 1. Model description, site-scale evaluation, and sensitivity to pa-rameter estimates, Global Biogeochem. Cy., 24, GB1005, https://doi.org/10.1029/2009GB003521, 2010.