Biogeosciences, 15, 6909–6925, 2018 https://doi.org/10.5194/bg-15-6909-2018 © Author(s) 2018. This work is distributed under the Creative Commons Attribution 4.0 License.
Leaf area index identified as a major source of variability in
modeled CO
2
fertilization
Qianyu Li1,2,3, Xingjie Lu4, Yingping Wang5, Xin Huang4, Peter M. Cox3, and Yiqi Luo1,4
1Ministry of Education Key Laboratory for Earth System Modeling, Department of Earth System Science, Tsinghua University, Beijing 100084, China
2National Supercomputing Center in Wuxi, Wuxi 214000, China
3College of Engineering, Mathematics and Physical Sciences, University of Exeter, Exeter, EX4 4QF, UK 4Center for Ecosystem Science and Society (Ecoss), Northern Arizona University, Flagstaff, AZ 86011, USA 5CSIRO Oceans and Atmosphere, PMB #1, Aspendale, Victoria 3195, Australia
Correspondence:Yiqi Luo ([email protected]) Received: 27 April 2018 – Discussion started: 8 May 2018
Revised: 24 October 2018 – Accepted: 27 October 2018 – Published: 19 November 2018
Abstract. The concentration–carbon feedback (β), also called the CO2 fertilization effect, is a key unknown in climate–carbon-cycle projections. A better understanding of model mechanisms that govern terrestrial ecosystem re-sponses to elevated CO2 is urgently needed to enable a more accurate prediction of future terrestrial carbon sink. We conducted C-only, carbon–nitrogen (C–N) and carbon– nitrogen–phosphorus (C–N–P) simulations of the Commu-nity Atmosphere Biosphere Land Exchange model (CABLE) from 1901 to 2100 with fixed climate to identify the most critical model process that causes divergence in β. We cal-culated CO2 fertilization effects at various hierarchical lev-els from leaf biochemical reaction and leaf photosynthesis to canopy gross primary production (GPP), net primary produc-tion (NPP), and ecosystem carbon storage (cpool) for seven C3 plant functional types (PFTs) in response to increasing CO2 under the RCP 8.5 scenario. Our results show thatβ values at biochemical and leaf photosynthesis levels vary lit-tle across the seven PFTs, but greatly diverge at canopy and ecosystem levels in all simulations. The low variation of the leaf-levelβ is consistent with a theoretical analysis that leaf photosynthetic sensitivity to increasing CO2concentration is almost an invariant function. In the CABLE model, the ma-jor jump in variation ofβ values from leaf levels to canopy and ecosystem levels results from divergence in modeled leaf area index (LAI) within and among PFTs. The correlation of βGPP,βNPP, orβcpooleach withβLAIis very high in all sim-ulations. Overall, our results indicate that modeled LAI is a
key factor causing the divergence inβin the CABLE model. It is therefore urgent to constrain processes that regulate LAI dynamics in order to better represent the response of ecosys-tem productivity to increasing CO2in Earth system models.
1 Introduction
els, Smith et al. (2016) suggested that Earth system mod-els (ESMs) in CMIP5 overestimate global terrestrial β val-ues compared with remote sensing data and Free-Air CO2 Enrichment (FACE) experimental results. Though satellite products they used may underestimate the effect of CO2 fertilization on net primary productivity (De Kauwe et al., 2016), the large disparity between models and FACE experi-ments gives us little confidence in making policies to combat global warming.
The response of the ecosystem carbon cycle to elevated CO2(eCO2) is primarily driven by stimulation of leaf-level carboxylation rate in plants (Polglase and Wang, 1992; Long et al., 2004; Heimann et al., 2008). The CO2stimulation of carboxylation then translates into increasing gross primary production (GPP) and net primary production (NPP), pos-sibly leading to increased biomass and soil carbon storage and slowing down anthropogenically driven increase in at-mospheric CO2(Canadell et al., 2007; Iversen et al., 2012). The leaf-level CO2 fertilization for C3 plants is generally well characterized with models from Farquhar et al. (1980), and the basic biochemical mechanisms have been adopted by most land-surface models, although some models im-plement variants of Farquhar et al. (1980) (Rogers et al., 2016). Previous research with both theoretical analysis and data synthesis from a large number of experiments has re-vealed that normalized CO2sensitivity of leaf-level photo-synthesis, which represents kinetics sensitivity of photosyn-thetic enzymes, varies little among different C3species at a given CO2concentration (Luo and Mooney, 1996; Luo et al., 1996). However, the CO2 fertilization effects are consider-ably more variable at canopy and ecosystem level than at the leaf level, because a cascade of uncertain processes, such as soil moisture feedback (Fatichi et al., 2016), canopy scaling (Rogers et al., 2016), nutrient limitation (Zaehle et al., 2014), allocation (De Kauwe et al., 2014), and carbon turnover pro-cess (Friend et al., 2014), influences the responses of GPP, NPP and carbon storage. Therefore, understanding which processes in ecosystem models amplify the variability inβ from biochemical and leaf levels to canopy and ecosystem levels is quite important.
Leaf area index (LAI) largely affects canopy assimilation and plant growth under eCO2. Many satellite products ex-hibit increasing trends of LAI over the past 30 years, al-though marked disparity still exists among these products (Jiang et al., 2017). Zhu et al. (2016) have attributed global increases in satellite LAI primarily to increased CO2 con-centration. LAI plays a key role in scaling leaf-level biogeo-physical and biogeochemical processes to global-scale re-sponses in ecosystem models, and the representation of LAI in models causes large uncertainty (Ewert, 2004; Hasegawa et al., 2017). Models generally predict that LAI dynamics will respond to eCO2 positively due to enhanced NPP and leaf biomass (De Kauwe et al., 2014). But how the increas-ing LAI in turn feeds back to ecosystem carbon uptake as a result of more light interception has not been discussed in
previous research. The relative contributions of the leaf-level photosynthesis and LAI to modeledβhave rarely been quan-tified and compared.
The CO2fertilization effects depend on locations, vegeta-tion types and soil nutrient condivegeta-tions. The strongest absolute CO2fertilization effect has been found in tropical and tem-perate forests where the larger biomass presents than other regions. In comparison, the weakest response toeCO2 oc-curs in boreal forests (Joos et al., 2001; Peng et al., 2014). But with gradualeCO2, relative response in tropical forests might not be very high owing to light limitation caused by canopy closure (Norby et al., 2005). In addition,β might be overestimated by the neglect of nitrogen (N) limitations on plant growth (Luo et al., 2004; Thornton et al., 2009; Coskun et al., 2016). Several lines of evidence suggest that N avail-ability also influences decomposition of soil organic matter (Hunt et al., 1988; Neff et al., 2002; Averill et al., 2016).β will be reduced by 50 %–78 % in C–N coupled simulations compared with C-only simulations in land-surface models (Thornton et al., 2007; Sokolov et al., 2008; Zaehle et al., 2010). Inadequate phosphorus (P) will also constrain terres-trial carbon uptake, especially in tropical areas (Aerts and Chapin, 2000; Vitousek et al., 2010). It is reported that N limitation on carbon uptake is significant in boreal ecosys-tems, while P limitation has a profound influence in tropical ecosystems in the CASA-CNP model (Wang et al., 2010). However, whether N and P limitations affect the variability ofβ across different vegetation types at different hierarchi-cal levels from biochemistry to ecosystem carbon storage has not been carefully examined.
In this study, we tried to answer the following questions: how does variability, as measured by the coefficient of vari-ation (CV) within and across different plant functional types (PFTs), in the CO2fertilization effect change at different hi-erarchical levels from leaf to canopy GPP, ecosystem NPP and total carbon storage levels? What is the most important process causing the variability ofβ for different geograph-ical locations and PFTs? How do nutrient limitations influ-ence the variability ofβat different hierarchical levels? We used the Community Atmosphere Biosphere Land Exchange model (CABLE) to identify key mechanisms driving diverse βvalues under the RCP 8.5 scenario.
2 Materials and methods
2.1 CABLE model description
Q. Li et al.: Leaf area index identified as a major source 6911
The descriptions of the photosynthesis module are in Supple-ment S1.
Leaf area index (LAI) is calculated as
LAI=Cleaf·SLA, (1)
where Cleafis leaf carbon pool and SLA is specific leaf area. In the CABLE model, leaf growth is divided into four phases. Phase 1 is from leaf budburst to the beginning of steady leaf growth, phase 2 is from the start of steady leaf growth to the start of leaf senescence, phase 3 is the period of leaf senescence, and phase 4 is from the end of leaf senes-cence to the start of leaf bud burst. During phase 1, allocation of available carbon to leaf is fixed to 0.8, and allocations to wood and root are set to 0.1 for woody biomes and 0 and 0.2, respectively, for non-woody biomes. During steady leaf growth (phase 2), the allocation coefficients are constants but vary from biome to biome, taking their values from Fung et al. (2005). During phases 3 and 4, the leaf allocation is zero and available carbon is divided between wood and root in proportion to their allocation coefficients. For evergreen biomes, leaf phenology remains at phase 2 throughout the year (Wang et al., 2010). SLA is PFT-specific and does not change through time in this study.
GPP is the sum of canopy net photosynthesis rate (A) and day respiration (Rd). NPP is calculated as the difference be-tween GPP and autotrophic respiration (Ra) (including main-tenance and growth respiration), and acts as an input to the compartmental nine-pool carbon-cycle model. The network for carbon transfer in the compartmental model is based on the CASA’ model (Fung et al., 2005), including three vegeta-tion pools (leaf, wood and root), three litter pools (metabolic litter, structure litter and coarse wood debris), and three soil pools (fast soil pool, slow soil pool and passive soil pools). Heterotrophic soil respiration (Rh) is calculated as the sum of the respired CO2from the decomposition of all litter and soil organic carbon pools (Wang et al., 2010).
Wang et al. (2012) and Zhang et al. (2013) provided de-tails explaining how nutrient limitations are incorporated into the carbon cycle in the CASA-CNP module in the CABLE model. In brief, NPP is calculated as
NPP=GPP(LAI, Vcmax(Nl), Jmax(Nl))
−X
iRmi(Ni)−Rg
N
l Pl
, (2)
where LAI represents leaf area index, and Vcmax andJmax are maximum carboxylation rate and maximum rate of elec-tron transport of the top leaves, respectively; both are lin-early dependent on leaf N (g N m−2) according to the re-lationships developed by Kattge et al. (2009) for different plant functional types. Rmi is maintenance respiration rate of plant tissue (i: leaf, wood and root), contingent on nitro-gen amount in each part of the plant. Rg is growth respi-ration, which is described as a function of leaf nitrogen to phosphorus ratio. Heterotrophic respiration (Rh) is limited
by the mineral N pool required for microbial soil carbon de-composition (Wang et al., 2010). Net ecosystem productivity (NEP=GPP−Ra−Rh) is the amount of carbon that is ei-ther sequestered or lost from ecosystems, and is controlled by N and P availability via abovementioned C–N–P interac-tions.
2.2 Experimental design
CABLE was run from 1901 to 2100 for C-only, C–N and C–N–P modes. C-only simulation was designed to identify the key carbon-cycle processes that influence the variability of the CO2fertilization effects. C–N and C–N–P simulations were run to explore how nutrients affect the patterns of and mechanisms underlying the variability of the CO2 fertiliza-tion effects. The respective effects of N and P can be cal-culated through the difference in the carbon uptake between C–N and C-only or C–N–P and C–N simulations. CABLE was first spun up by using meteorological forcing from Com-munity Climate System Model (CCSM) simulations (Hurrell et al., 2013) during 1901 to 1910 until steady states were achieved for the C-only, C–N and C–N–P cases separately. Hourly meteorological driving data include temperature, spe-cific humidity, air pressure, downward solar radiation, down-ward long-wave radiation, rainfall, snowfall, and wind. In or-der to separate the CO2fertilization effect from the effect of climate change, climate forcing was held as the average an-nual cycle of CCSM meteorological data from 1901 to 2100. Atmospheric CO2 concentrations from 1901 to 2100 were taken from the CMIP5 dataset, representing global annual averages and the RCP 8.5 scenario after 2010 (Etheridge et al., 1996; MacFarling Meure et al., 2006). The spatial reso-lution of CABLE used here is 1.9◦×2.5◦(latitude vs.
longi-tude). N deposition is prescribed from atmospheric transport models (Lamarque et al., 2010, 2011), spatially explicit but fixed as the average from 1901 to 2100 in time. N fixation is prescribed from a process-based model, spatially explicit but constant in time (Wang and Houlton, 2009). P enters ecosys-tems through constant rates of weathering and atmospheric deposition (from Mahowald et al., 2008).
2.3 Calculation ofβvalues at five hierarchical levels
βvalues of these variables were calculated as the normalized sensitivities of those variables to atmospheric CO2 concen-tration (Ca) asβV:
βV = 1 V ·
dV dCa
, (3)
whereV in the denominator represents the average annual value of Ssun, Ssha, LAI, GPP, GPPsun, GPPsha, NPP and ecosystem carbon storage between 2 consecutive years. Sub-scripts “sun” and “sha” denote the sunlit and shaded compo-nents. dV is the difference of these variables between 2 con-secutive years. dCais the difference of the correspondingCa. The unit ofβV is ppm−1. It should be noted thatβV is the relative response, which is similar to the traditional defini-tion of theβfactor by Bacastow and Keeling (1973), but dif-ferent from the carbon–concentration feedback parameter in Friedlingstein et al. (2006). The relative response facilitates the comparison among PFTs with different initial biomass and the comparison across carbon fluxes and storages with different units.
Leaf biochemical response (L) was first proposed by Luo et al. (1996). TheLfunction is the normalized response of leaf photosynthesis rate to a small change in intercellular CO2concentration (Ci) and has been suggested to be an in-variant function for C3plants grown in diverse environments. The rate of photosynthesis is typically RuBP-regeneration-limited under a high CO2concentration. We found photosyn-thesis rates are increasingly limited by RuBP regeneration under the RCP 8.5 scenario. Besides, theoretical analysis by Luo and Mooney (1996) showed that biochemical responses are similar for either Rubisco- or RuBP-limited photosynthe-sis. In this study,Lcan be used to indicate leaf biochemical response toeCO2. For sunlit leaf and shaded leaf, formula-tions ofLunder RuBP-regeneration limitation are defined as
Lsun=
3·0∗sun
(Cisun+2·0∗sun) (Cisun−0∗sun)
, (4)
Lsha=
3·0∗sha
(Cisha+2·0∗sha) (Cisha−0∗sha)
. (5)
In this study,0∗sunand0∗shaare yearly average CO2 com-pensation points in the absence of day respiration for sunlit leaf and shaded leaf, respectively.Ci varies significantly on sub-daily, intra-annual and annual bases. We are inter-ested in howCi responds toeCO2on an inter-annual basis. So, we first outputted hourlyCi and then calculated yearly GPP-weighted averageCi for sunlit leaf (Cisun) and shaded leaf (Cisha).
Then leaf-levelβpis defined as the product ofLandddCCi a. For sunlit leaf and shaded leaf, the formulations are
βpsun=Lsun· dCisun
dCa
, (6)
βpsha=Lsha· dCisha
dCa
. (7)
Leaf-to-canopy scaling factor (S) scales fluxes at the single top leaf of the canopy to whole canopy fluxes. The formula-tions ofSfor sunlit leaves and shaded leaves are
Ssun=
1−exp[−LAI(kn+kb)] kn+kb
, (8)
Ssha=
1−exp(−knLAI) kn
−1−exp [−LAI(kn+kb)]
kn+kb
, (9) wherekbis the extinction coefficient of a canopy of black leaves for direct beam radiation.knis an empirical param-eter used to describe the vertical distribution of leaf nitro-gen in the canopy (Kowalczyk et al., 2006). In our simula-tion,kn is uniformly assigned as 0.001 for different PFTs. The leaf-to-canopy scaling factor varies with time because kbis the function of Sun angle, and LAI varies seasonally and inter-annually. The annual value of the leaf-to-canopy scaling factor was just calculated as the average of hourly leaf-to-canopy scaling factors in a year.
Big-leaf βGPPsun (or βGPPsha) can be decomposed as the sum of normalized sensitivity of photosynthesis rate,βpsun(or βpsha), and leaf-to-canopy scaling factor,βSsun (or βSsha), as shown in Eqs. (10) and (11). Detailed mathematical deriva-tions are in Supplement S2.
βGPPsun=βpsun+βSsun (10)
βGPPsha=βpsha+βSsha (11)
Q. Li et al.: Leaf area index identified as a major source 6913
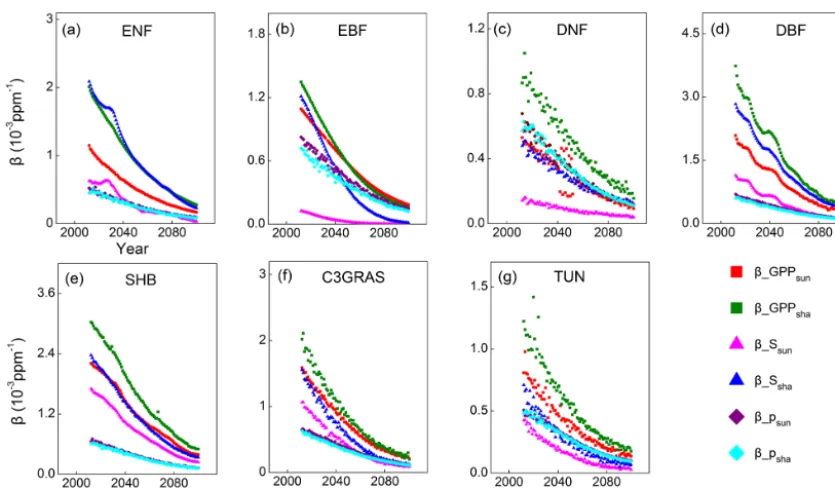
Figure 1.Temporal trends ofβcpoolfrom 2011 to 2100 for C3PFTs from CABLE-C-only(a), CABLE-CN(b), and CABLE-CNP(c) sim-ulations.βcpool values for different C3PFTs all decline with time from 2011 to 2100 under the RCP 8.5 scenario, but the magnitudes of βcpool differ across them in all simulations. In C–N and C–N–P simulations, magnitudes ofβcpool are reduced compared with those in C-only simulation for all C3PFTs except evergreen broadleaf forest. ENF, evergreen needleleaf forest (light green squares); EBF, evergreen broadleaf forest (red circles); DNF, deciduous needleleaf forest (dark blue triangles); DBF, deciduous broadleaf forest (pink triangles); SHB, shrub (dark green diamonds); C3GRAS, C3grass (dark blue stars); TUN, tundra (orange diamonds).
same PFTs. All abovementioned calculations were processed in MATLAB R2014b.
3 Results
3.1 Temporal trends ofβat ecosystem level for different PFTs
In C-only simulation,βcpoolvalues for different C3PFTs all decline with time from 2011 to 2100 under the RCP 8.5 scenario (Fig. 1a). However, the magnitudes of βcpool dif-fer among difdif-ferent PFTs, with the highest values occur-ring in deciduous broadleaf forest from 2011 to 2075 and in shrub after 2075, and the lowest values occurring in de-ciduous needleleaf forest and tundra.βcpoolvalues for decid-uous needleleaf forest and tundra nearly overlap over time. As compared with C-only simulation, values ofβcpoolare re-duced when N limitation is included as in C–N simulation for all C3PFTs except evergreen broadleaf forest (Fig. 1b). De-ciduous broadleaf forest and evergreen broadleaf forest have the greatestβcpoolvalues, while deciduous needleleaf forest and tundra still have the lowestβcpoolvalues in C–N simula-tion. When both N and P limitations are taken into account as in C–N–P simulation, magnitudes and trends ofβcpoolare
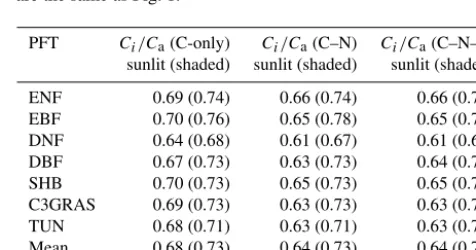
Table 1.The ratio of intercellular CO2concentration (Ci) to atmo-spheric CO2concentration (Ca) for different C3PFTs, and mean and coefficient of variation (CV) across these PFTs ofCi/Cain C-only, C–N, and C–N–P simulations of CABLE under the RCP 8.5 scenario. Values for shaded leaves are in brackets. Abbreviations are the same as Fig. 1.
PFT Ci/Ca(C-only) Ci/Ca(C–N) Ci/Ca(C–N–P) sunlit (shaded) sunlit (shaded) sunlit (shaded)
ENF 0.69 (0.74) 0.66 (0.74) 0.66 (0.79)
EBF 0.70 (0.76) 0.65 (0.78) 0.65 (0.78)
DNF 0.64 (0.68) 0.61 (0.67) 0.61 (0.67)
DBF 0.67 (0.73) 0.63 (0.73) 0.64 (0.73)
SHB 0.70 (0.73) 0.65 (0.73) 0.65 (0.73)
C3GRAS 0.69 (0.73) 0.63 (0.73) 0.63 (0.73)
TUN 0.68 (0.71) 0.63 (0.71) 0.63 (0.71)
Mean 0.68 (0.73) 0.64 (0.73) 0.64 (0.73)
CV 0.03 (0.03) 0.03 (0.05) 0.03 (0.06)
[image:5.612.308.546.503.628.2]3.2 Variations of intercellular CO2concentration and
CO2compensation point
To reveal which processes cause the large disparity of β across PFTs as shown in Fig. 1, we first compared intercel-lular CO2 concentration (Ci) and CO2 compensation point in the absence of day respiration (0∗), which are critical
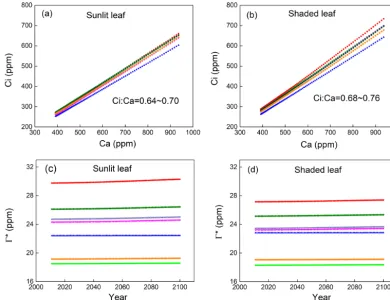
pa-rameters for leaf-level biochemical response. In C-only sim-ulation, the ratio ofCi toCa (Ci/Ca) is approximately con-stant with eCO2 for each PFT (Fig. 2a, b). For sunlit leaf, Ci/Cavalues range from 0.64 to 0.70 with CV=0.03 across different C3 PFTs (Table 1). Ci/Ca values for shaded leaf are higher than those for sunlit leaf, and the range is 0.68 to 0.76 with CV=0.03 across different C3PFTs (Table 1). Ev-ergreen broadleaf forest has the greatestCi/Cavalue, while deciduous needleleaf forest has the lowest Ci/Ca value. In C–N simulation,Ci/Cavalues for sunlit leaf are lower than those for the same PFT in C-only simulation, while Ci/Ca values for shaded leaf change little as compared with those for the same PFT in C-only simulation (Table 1 and Fig. S2). Ci/Ca values for both sunlit and shaded leaves in C–N–P simulation are very similar to those in C–N simulation (Ta-ble 1 and Fig. S3).
In all of the simulations, values of CO2 compensation point in the absence of day respiration (0∗) for a specific PFT
do not change over time since air temperature as an input to the model is not affected by the biophysical feedback in the offline model simulations (Figs. 2c, d, S2c, d, S3c, d). But there is a huge variance of0∗ across different C3 PFTs be-cause of different leaf temperature which0∗values depend
on.
3.3 Comparison ofβat different hierarchical levels
To further trace the cause of the divergence of β across PFTs as shown in Fig. 1 at a specific time,Lsun,Lsha,βpsun, βpsha, βGPP,βNPP andβcpool at the year 2023 for different C3 PFTs in all simulations were plotted in Fig. 3. CV is marked above data points for each variable to indicate de-gree of variation across different C3PFTs. In C-only simu-lation (Fig. 3a), results show that at leaf biochemical level, Lvalues for sunlit leaf and shaded leaf range from 0.00055 to 0.00097 ppm−1. Variations ofLsunandLsha among PFTs are small (CV=0.15 and 0.13). At leaf photosynthesis level, βpsun and βpsha for the seven PFTs vary from 0.00041 to 0.00072 ppm−1, and the variations among different PFTs are not significant (CV=0.18 and 0.12). But β values are di-verging when scaled up to GPP level, with CV jumping to 0.49 among PFTs. β values of deciduous broadleaf for-est and shrub greatly increase from leaf level to GPP level. However, canopy scaling effects do not significantly amplify β values at canopy levels (βGPP) for deciduous needleleaf forest, tundra and evergreen broadleaf forest. Magnitudes and variance of βNPP are similar to those ofβGPP because NPP linearly correlates with GPP for all C3PFTs (Fig. S4).
Magnitudes ofβcpool for all PFTs are decreased compared with those of βNPP and βGPP. Deciduous broadleaf forest and shrub have the highestβGPP andβNPP values (around 0.0026 ppm−1). Deciduous broadleaf forest has the greatest βcpool value (around 0.0018 ppm−1) among all. Deciduous needleleaf forest has the lowestβGPP,βNPP andβcpool val-ues. CV ofβcpool among different PFTs reaches the highest (0.58) compared with CV ofβvalues at other levels.
In C–N and C–N–P simulations, magnitudes and vari-ations of β at leaf biochemical and photosynthetic levels are comparable to those in C-only simulation because Ci and 0∗ values only slightly change under nutrient
limita-tions (Figs. 3b, c, S2, S3). Nutrient-limitedβGPPvalues are smaller than those in C-only simulation, except for evergreen broadleaf forest. There is a large divergence of nutrient-limited βGPP across different PFTs, which is similar to C-only simulation. However, unlike in C-C-only simulation,βNPP values in nutrient-coupled simulations are reduced for most C3PFTs and diverge more compared withβGPPvalues. Coef-ficients of variation (CVs) ofβcpoolin nutrient-coupled sim-ulations exceed 0.8, larger than that in C-only simulation.
Within-PFT variations of β in C-only simulation were listed in Table 2, including CVs for biochemical response L, leaf-levelβp,βGPP,βNPPandβcpool across different geo-graphical locations within each PFT. Variations of biochem-ical and leaf-level responses are relatively smaller than those at canopy and ecosystem levels within all C3 PFTs. βGPP values are greatly differentiated across different geograph-ical locations. Variations ofβNPP are very similar to those ofβGPPwithin all PFTs except the evergreen needleleaf for-est. CVs ofβcpoolare lower than those ofβNPPwithin most PFTs except evergreen broadleaf forest and tundra. Within-PFT variations ofβin C–N and C–N–P simulations are sim-ilar to those in C-only simulation (data not shown).
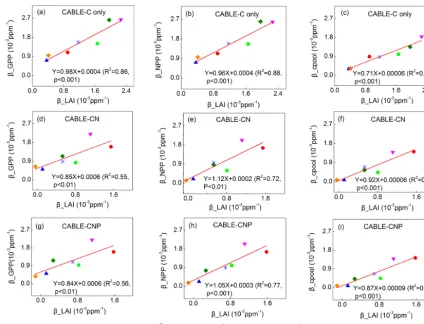
To further explore whyβ values at canopy and ecosys-tem levels are diverging across different C3 PFTs, the cor-relations betweenβGPPandβLAI,βNPPandβLAI,βcpool and βLAI for C-only, C–N and C–N–P simulations were plotted at the year 2023. Results show that βGPP,βNPP andβcpool all have significant linear correlations withβLAIacross dif-ferent C3PFTs (Fig. 4). Results also show thatβLAIlinearly correlates withβGPP,βNPPandβcpool across patches within the same PFT, although there are some discontinuous points within evergreen broadleaf forest where the canopy of many patches closes (Figs. S5–S7). Therefore variations ofβ val-ues from leaf to ecosystem scale can be well explained by βLAIor the LAI response to increasing CO2.
3.4 βof sunlit and shaded leaves
Q. Li et al.: Leaf area index identified as a major source 6915
Figure 2.Responses of yearly intercellular CO2concentration (Ci) toeCO2of a single sunlit leaf(a)and shaded leaf(b)for C3PFTs from CABLE-C-only simulation. Temporal trends of CO2compensation point in the absence of day respiration (0∗) for sunlit leaf(c)and
shaded leaf(d)from 2011 to 2100 from CABLE-C-only simulation. The ratio ofCitoCa(Ci/Ca) is approximately constant witheCO2for each PFT and varies little across PFTs.0∗values vary across different PFTs, but do not change over time for each PFT. Abbreviations and
symbols are the same as Fig. 1.
Table 2.Coefficients of variation ofL,βp,βGPP,βNPPandβcpoolacross different geographical locations within each C3PFT at the year 2023 in the CABLE-C-only simulation. The two numbers in the same unit are for sunlit leaves and shaded leaves, respectively. Values for shaded leaves are in brackets. Abbreviations are the same as Fig. 1.
PFT CV (L) CV (βp) CV (βGPP) CV (βNPP) CV (βcpool) sunlit (shaded) sunlit (shaded)
ENF 0.27 (0.30) 0.41 (0.42) 1.77 2.68 1.40 EBF 0.26 (0.29) 0.24 (0.28) 0.55 0.54 0.60 DNF 0.26 (0.28) 0.25 (0.28) 1.19 1.20 0.30 DBF 0.39 (0.38) 0.42 (0.37) 1.29 1.42 0.85 SHB 0.33 (0.32) 0.30 (0.49) 1.24 1.23 1.12 C3GRAS 0.38 (0.34) 0.35 (0.34) 1.12 1.10 0.98 TUN 0.35 (0.34) 0.36 (0.37) 1.86 1.85 1.92
1901 to 2100 in Fig. 5. From the beginning of the simula-tion, GPPshais higher than GPPsunfor all C3PFTs. With sig-nificant increases in CO2concentration from 2011, GPPsha responds more drastically than GPPsun. Shaded leaf GPP of deciduous broadleaf forest and shrub responds toeCO2more significantly than other PFTs. However, a single sunlit leaf has a higher photosynthesis rate (psun) than a shaded leaf
(psha) because of more radiation absorbed. Thus, the LAI-dependent canopy scaling factor of shaded leaves (Ssha) con-tributes more to the magnitude and sensitivity of canopy GPP than photosynthesis rate.
[image:7.612.129.467.494.605.2]Figure 3.Biome-levelβvalues at different levels at the year 2023 from CABLE-C-only(a), CABLE-CN(b), and CABLE-CNP(c) simu-lations. CV means coefficient of variation of biome-levelβacross C3PFTs.βvalues at biochemical (LsunandLshafor sunlit and shaded leaves, respectively) and leaf levels (βpsun andβpsha for sunlit and shaded leaves, respectively) are very similar across PFTs, but greatly diverge at canopy level (βGPP) and ecosystem levels (βNPPandβcpool) in all simulations. Unlike in C-only simulation,βNPPdiverges more thanβGPPacross different PFTs in nutrient-coupled simulations. Abbreviations and symbols are the same as Fig. 1.
above inference. Results show that both of the sensitivities of GPPsun and GPPsha tend to approach zero through time because the decomposing factorsβpsun,βpsha,βSsun andβSsha all decline with time (Fig. 6).βpsun andβpshaoverlap through time for each PFT. Magnitudes of βGPPsha are higher than those ofβGPPsun for all C3PFTs because the values ofβSsha are higher than those ofβSsun. For deciduous needleleaf for-est and tundra, bothβpsun(βpsha) andβSsun(βSsha)contribute to the magnitudes and trends ofβGPPsun(βGPPsha). For evergreen needleleaf forest, deciduous broadleaf forest, shrub and C3 grass, βSsun(βSsha) dominates the magnitude and change in βGPPsun(βGPPsha). For evergreen broadleaf forest, βSsha pre-dominates the magnitude and change inβGPPshabefore 2035.
4 Discussion
4.1 Variations of biochemical and photosynthetic responses toeCO2
The direct CO2fertilization effect occurs at leaf level and is determined by kinetic sensitivity of Rubisco enzymes to in-ternal leaf CO2concentration. In fact, the normalized
short-term sensitivity of leaf-level photosynthesis to CO2is mainly regulated byCi and slightly influenced by leaf temperature, regardless of light, nutrient availability, and species charac-teristics (Luo et al., 1996; Luo and Mooney, 1996). In our study, the modeled Ci/Ca ratio is approximately constant witheCO2 for a specific PFT, and varies little within and across PFTs in all simulations. This is in line with FACE experimental results which show almost constantCi/Ca val-ues for different PFTs under CO2fertilization (Drake et al., 1997; Long et al., 2004).0∗varies little for different species
and only depends on leaf temperature (Luo and Mooney, 1996). Sensitivity analysis in a previous study has shown that a±5◦of leaf temperature changes caused approximately
±7 ppm changes in0∗, leading to variation of 0.12 to
leaf-level β (Luo and Mooney, 1996). The overall variation of leaf-levelβ caused by variation in leaf temperature is still quite small compared with that ofβGPP. Therefore, biochem-ical and leaf-levelβvalues vary little within and among PFTs in this study. Our results also illustrate that nutrient effects do not significantly changeCi and0∗, leading to similar
Q. Li et al.: Leaf area index identified as a major source 6917
Figure 4.Correlations betweenβGPPandβLAI,βNPPandβLAI, andβcpoolandβLAIat the year 2023 across C3PFTs from CABLE-C-only(a–c), CABLE-CN(d–f)and CABLE-CNP(g–i)simulations.βGPP,βNPPandβcpoolall have significant linear correlations withβLAI in all simulations. Abbreviations and symbols are the same as Fig. 1.
To identify the source of uncertainty of β in CMIP5 models, Hajima et al. (2014) decomposed β into several carbon-cycle components. They used GPP divided by LAI (GPP/LAI) as a proxy to represent leaf-level photosynthe-sis for CMIP5 models, since there are no leaf-level pro-cess outputs of these models. They found the sensitivities of GPP/LAI to eCO2 diverged a lot among models. One possible issue of this calculation is that it ignores different canopy structures used by each CMIP5 model, such as big-leaf, two-leaf or multiple-layer. Our results just show that the sensitivities of GPP/LAI are different from our mechanis-tic calculation of leaf-levelβfor different PFTs in a two-leaf model.β values estimated from GPP/LAI formulation are greatly underestimated for woody trees and slightly overes-timated for C3grass and tundra, but best match for shrub if compared with our calculation (Fig. S8). Therefore diagnos-tics such asCiand0∗for leaf-levelβare more desirable for
woody trees. Another advantage of our calculation of leaf-level β is that the reason for the divergence of leaf-levelβ across PFTs can be traced back to the difference fromCiand leaf temperature as shown in Fig. 2.
4.2 Variations ofβat canopy and ecosystem levels
Figure 5.Temporal trends of GPPsun(red points) and GPPsha(black points) for C3PFTs from 1901 to 2100 from CABLE-C-only simulation. GPPshais higher than GPPsunfor all PFTs. With significant increase in CO2concentration from 2011, GPPsharesponds more drastically than GPPsun. Abbreviations are the same as Fig. 1.
The evidence all suggests LAI is a key process in modeling the response of ecosystem carbon cycle to climate change.
It has been reported that different CMIP5 models have simulated diverse LAI during 1985–2006. And modeled LAI values in most CMIP5 models have been overestimated ac-cording to satellite products (Anav et al., 2013). Many global vegetation models simulated increasing LAI trends globally in response toeCO2during the historical period (Zhu et al., 2016). Our modeling study also shows that LAI responds positively to eCO2 for all C3 PFTs in all simulations. But experimental results are not consistent. In one review paper with 12 FACE experimental results, trees had a 21 % increase in LAI and herbaceous C3grasses did not show a significant change in LAI (Ainsworth and Long, 2005). Some studies reported that LAI dynamics did not significantly change in specific FACE experiments, such as in a closed-canopy de-ciduous broadleaf forest (ORNL FACE, Norby et al., 2003) and in a mature evergreen broadleaf forest (EucFACE, Du-ursma et al., 2016). The negligible change in LAI at the Euc-FACE probably leads to an insignificant response of produc-tivity at this site, even though leaf photosynthesis rate signifi-cantly increases undereCO2(Ellsworth et al., 2017). Besides the impact of LAI on the global carbon cycle, the increasing trend of LAI exerts profound biophysical impacts on climate by altering the energy and water cycles on the Earth’s surface (Forzieri et al., 2017; Zeng et al., 2017). But there is a great uncertainty in the relationships between LAI and biophysical processes among land-surface models (Forzieri et al., 2018). In this study, modeled nutrient-unlimitedβGPPandβNPP values are higher than leaf photosynthetic responses for all
C3 PFTs in C-only simulation (Fig. 3a). Nutrient-limited βNPPare still higher than photosynthetic responses for many PFTs in C–N and C–N–P simulations (Fig. 3b, c). However, it is generally observed in experiments that the leaf-level re-sponse is consistently larger than the whole plant rere-sponse (Long et al., 2006; Leuzinger et al., 2011). One possible rea-son is that models overestimate the response of LAI toeCO2, as this study has shown that LAI is an important factor in driving ecosystem response to CO2 fertilization. And it is also likely the overestimation of the response of LAI toeCO2 is responsible for the overestimation of CO2fertilization in ESMs reported by previous studies (Smith et al., 2015; Mys-takidis et al., 2017).
Q. Li et al.: Leaf area index identified as a major source 6919
Figure 6.Temporal trends ofβGPPsun (sensitivity of sunlit leaf GPP; red squares),βGPPsha (sensitivity of shaded leaf GPP; green squares), βSsun (sensitivity of scaling fatcor for sunlit leaf; pink triangles),βSsha (sensitivity of scaling fatcor for shaded leaf; dark blue triangles), βpsun (photosynthetic response for sunlit leaf; purple diamonds) andβpsha (photosynthetic response for shaded leaf; sky blue diamonds) for C3PFTs from CABLE-C-only simulation. The sensitivities of GPPsunand GPPsha tend to approach zero through time because the decomposing factorsβpsun,βpsha,βSsunandβSshaall decline with time.βSshadetermines the magnitudes and trends ofβGPPshafor almost all PFTs. Abbreviations are the same as Fig. 1.
carbon is allocated to woods or roots at higher CO2 concen-tration (De Kauwe et al., 2014). Unfortunately, CABLE has fixed allocation coefficients and likely overestimates LAI re-sponse, leading to overestimated responses of GPP, NPP and total carbon storage. Third, we fixed SLA to calculate LAI in CABLE. But a reduction in SLA is a commonly observed response ineCO2experiments (Luo et al., 1994; Ainsworth and Long, 2005; De Kauwe et al., 2014). Tachiiri et al. (2012) also found SLA andβvalues are most effectively constrained by observed LAI to smaller values in a model. Therefore, the fixed SLA may also lead to over-prediction of the response of canopy cover toeCO2. Fourth, in our results, LAI values for most C3PFTs are below the maximum LAI limits with eCO2 in C-only simulation. With only one exception, LAI values of many evergreen broadleaf forest patches saturate at the prescribed maximum value under high CO2 concen-tration (Fig. S1a and Table S1). That is why the sensitivity of LAI for evergreen broadleaf forest is low and thus leads to small relative GPP enhancements. If the preset LAI upper limits are narrowed,βvalues are expected to be significantly reduced. Hence model parameters related to LAI need to be better calibrated according to experiments and observations in order to better represent the response of ecosystem pro-ductivity toeCO2(De Kauwe et al., 2014; Qu and Zhuang, 2018).
The reduced magnitudes ofβcpoolcompared with those of βGPP and βNPP in all simulations indicate carbon turnover processes make ecosystems respond toeCO2less sensitively due to the slow allocation and carbon turnover processes. A previous study using seven global vegetation models iden-tified carbon residence time as the dominant cause of uncer-tainty in terrestrial vegetation responses to future climate and atmospheric CO2change (Friend et al., 2014). The response of soil carbon storage toeCO2 also depends on soil carbon residence time (Harrison et al., 1993). In this study and many other models, allocation coefficients were fixed over time (Walker et al., 2014). But allocation patterns to plant organs with different lifespans have been reported to change in re-sponse toeCO2in experiments, thereby altering carbon resi-dence time in plants and soil (De Kauwe et al., 2014). There-fore, the fixed allocation scheme we adopted in this study might lead to some biases in simulating the response of car-bon residence time toeCO2. In our study, soil decomposition rate is assumed not to be affected by CO2level, as in most other conventional soil carbon models (Friedlingstein et al., 2006; Luo et al., 2016). However, recent synthesis of experi-mental data suggested that replenishment of new carbon into soil due toeCO2increases turnover rate of soil carbon (Van Groenigen et al., 2014; Van Groenigen et al., 2017). Within a certain PFT, the variation ofβcpoolacross different geograph-ical locations is usually smaller than that ofβNPP, while the greater variation ofβcpool than that ofβNPPacross different C3PFTs in C-only simulation suggests other processes such as different carbon allocation patterns, plant carbon turnover, and the soil carbon dynamics of various PFTs are responsi-ble for the additional divergence. In nutrient-coupled simu-lations, the variations ofβcpool across different C3PFTs are only slightly larger than those ofβNPP, indicating that nutri-ents do not bring many differential effects on carbon turnover processes for different PFTs.
4.3 Implication for understandingβin other models
Although we analyzed a single land-surface model in detail, the patterns of and mechanisms underlying the variability of β we found may be generally applicable to other mod-els. The basic Farquhar photosynthesis model and two-leaf scaling scheme in the CABLE model are shared by many land-surface models. Some models use variants of the Far-quhar photosynthesis model such as the co-limitation ap-proach described by Collatz et al. (1991). Inflection point from Rubisco- to RuBP-limited processes is an important control of the absolute photosynthetic response to eCO2 (Rogers et al., 2016). However, the relative photosynthetic responses for different ecosystems will converge to a small range because the normalized photosynthetic response to eCO2 only depends on estimates of intercellular CO2 con-centration (Ci), Michaelis–Menten constants (Kc,Ko) and CO2 compensation point (0∗), and the relative
photosyn-thetic responses are similar for either Rubisco- or
RuBP-limited photosynthesis (Luo et al., 1996; Luo and Mooney, 1996). Soil moisture availability is another key constraint on photosynthetic response. Water stress on plants is generally alleviated undereCO2due to reduced stomatal conductance (Leuzinger and Körner, 2007; Fatichi et al., 2016). Different models simulate diverse levels of water stress on productivity (De Kauwe et al., 2017). Water stress is simulated in many models to regulate stomatal conductance (Rogers et al., 2016; Wu et al., 2018). For example, the CABLE model represents water stress by an empirical relationship based on soil tex-ture and limits the slope of the coupled relationship between photosynthesis rate and stomatal conductance as Eq. (S11). The influence of water stress is reflected byCi. Synthesis of many empirical study results and our results in this study all show that the ratio of Ci to Ca is relatively constant, probably due to homeostatic regulations through photosyn-thetic rate and stomatal conductance (Pearcy and Ehleringer, 1984; Evans and Farquhar, 1991). Wong et al. (1979) showed plant stomata could maintain a constantCi/Caratio across a wide range of environmental conditions, including the water stress condition. Land-surface models might simulate rela-tively constantCi/Caratios under water stress as well since photosynthesis and stomatal conductance are theoretically depicted based on experimental results. Moreover, Luo and Mooney (1996) found that changing theCi/Caratio from 0.6 to 0.8 caused a variation of less than 0.08 in the sensitivity of leaf photosynthesis to a unit of increase inCa.KcandKoare variable among species, but only slightly affect leaf-level re-sponse (Luo and Mooney, 1996). Different leaf temperature will exert a limited influence on the variability of leaf-level β, as we discussed above. Therefore, leaf-levelβ values for different C3PFTs are more likely to converge in other land-surface models.
Q. Li et al.: Leaf area index identified as a major source 6921
5 Conclusions
Exploring the variability of β at different hierarchical lev-els within and across different C3PFTs helps unravel model mechanisms that govern terrestrial ecosystem responses to elevated CO2. Our study shows that the sensitivities of bio-chemistry and leaf-level photosynthesis to eCO2 are very similar within and across C3PFTs in C-only, C–N and C–N– P simulations of CABLE, in accordance with previous theo-retical analysis, whileβ values of GPP, NPP and ecosystem carbon storage diverge primarily because the sensitivities of LAI significantly differ within and across different PFTs in all simulations. After decomposingβinto photosynthetic and LAI components, we find LAI contributes more than photo-synthesis to the magnitudes and trends of model responses. Our results indicate that processes related to LAI need to be better constrained with results from experiments and obser-vations in order to better represent the responses of ecosys-tem carbon cycle processes to changes in CO2and climate.
Data availability. The CABLE code is available online https://trac. nci.org.au/trac/cable (Kowalczyk et al., 2006; Wang et al., 2010, 2011). The MATLAB codes for processing model outputs can be accessed by sending an e-mail to [email protected].
Supplement. The supplement related to this article is available online at: https://doi.org/10.5194/bg-15-6909-2018-supplement.
Author contributions. QL and YL designed the study. QL and XL conducted the model simulations. XL, YL, YW and XH helped to solve the problems of coding. QL, XL, YL and PMC analyzed the results together. All the co-authors were involved in writing the pa-per and contributed to the review process.
Competing interests. The authors declare that they have no conflict of interest.
Acknowledgements. We acknowledge the CSIRO supercomputing facility (pearcey) for running the CABLE model. We thank Tsinghua University for providing the Scholarship for Overseas Graduate Studies. This paper is financially supported by the National Key R&D Program of China (2017YFA0604604).
Edited by: Christopher A. Williams
Reviewed by: Martin De Kauwe and one anonymous referee
References
Aerts, R. and Chapin, F. S.: The mineral nutrition of wild plants revisited: A re-evaluation of processes and patterns, Adv. Ecol. Res., 30, 1–67, 2000.
Ainsworth, E. A. and Long, S. P.: What have we learned from 15 years of free-air CO2enrichment (FACE)? A metaanalytic re-view of the responses of photosynthesis, canopy properties and plant production to rising CO2: Tansley review, New Phytol., 165, 351–372, 2004.
Anav, A., Friedlingstein, P., Kidston, M., Bopp, L., Ciais, P., Cox, P. M., Jones, C. D., Jung, M., Myneni, R. B., and Zhu, Z.: Evaluat-ing the land and ocean components of the global carbon cycle in the CMIP5 earth system models, J. Clim., 26, 6801–6843, 2013. Arora, V. K., Boer, G. J., Friedlingstein, P., Eby, M., Jones, C. D., Christian, J. R., Bonan, G., Bopp, L., Brovkin, V., Cad-ule, P., Hajima, T., Ilyina, T., Lindsay, K., Tjiputra, J. F., and Wu, T.: Carbon–Concentration and Carbon–Climate Feedbacks in CMIP5 Earth System Models, J. Clim., 26, 5289–5314, 2013. Averill, C. and Waring, B.: Nitrogen limitation of decomposition and decay: How can it occur?, Glob. Change Biol., 24, 1417– 1427, 2018.
Bacastow, R. and Keeling, C. D.: Atmospheric carbon dioxide and radiocarbon in the natural carbon cycle: II. Changes from A. D. 1700 to 2070 as deduced from a geochemical model, in: Carbon and the Biosphere, edited by: Woodwell, G. M. and Pecan, E. V., CONF-720510, 10 National Technical Information Service, Springfield, Va, 86–135, 1973.
Best, M. J., Pryor, M., Clark, D. B., Rooney, G. G., Essery, R. L. H., Ménard, C. B., Edwards, J. M., Hendry, M. A., Porson, A., Gedney, N., Mercado, L. M., Sitch, S., Blyth, E., Boucher, O., Cox, P. M., Grimmond, C. S. B., and Harding, R. J.: The Joint UK Land Environment Simulator (JULES), model description Part 1: Energy and water fluxes, Geosci. Model Dev., 4, 677– 699, https://doi.org/10.5194/gmd-4-677-2011, 2011.
Bonan, G. B. and Levis, S.: Quantifying carbon-nitrogen feedbacks In the Community Land Model (CLM4), Geophys. Res. Lett., 37, L07401, https://doi.org/10.1029/2010GL042430, 2010. Canadell, J. G., Pataki, D., Gifford, R., Houghton, R. A., Lou, Y.,
Raupach, M. R., Smith, P., and Steffen, W.: Saturation of the ter-restrial carbon sink, in: Ecosystems in a Changing World, edited by: Canadell, J. G., Pataki, D., and Pitelka, L., The IGBP Series, Springer-Verlag, Berlin Heidelberg, 59–78, 2007a.
Clark, D. B., Mercado, L. M., Sitch, S., Jones, C. D., Gedney, N., Best, M. J., Pryor, M., Rooney, G. G., Essery, R. L. H., Blyth, E., Boucher, O., Harding, R. J., Huntingford, C., and Cox, P. M.: The Joint UK Land Environment Simulator (JULES), model description – Part 2: Carbon fluxes and vegetation dynamics, Geosci. Model Dev., 4, 701–722, https://doi.org/10.5194/gmd-4-701-2011, 2011.
Collatz, G. J., Ball, J. T., Grivet, C., and Berry, J. A.: Physiologi-cal and environmental regulation of stomatal conductance, pho-tosynthesis and transpiration: a model that includes a laminar boundary layer, Agr. Forest Meteorol., 54, 107–136, 1991. Collatz, G., Ribas-Carbo, M., and Berry, J.: Coupled
Photosynthesis-Stomatal Conductance Model for Leaves of C4Plants, Aust. J. Plant Physiol., 19, 519–538, 1992.
Coskun, D., Britto, D. T., and Kronzucker, H. J.: Nutrient con-straints on terrestrial carbon fixation: The role of nitrogen, J. Plant Physiol., 203, 95–109, 2016.
Cox, P. M., Betts, R. A., Jones, C. D., Spall, S. A., and Totterdell, I. J.: Acceleration of global warming due to carbon-cycle feed-backs in a coupled climate model, Nature, 408, 184–187, 2000. Dai, Y., Dickinson, R. E., and Wang, Y. P.: A two-big-leaf model
for canopy temperature, photosynthesis, and stomatal conduc-tance, J. Clim., 17, 2281–2299, 2004.
De Kauwe, M. G., Medlyn, B. E., Zaehle, S., Walker, A. P., Di-etze, M. C., Wang, Y. P., Luo, Y. Q., Jain, A. K., El-Masri, B., Hickler, T., Warlind, D., Weng, E. S., Parton, W. J., Thornton, P. E., Wang, S. S., Prentice, I. C., Asao, S., Smith, B., McCarthy, H. R., Iversen, C. M., Hanson, P. J., Warren, J. M., Oren, R., and Norby, R. J.: Where does the carbon go? A model–data intercom-parison of vegetation carbon allocation and turnover processes at two temperate forest free-air CO2enrichment sites, New Phytol., 203, 883–899, 2014.
De Kauwe, M. G., Keenan, T. F., Medlyn, B. E., Prentice, I. C., and Terrer, C.: Satellite based estimates underestimate the effect of CO2fertilization on net primary productivity, Nat. Clim. Change, 6, 892–893, 2016.
De Kauwe, M. G., Medlyn, B. E., Walker, A. P., Zaehle, S., Asao, S., Guenet, B., Harper, A. B., Hickler, T., Jain, A. K., Luo, Y., Lu, X., Luus, K., Parton, W. J., Shu, S., Wang, Y., Werner, C., Xia, J., Pendall, E., Morgan, J. A., Ryan, E. M., Carrillo, Y., Di-jkstra, F. A., Zelikova, T. J., and Norby, R. J.: Challenging terres-trial biosphere models with data from the long-term multifactor Prairie Heating and CO2Enrichment experiment, Glob. Change Biol., 23, 3623–3645, 2017.
DeLucia, E. H., Moore, D. J., and Norby, R. J.: Contrasting re-sponses of forest ecosystems to rising atmospheric CO2: impli-cations for the global C cycle, Global Biogeochem. Cy., 19, 1–9, 2005.
DeLucia, E. H., Drake, J. E., Thomas, R. B., and Gonzalez-Meler, M.: Forest carbon use efficiency: is respiration a constant frac-tion of gross primary producfrac-tion?, Glob. Change Biol., 13, 1157– 1167, 2007.
Drake, B. G., Gonzàlez-Meler, M. A., and Long, S. P.: More effi-cient plants: a consequence of rising atmospheric CO2?, Annu. Rev. Plant. Biol., 48, 609–639, 1997.
Duursma, R. A., Gimeno, T. E., Boer, M. M., Crous, K. Y., Tjoelker, M. G., and Ellsworth, D. S.: Canopy leaf area of a mature ev-ergreen Eucalyptus woodland does not respond to elevated at-mospheric [CO2] but tracks water availability, Glob. Change Biol., 22, 1666–1676, 2016.
Ellsworth, D. S., Anderson, I. C., Crous, K. Y., Cooke, J., Drake, J. E., Gher-lenda, A. N., and Tjoelker, M. G.: Elevated CO2does not increase eucalypt forest productivity on a low-phosphorus soil, Nat. Clim. Change, 7, 279–282, 2017.
Etheridge, D. M., Steele, L. P., Langenfelds, R. L., Francey, R. J., Barnola, J. M., and Morgan, V. I.: Natural and anthropogenic changes in atmospheric CO2over the last 1000 years from air in Antarctic ice and firn, J. Geophys. Res.-Atmos., 101, 4115– 4128, 1996.
Evans, J. R. and Farquhar, G. D.: Modeling canopy photosynthesis from the biochemistry of the C3chloroplast, in: Modeling Crop Photosynthesis-from Biochemistry to Canopy, edited by: Boote, K. J. and Loomis, R. S., Madison, WI, Crop Science Soc. Am., 19, 1–15, 1991.
Ewert, F.: Modelling plant responses to elevated CO2: how impor-tant is leaf area index?, Ann. Bot., 93, 619–627, 2004.
Farquhar, G. D., von Caemmerer, S., and Berry, J. A.: A biochem-ical model of photosynthetic CO2assimilation in leaves of C3 species, Planta, 149, 78–90, 1980.
Fatichi, S., Leuzinger, S., Paschalis, A., Langley, J. A., Donnellan Barraclough, A., and Hovenden, M. J.: Partitioning direct and indirect effects reveals the response of water-limited ecosystems to elevated CO2, P. Natl. Acad. Sci. USA, 113, 12757–12762, 2016.
Forzieri, G., Alkama, R., Miralles, D. G., and Cescatti, A.: Satel-lites reveal contrasting responses of regional climate to the widespread greening of Earth, Science, 356, 1180–1184, 2017. Forzieri, G., Duveiller, G., Georgievski, G., Li, W., Robertson, E.,
Kautz, M., Lawrence, P., Garcia San Martin, L., Anthoni, P., Ciais, P., Pongratz, J., Sitch, S., Wiltshire, A., Arneth, A., and Cescatti, A.: Evaluating the interplay between biophysical pro-cesses and leaf area changes in Land Surface Models, J. Adv. Model. Earth Syst., 10, 1102–1126, 2018.
Friedlingstein, P.: Carbon cycle feedbacks and future cli-mate change, Philos. T. R. Soc. A, 373, 20140421, https://doi.org/10.1098/rsta.2014.0421, 2015.
Friedlingstein, P., Cox, P., Betts, R., Bopp, L., von Bloh, W., Brovkin, V., Cadule, P., Doney, S., Eby, M., Fung, I., Bala, G., John, J., Jones, C., Joos, F., Kato, T., Kawamiya, M., Knorr, W. Lindsay, K., Matthews, H. D., Raddatz, T., Rayner, P., Reick, C., Roeckner, E., Schnitzler, K. G., Schnur, R., Strassmann, K., Weaver, A. J., Yoshikawa, C., and Zeng, N.: Climate-carbon cy-cle feedback analysis: Results from the C4MIP model intercom-parison, J. Clim., 19, 3337–3353, 2006.
Friend, A. D., Lucht, W., Rademacher, T. T., Keribin, R., Betts, R., Cadule, P., Ciais, P., Clark, D. B., Dankers, R., Falloon, P. D., Ito, A., Kahana, R., Kleidon, A., Lomas, M. R., Nishina, K., Ostberg, S., Pavlick, R., Peylin, P., Schaphoff, S., Vuichard, N., Warsza-wski, L., Wiltshire, A., and Woodward, F. I.: Carbon residence time dominates uncertainty in terrestrial vegetation responses to future climate and atmospheric CO2, P. Natl. Acad. Sci. USA, 111, 3280–3285, 2014.
Fung, I. Y., Doney, S. C., Lindsay, K., and John, J.: Evolution of carbon sinks in a changing climate, P. Natl. Acad. Sci. USA, 102, 11201–11206, 2005.
Gielen, B., Calfapietra, C., Lukac, M., Wittig, V. E., De Angelis, P., Janssens, I. A., Moscatelli, M. C., Grego, S., Cotrufo, M. F., Godbold, D. L., Hoosbeek, M. R., Long, S. P., Miglietta, F., Polle, A., Bernacchi, C. J., Davey, P. A., Ceulemans, R., and Scarascia-Mugnozza, G. E.: Net carbon storage in a poplar plan-tation (POPFACE) after three years of free-air CO2enrichment, Tree Physiol., 25, 1399–1408, 2005.
Gregory, J. M., Jones, C. D., Cadule, P., and Friedlingstein, P.: Quantifying carbon cycle feedbacks, J. Clim., 22, 5232–5250, 2009.
Hajima, T., Tachiiri, K., Ito, A., and Kawamiya, M.: Uncertainty of Concentration–Terrestrial Carbon Feedback in Earth System Models∗, J. Clim., 27, 3425–3445, 2014.
Hamilton, J. G., DeLucia, E. H., George, K., Naidu, S. L., Finzi, A. C., and Schlesinger, W. H.: Forest carbon balance under elevated CO2, Oecologia, 131, 250–260, 2002.
Q. Li et al.: Leaf area index identified as a major source 6923
Reich, P. B., Soudzilovskaia, N. A., and Bodegom, P. V.: Im-proved representation of plant functional types and physiology in the Joint UK Land Environment Simulator (JULES v4.2) us-ing plant trait information, Geosci. Model Dev., 9, 2415–2440, https://doi.org/10.5194/gmd-9-2415-2016, 2016.
Harrison, K., Broecker, W., and Bonani, G.: A strategy for estimat-ing the impact of CO2fertilization on soil C storage, Global Bio-geochem. Cy., 7, 69–80, 1993.
Hasegawa, T., Li, T., Yin, X., Zhu, Y., Boote, K., Baker, J., Bre-gaglio, S., Buis, S., Confalonieri, R., and Fugice, J.: Causes of variation among rice models in yield response to CO2 exam-ined with Free-Air CO2Enrichment and growth chamber exper-iments, Sci. Rep.-UK, 7, 14858, https://doi.org/10.1038/s41598-017-13582-y, 2017.
Heimann, M. and Reichstein, M.: Terrestrial ecosystem carbon dy-namics and climate feedbacks, Nature, 451, 289–292, 2008. Hu, S., Chapin III, F. S., Firestone, M. K., Field, C. B., and
Chiariello, N. R.: Nitrogen limitation of microbial decomposi-tion in a grassland under elevated CO2, Nature, 409, 188–191, 2001.
Hunt, H. W., Ingham, E. R., Coleman, D. C., Elliott, E. T., and Reid, C. P. P.: Nitrogen limitation of production and decomposition in prairie, mountain meadow, and pine forest, Ecology, 69, 1009– 1016, 1988.
Huntzinger, D. N., Michalak, A. M., Schwalm, C., Ciais, P., King, A. W., Fang, Y., Schaefer, K., Wei, Y., Cook, R. B., Fisher, J. B., Hayes, D., Huang, M., Ito, A., Jain, A. K., Lei, H., Lu, C., Maig-nan, F., Mao, J., Parazoo, N., Peng, S., Poulter, B., Ricciuto, D., Shi, X., Tian, H., Wang, W., Zeng, N., and Zhao, F.: Uncertainty in the response of terrestrial carbon sink to environmental drivers undermines carbon-climate feedback predictions, Sci. Rep.-UK, 7, 4765, https://doi.org/10.1038/s41598-017-03818-2, 2017. Hurrell, J. W., Holland, M., Gent, P., Ghan, S., Kay, J. E., Kushner,
P., Lamarque, J.-F., Large, W., Lawrence, D., Lindsay, K., Lip-scomb, W. H., Long, M. C., Mahowald, N., Marsh, D. R., Neale, R. B., Rasch, P., Vavrus, S., Vertenstein, M., Bader, D., Collins, W. D., Hack, J. J., Kiehl, J., and Marshall, S.: The community earth system model: a framework for collaborative research, B. Am. Meteorol. Soc., 94, 1339–1360, 2013.
Iversen, C. M., Keller, J. K., Garten, C. T., and Norby, R. J.: Soil carbon and nitrogen cycling and storage throughout the soil pro-file in a sweetgum plantation after 11 years of CO2-enrichment, Glob. Change Biol., 18, 1684–1697, 2012.
Jiang, C., Ryu, Y., Fang, H., Myneni, R., Claverie, M., and Zhu, Z.: Inconsistencies of interannual variability and trends in long-term satellite leaf area index products, Glob. Change Biol., 23, 4133–4146, 2017.
Joos, F., Prentice, I. C., Sitch, S., Meyer, R., Hooss, G., Plattner, G.-K., Gerber, S., and Hasselmann, K.: Global warming feedbacks on terrestrial carbon uptake under the IPCC emission scenarios, Global Biogeochem. Cy., 15, 891–907, 2001.
Kattge, J., Knorr, W., Raddatz, T., and Wirth, C.: Quantifying photo-synthetic capacity and its relationship to leaf nitrogen content for global-scale terrestrial biosphere models, Glob. Change Biol., 15, 976–991, 2009.
Kowalczyk, E., Wang, Y., Law, R., Davies, H., McGregor, J., and Abramowitz, G.: The CSIRO Atmosphere Biosphere Land Ex-change (CABLE) model for use in climate models and as an
of-fline model, CSIRO Marine and Atmospheric Research Paper, 13, 1–37, 2006.
Lamarque, J.-F., Bond, T. C., Eyring, V., Granier, C., Heil, A., Klimont, Z., Lee, D., Liousse, C., Mieville, A., Owen, B., Schultz, M. G., Shindell, D., Smith, S. J., Stehfest, E., Van Aardenne, J., Cooper, O. R., Kainuma, M., Mahowald, N., McConnell, J. R., Naik, V., Riahi, K., and van Vuuren, D. P.: Historical (1850–2000) gridded anthropogenic and biomass burning emissions of reactive gases and aerosols: methodol-ogy and application, Atmos. Chem. Phys., 10, 7017–7039, https://doi.org/10.5194/acp-10-7017-2010, 2010.
Lamarque, J. F., Kyle, G. P., Meinshausen, M., Riahi, K., Smith, S. J., van Vuuren, D. P., Conley, A. J., and Vitt, F.: Global and regional evolution of short-lived radiatively-active gases and aerosols in the Representative Concentration Pathways, Climate Change, 109, 191–212, 2011.
Le Quéré, C., Andrew, R. M., Friedlingstein, P., Sitch, S., Pongratz, J., Manning, A. C., Korsbakken, J. I., Peters, G. P., Canadell, J. G., Jackson, R. B., Boden, T. A., Tans, P. P., Andrews, O. D., Arora, V. K., Bakker, D. C. E., Barbero, L., Becker, M., Betts, R. A., Bopp, L., Chevallier, F., Chini, L. P., Ciais, P., Cosca, C. E., Cross, J., Currie, K., Gasser, T., Harris, I., Hauck, J., Haverd, V., Houghton, R. A., Hunt, C. W., Hurtt, G., Ily-ina, T., Jain, A. K., Kato, E., Kautz, M., Keeling, R. F., Klein Goldewijk, K., Körtzinger, A., Landschützer, P., Lefèvre, N., Lenton, A., Lienert, S., Lima, I., Lombardozzi, D., Metzl, N., Millero, F., Monteiro, P. M. S., Munro, D. R., Nabel, J. E. M. S., Nakaoka, S.-I., Nojiri, Y., Padin, X. A., Peregon, A., Pfeil, B., Pierrot, D., Poulter, B., Rehder, G., Reimer, J., Rödenbeck, C., Schwinger, J., Séférian, R., Skjelvan, I., Stocker, B. D., Tian, H., Tilbrook, B., Tubiello, F. N., van der Laan-Luijkx, I. T., van der Werf, G. R., van Heuven, S., Viovy, N., Vuichard, N., Walker, A. P., Watson, A. J., Wiltshire, A. J., Zaehle, S., and Zhu, D.: Global Carbon Budget 2017, Earth Syst. Sci. Data, 10, 405–448, https://doi.org/10.5194/essd-10-405-2018, 2018.
Leuning, R.: Modelling stomatal behaviour and photosynthesis of Eucalyptus grandis, Funct. Plant Biol., 17, 159–175, 1990. Leuzinger, S. and Körner, C.: Water savings in mature deciduous
forest trees under elevated CO2, Glob. Change Biol., 13, 2498– 2508, 2007.
Leuzinger, S., Luo, Y., Beier, C., Dieleman, W., Vicca, S., and Ko-erner, C.: Do global change experiments overestimate impacts on terrestrial ecosystems?, Trends Ecol. Evolut., 26, 236–241, 2011. Long, S. P., Ainsworth, E. A., Rogers, A., and Ort, D. R.: Rising at-mospheric carbon dioxide: plants FACE the Future*, Annu. Rev. Plant Biol., 55, 591–628, 2004.
Long, S. P., Ainsworth, E. A., Leakey, A. D., Nösberger, J., and Ort, D. R.: Food for thought: lower-than-expected crop yield stimu-lation with rising CO2concentrations, Science, 312, 1918–1921, 2006.
Luo, Y. and Mooney, H. A.: Stimulation of global photosynthetic carbon influx by an increase in atmospheric carbon dioxide con-centration, in: Carbon Dioxide and Terrestrial Ecosystems, edited by: Koch, G. W. and Mooney, H. A., Academic Press, San Diego, 381–397, 1996.
Luo, Y., Sims, D. A., Thomas, R. B., Tissue, D. T., and Ball, J. T.: Sensitivity of leaf photosynthesis to CO2concentration is an invariant function for C3plants: A test with experimental data and global applications, Global Biogeochem. Cy., 10, 209–222, 1996.
Luo, Y., Su, B., Currie, W. S., Dukes, J. S., Finzi, A. C., Hartwig, U., Hungate, B., McMurtrie, R. E., Oren, R., Parton, W. J., Pataki, D. E., Shaw, M. R., Zak, D. R., and Field, C. B.: Progressive nitrogen limitation of ecosystem responses to rising atmospheric carbon dioxide, Bioscience, 54, 731–739, 2004.
Luo, Y., Ahlström, A., Allison, S. D., Batjes, N. H., Brovkin, V., Carvalhais, N., Chappell, A., Ciais, P., Davidson, E. A., Finzi, A., Georgiou, K., Guenet, B., Hararuk, O., Harden, J. W., He, Y., Hopkins, F., Jiang, L., Koven, C., Jackson, R. B., Jones, C. D., Lara, M. J., Liang, J., McGuire, A. D., Parton, W., Peng, C., Randerson, J. T., Salazar, A., Sierra, C. A., Smith, M. J., Tian, H., ToddBrown, K. E. O., Torn, M., van Groenigen, K. J., Wang, Y. P., West, T. O., Wei, Y., Wieder, W. R., Xia, J., Xu, X., Xu, X., and Zhou, T.: Toward more realistic projections of soil carbon dynamics by Earth system models, Global Biogeochem. Cy., 30, 40–56, 2016.
MacFarling Meure, C., Etheridge, D., Trudinger, C., Steele, P., Langenfelds, R., van Ommen, T., Smith, A., and Elkins, J.: Law Dome CO2, CH4 and N2O ice core records ex-tended to 2000 years BP, Geophys. Res. Lett., 33, L14810, https://doi.org/10.1029/2006GL0, 2006.
Mahowald, N., Jickells, T. D., Baker, A. R., Artaxo, P., Benitez-Nelson, C. R., Bergametti, G., Bond, T. C., Chen, Y., Co-hen, D. D., Herut, B., Kubilay, N., Losno, R., Luo, C., Maenhaut, W., McGee, K. A., Okin, G. S., Siefert, R. L., and Tsukuda, S.: Global distribution of atmospheric phos-phorus sources, concentrations and deposition rates, and an-thropogenic impacts, Global Biogeochem. Cy., 22, GB4026, https://doi.org/10.1029/2008GB003240, 2008.
Mystakidis, S., Seneviratne, S. I., Gruber, N., and Davin, E. L.: Hydrological and biogeochemical constraints on terres-trial carbon cycle feedbacks, Environ. Res. Lett., 12, 014009, https://doi.org/10.1088/1748-9326/12/1/014009, 2017.
Neff, J. C., Townsend, A. R., Gleixner, G., Lehman, S. J., Turnbull, J., and Bowman, W. D.: Variable effects of nitrogen additions on the stability and turnover of soil carbon, Nature, 419, 915–917, 2002.
Norby, R. J., Sholtis, J. D., Gunderson, C. A., and Jawdy, S. S.: Leaf dynamics of a deciduous forest canopy: no response to elevated CO2, Oecologia, 136, 574–584, 2003.
Norby, R. J., DeLucia, E. H., Gielen, B., Calfapietra, C., Giardina, C. P., King, J. S., Ledford, J., McCarthy, H. R., Moore, D. J. P., Ceulemans, R., De Angelis, P., Finzi, A. C., Karnosky, D. F., Ku-biske, M. E., Lukac, M., Pregitzer, K. S., ScarasciaMugnozza, G. E., Schlesinger, W. H., and Oren, R.: Forest response to elevated CO2is conserved across a broad range of productivity, P. Natl. Acad. Sci. USA, 102, 18052–18056, 2005.
Oleson, K., Lawrence, D. M., Bonan, G. B., Drewniak, B., Huang, M., Koven, C. D., Levis, S., Li, F., Riley, W. J., Subin, Z. M., Swenson, S. C., Thornton, P. E., Bozbiyik, A., Fisher, R., Heald, C. L., Kluzek, E., Lamarque, J.-F., Lawrence, P. J., Leung, L. R., Lipscomb, W., Muszala, S., Ricciuto, D. M., Sacks, W., Sun, Y., Tang, J., and Yang, Z.-L.: Technical Description of version 4.5
of the Community Land Model (CLM), NCAR Technical Note NCAR/TN-503+STR, Boulder, Colorado, 420 pp., 2013. Pearcy, R. W. and Ehleringer, J.: Comparative ecophysiology of C3
and C4plants, Plant Cell Environ., 7, 1–13, 1984.
Peng, J., Dan, L., and Huang, M.: Sensitivity of global and regional terrestrial carbon storage to the direct CO2effect and climate change based on the CMIP5 model intercomparison, PloS one, 9, e95282, https://doi.org/10.1371/journal.pone.0095282, 2014. Polglase, P. J. and Wang, Y. P.: Potential CO2-enhanced carbon
stor-age by the terrestrial biosphere, Aust. J. Bot., 40, 641–656, 1992. Qu, Y. and Zhuang, Q.: Modeling leaf area index in North America using a process-based terrestrial ecosystem model, Ecosphere, 9, https://doi.org/10.1002/ecs2.204, 2018.
Rogers, A., Medlyn, B. E., Dukes, J. S., Bonan, G., von Caemmerer, S., Dietze, M. C., Kattge, J., Leakey, A. D. B., Mercado, L. M., Niinemets, Ü., Prentice, I. C., Serbin, S. P., Sitch, S., Way, D. A., and Zaehle, S.: A roadmap for improving the representation of photosynthesis in earth system models, New Phytol., 213, 22– 42, 2016.
Schäfer, K. V. R., Oren, R., Ellsworth, D. S., Lai, C. T., Herrick, J. D., Finzi, A. C., Richter, D. D., and Katul, G. G.: Exposure to an enriched CO2atmosphere alters carbon assimilation and alloca-tion in a pine forest ecosystem, Glob. Chang Biol., 9, 1378–1400, 2003.
Smith, W. K., Reed, S. C., Cleveland, C. C., Ballantyne, A. P., An-deregg, W. R. L., Wieder, W. R., Liu, Y. Y., and Running, S. W.: Large divergence of satellite and Earth system model estimates of global terrestrial CO2fertilization, Nat. Clim. Change, 6, 306– 310, 2016.
Sokolov, A. P., Kicklighter, D. W., Melillo, J. M., Felzer, B. S., Schlosser, C. A., and Cronin, T. W.: Consequences of consid-ering carbon–nitrogen interactions on the feedbacks between cli-mate and the terrestrial carbon cycle, J. Clim., 21, 3776–3796, 2008.
Tachiiri, K., Ito, A., Hajima, T., Hargreaves, J. C., Annan, J. D., and Kawamiya, M.: Nonlinearity of land carbon sensitivities in climate change simulations, J. Meteor. Soc. Jpn., 90, 259–274, 2012.
Thornton, P. E., Lamarque, J. F., Rosenbloom, N. A., and Mahowald, N. M.: Influence of carbon-nitrogen cycle cou-pling on land model response to CO2 fertilization and climate variability, Global Biogeochem. Cy., 21, GB4018, https://doi.org/10.1029/2006GB002868, 2007.
Thornton, P. E., Doney, S. C., Lindsay, K., Moore, J. K., Ma-howald, N., Randerson, J. T., Fung, I., Lamarque, J. F., Fed-dema, J. J., and Lee, Y. H.: Carbon-nitrogen interactions regu-late climate-carbon cycle feedbacks: results from an atmosphere ocean general circulation model, Biogeosciences, 6, 2099–2120, https://doi.org/10.5194/bg-6-2099-2009, 2009.
Van Groenigen, K. J., Qi, X., Osenberg, C. W., Luo, Y., and Hun-gate, B. A.: Faster decomposition under increased atmospheric CO2limits soil C storage, Science, 344, 508–509, 2014. Van Groenigen, K. J., Osenberg, C. W., Terrer, C., Carrillo, Y.,
Q. Li et al.: Leaf area index identified as a major source 6925
Vitousek, P. M., Porder, S., Houlton, B. Z., and Chadwick, O. A.: Terrestrial phosphorus limitation: mechanisms, implications, and nitrogen–phosphorus interactions, Ecol. Appl., 20, 5–15, 2010. Walker, A. P., Hanson, P. J., De Kauwe, M. G., Medlyn, B. E.,
Zaehle, S., Asao, S., Dietze, M., Hickler, T., Huntingford, C., Iversen, C. M., Jain, A., Lomas, M., Luo, Y., McCarthy, H., Par-ton, W. J., Prentice, I. C., ThornPar-ton, P. E., Wang, S., Wang, Y.-P., Warlind, D., Weng, E., Warren, J. M., Woodward, F. I., Oren, R., and Norby, R. J.: Comprehensive ecosystem model-data synthe-sis using multiple data sets at two temperate forest free-air CO2 enrichment experiments: Model performance at ambient CO2 concentration, J. Geophys. Res.-Biogeo., 119, 937–964, 2014. Wang, Y. P. and Houlton, B. Z.: Nitrogen constraints on
terrestrial carbon uptake: Implications for the global carbon-climate feedback, Geophys. Res. Lett., 36, L24403, https://doi.org/10.1029/2009GL041009, 2009.
Wang, Y. P., Law, R. M., and Pak, B.: A global model of carbon, nitrogen and phosphorus cycles for the terrestrial biosphere, Bio-geosciences, 7, 2261–2282, https://doi.org/10.5194/bg-7-2261-2010, 2010.
Wang, Y. P., Kowalczyk, E., Leuning, R., Abramowitz, G., Rau-pach, M. R., Pak, B., van Gorsel, E., and Luhar, A.: Diagnos-ing errors in a land surface model (CABLE) in the time and frequency domains, J. Geophys. Res.-Biogeo., 116, G01034, https://doi.org/10.1029/2010JG001385, 2011.
Wang, Y. P., Lu, X. J., Wright, I. J., Dai, Y. J., Rayner, P. J., and Reich, P. B.: Correlations among leaf traits provide a significant constraint on the estimate of global gross primary production, Geophys. Res. Lett., 39, https://doi.org/10.1029/2012GL05346, 2012.
Wong, S. C., Cowan, I. R., and Farquhar, G. D.: Stomatal conduc-tance correlates with photosynthetic capacity, Nature, 282, 424– 426, 1979.
Wu, D., Ciais, P., Viovy, N., Knapp, A. K., Wilcox, K., Bahn, M., Smith, M. D., Vicca, S., Fatichi, S., Zscheischler, J., He, Y., Li, X., Ito, A., Arneth, A., Harper, A., Ukkola, A., Paschalis, A., Poulter, B., Peng, C., Ricciuto, D., Reinthaler, D., Chen, G., Tian, H., Genet, H., Mao, J., Ingrisch, J., Nabel, J. E. S. M., Pongratz, J., Boysen, L. R., Kautz, M., Schmitt, M., Meir, P., Zhu, Q., Hasibeder, R., Sippel, S., Dangal, S. R. S., Sitch, S., Shi, X., Wang, Y., Luo, Y., Liu, Y., and Piao, S.: Asymmetric re-sponses of primary productivity to altered precipitation simulated by ecosystem models across three long-term grassland sites, Biogeosciences, 15, 3421–3437, https://doi.org/10.5194/bg-15-3421-2018, 2018.
Zaehle, S., Friedlingstein, P., and Friend, A. D.: Terrestrial nitrogen feedbacks may accelerate future climate change, Geophys. Res. Lett., 37, L01401, https://doi.org/10.1029/2009GL041345, 2010. Zaehle, S., Medlyn, B. E., De Kauwe, M. G., Walker, A. P., Dietze, M. C., Hickler, T., Luo, Y., Wang, Y.-P., El-Masri, B., Thornton, P., Jain, A., Wang, S., Warlind, D., Weng, E., Parton, W., Iversen, C. M., Gallet-Budynek, A., McCarthy, H., Finzi, A., Hanson, P. J., Prentice, I. C., Oren, R., and Norby, R. J.: Evaluation of 11 ter-restrial carbon-nitrogen cycle models against observations from two temperate Free-Air CO2Enrichment studies, New Phytol., 202, 803–822, 2014.
Zeng, Z., Piao, S., Li, L. Z., Zhou, L., Ciais, P., Wang, T., Li, Y., Lian, X., Wood, E. F., and Friedlingstein, P.: Climate mitiga-tion from vegetamitiga-tion biophysical feedbacks during the past three decades, Nat. Clim. Change, 7, 432–436, 2017.
Zhang, Q., Wang, Y. P., Pitman, A. J., and Dai, Y. J.: Lim-itations of nitrogen and phosphorous on the terrestrial car-bon uptake in the 20th century, Geophys. Res. Lett., 38, https://doi.org/10.1029/2011GL049244, 2011.
Zhang, Q., Pitman, A. J., Wang, Y. P., Dai, Y. J., and Lawrence, P. J.: The impact of nitrogen and phosphorous limitation on the esti-mated terrestrial carbon balance and warming of land use change over the last 156 yr, Earth Syst. Dynam., 4, 333–345, 2013. Zhu, Z., Piao, S., Myneni, R. B., Huang, M., Zeng, Z., Canadell,