International Journal of Innovative Technology and Exploring Engineering (IJITEE) ISSN: 2278-3075,Volume-8 Issue-6, April 2019
Abstract: The penetration of renewable energy sources (RES) in the power system is increasing in the recent years. Integrating the energy storage systems (ESS) into the network can increase the reliability of the system and facilitate the penetration of renewable RES. Among different kinds of ESS, battery energy storage systems (BESS) are compact and faster. Optimal sizing and location of the BESS in network which is essential to decrease the overall cost of the system is done with Genetic Algorithm (GA). To account the stochastic nature of RES, a probabilistic approach is adopted and the optimal operation of BESS is determined using Forest Optimization Algorithm (FOA).
Index Terms: Battery energy storage systems (BESS), Forest Optimization Algorithm (FOA), Genetic Algorithm (GA), renewable energy sources (RES).
NOMENCLATURE
Set of buses for installation of BESS Script indicating charging
Script indicating discharging Index representing interruption
Index representing hour Network bus indices Index for reinforcement Index representing load state
Set of load states
Script indicating minimum values Script indicating maximum values Script indicating off-peak demand Script indicating peak demand
Index representing combined load-DG states
Set of combined load-DG states Year index when reinforcement k is necessary
Year index Energy losses’ cost
Revised Manuscript Received on April 07, 2019.
K Pranavi, Department of EEE, Koneru Lakshmaiah Education Foundation, Vaddeswaram, A.P, India.
P Linga Reddy, Department of EEE, Koneru Lakshmaiah Education Foundation, Vaddeswaram, A.P, India.
S V N L Lalitha, Department of EEE, Koneru Lakshmaiah Education Foundation, Vaddeswaram, A.P, India.
NPV of the DS replacement cost Rated capacity of the DS Energy stored by the DS NPV of arbitrage benefit NPV of interruption cost NPV of losses costs
NPV of system upgrade costs DS output power
Power losses in the network
DS rated charging/discharging power Replacement period of the DS
Reinforcement costs
Integer decision variable to control the power rating of the DS placed at bus i
Integer decision variable to control the energy rating of the DS placed at bus i
Price of the electricity
Capital cost of DS with respect to power Capital cost of DS with respect to energy
Operation and maintenance cost of DS Inflation rate
Future value of replacement cost Interest value
Effective interest rate
Total number of required upgrades Number of buses in the network
Number of years in the planning period Present value function
Duration of interruption in hours
I. INTRODUCTION
Gradual depletion of fossil fuels and environmental pollution are few of the problems faced by the conventional power system. These problems can be overcome by generating power locally using non-conventional/renewable energy sources (RES) like natural gas, wind energy, solar energy.
Optimal Sizing and Siting of BESS in
Distribution Networks
This type of power generation is termed as distributed generation (DG). Stochastic nature of wind and solar energies cause fluctuations in the output power. Energy storage systems (ESS) can balance the energy mismatch in the network. BESS can store surplus power and dispatch the stored energy when necessary. BESS can provide power to loads in an island formed by contingency thereby increasing the reliability of the system and preventing loss of load [1].
Optimal allocation of VRESS (Vanadium Redox Energy Storage System) considering extreme usage of wind and solar energy, total costs is done in [2] using dynamic programming. Dynamic programming consumes more memory and long running time. Better utilization of ESS & mitigating operational risk with battery operation strategy and minimization of cost of ESS, power losses, energy purchasing cost is done in [3] using Fuzzy Particle Swarm Optimization. PSO’s performance is dependent on the parameters like inertia weight and learning factors. In FPSO, fuzzy control method is used to vary the control parameters. In [4] optimal sizing of ESS in micro grid established on cost benefit analysis for grid connected and standalone modes is done using MILP (Mixed Linear Integer Problem). MILP cannot be implemented for nonlinear problems.
Optimal ESS allocation (size, location, number) is determined ensuring minimum cost, reducing losses, maintaining voltage profile in [5] using genetic algorithm (GA). In [6] optimal combination of DSs to be placed, the loads which should be shed at the time of contingencies for improving system reliability is determined using GA. Authors in [7] and [8] have implemented sizing of ESS for standalone micro-grids. In [9] an algorithm for allocation of ESS in distribution networks to defer system upgrades is presented. The authors in [10] presented a methodology for optimal sizing of ESS in micro-grids using matrix real coded genetic algorithm.
Several optimization techniques have been considered to solve the optimal sizing of ESS problem. GA has showed its supremacy in terms of accuracy and speed [11]. Probabilistic approach is adopted to account for intermittent behaviour of the system components. In this paper, the methodology is based on GA [11] and forest optimization algorithm (FOA) [12]. The main objective is to optimize the distributed storage (DS) units’ allocation considering the installation, operation and maintenance costs. The optimal operation of DS units is determined at every load state using FOA. Probabilistic load and DG models, electricity prices and cost parameters of BESS are the inputs to the methodology. The outputs are optimal sizing, siting of DS units and the optimal BESS operation at each load state.
The rest of the paper is divided into four sections. The problem description is in section Ⅱ. Section Ⅲ describes the methodology and mathematical formulation. Section Ⅳ includes sample case study. The results are shown in section Ⅴ and conclusions are in section Ⅵ.
II.PROBLEMDESCRIPTION
The main objective is to find the optimal size of the BESS and its placement in the distribution network with DG considering the capital, maintenance and replacement costs of battery, costs of losses in the network, network upgradation cost and the arbitrage benefit. The inputs provided are probabilistic load, probabilistic DG models, the cost parameters of the battery, prices of the electricity during peak and off-peak hours. The outputs obtained are the power ratings of BESS and the bus number where the BESS has to be placed.
III. METHODOLOGYFORTHESOLUTIONOF
THEPROBLEM
The main objective function is minimized using GA. Each chromosome denotes the size of the DS unit to be placed in the distribution network. For each population of GA, four steps are performed to estimate fitness function as shown in Fig.1 [11]. The methodology is adopted for a planning period to evaluate net present values (NPV) of system costs and profits. In the first step load modelling is done. The second step is to conduct power flow analysis at each state to obtain the system upgrades and the losses. In the third step N-1 contingency analysis is carried out so as to obtain the power to be supplied by the DS to meet the demand required for all possible islands formed. In the next step annual arbitrage benefit and interruption cost (ECOST) are determined.
International Journal of Innovative Technology and Exploring Engineering (IJITEE) ISSN: 2278-3075,Volume-8 Issue-6, April 2019
a. Load Modelling
[image:3.595.59.289.146.369.2]The load demand is expected to follow the hourly load shape of the IEEE-reliability test system (RTS) [13]. The load data is divided into ten states as shown in TABLE Ⅰ [14], where each state represent the magnitude of the load and its associated probability.
TABLE I
PROBABILISTIC LOAD MODEL [11] Load state Load magnitude Probability
1 0.351 0.033
2 0.406 0.0473
3 0.451 0.0912
4 0.51 0.163
5 0.585 0.163
6 0.65 0.1654
7 0.713 0.1654
8 0.774 0.1057
9 0.853 0.056
10 1 0.01
b.DG Modelling
Intermittent DGs are modelled using probability distribution functions (PDFs). The probability density functions can be acquired from the available data of the DGs. Rayleigh PDF is supposed to be suitable for modelling wind speeds. The continuous PDFs are divided into a number of states with their associated probabilities, thereby obtaining probabilistic model for the DG. The number of states should be chosen in such a way that the easiness and accuracy of the analysis are not compromised. High number of sates improves accuracy but the complexity increases but less number of states has the contrary consequence.
c.Optimize the charging/discharging operation of DS units
In this stage the optimal charging/discharging power at each load state is obtained. Depending upon the magnitude of load at each state, the states are classified either as charging state or discharging state. The first four states are considered as off-peak states and they form candidate states for charging, the remaining six states are regarded as candidate states for discharging. This sub problem is solved using FOA whose flowchart is shown in Fig. 2 [12]. The objective function is to maximize the arbitrage benefit (1).
(1)
From (1), it can be understood that the objective function depends on the prices of electricity and the load state probabilities. The objective function in (1) is to be maximized subjected to the constraints mentioned below. The first constraint shows that the energy stored in a particular duration should be equal to the energy that is discharged in the same duration. The amount of energy that is stored during a day is bounded by the ESS energy size, shown by (3). The third constraint implies that the power to be discharged at the highest peak load state (i.e., state 10) should be equal to the DS power size. Subjected to the constraints: (2)
(3)
(4)
(5)
Fig. 2. Flowchart for forest optimization algorithm[12]
d.Estimate the losses’ costs
The combined load-DG model is obtained by convolution of load probabilistic model and probabilistic DG model, supposing that the models are independent as in [15] and [14]. Hence, the number of states is same as the product of the number of states of each individual model. Load flow analysis is done to evaluate the costs of system upgrade and the losses in the network. System upgrade includes the lines’ reinforcement and reinforcement of the substation so that the growth in the load is
[image:3.595.309.540.175.607.2]For radial distribution networks, upgrades are determined at the circumstance of extreme power flow in the lines. The method for determining system upgrade and losses costs is elucidated below:
1- Update load demand by a certain load growth percentage in each year.
2- Solve the power flows (6) to (9), and determine the necessary upgrades for all the equipment and the total power losses (Ploss) in the network.
(6)
(7)
(8)
(9)
3-Determine the expected energy losses’ costs using (10) in each year (10) 4-Finally, evaluate the NPV of upgrades and losses costs as shown in (11) and (12), respectively (11) (12) E. Evaluate the Power Required From the DS Units under Contingencies N-1 contingency analysis is implemented considering the failure of each line in the network. Failure of the line causes island formation. If either DGs or DS units are present in the island then the load in the island formed can be met by them. The contingency analysis is to solve the power flow equations in all the formed islands to know the power necessary from each DS unit for all the system states. The contingency analysis is described in [6]. F. Evaluate the Annual Arbitrage Benefit and Interruption Cost The annual arbitrage benefit (13) and interruption costs (14) are estimated using MCS. The process for executing MCS is described in [11] (13) (14)
Determine the net present value of the arbitrage benefit and interruption cost with interest rate (IR), inflation rate (F), and planning period as in (15) and (16) respectively [6] . (15)
(16)
(17)
G. Evaluate the Objective Function The main objective (fitness) function as shown in (18) minimizes the system costs and maximizes the arbitrage benefit. (18) The batteries have to be replaced at least once in the planning period (5 years). Hence CR is calculated as in (19) [16]. (19)
Subject to: (20)
(21)
(22)
(23)
(24) The first and second constraints imply that the discrete power and energy ratings of the BESS in terms of the integer decision variables. (22) and (23) confine the power and energy sizes of the BESS to the maximum available sizes. The decision variables of BESS placement are restricted to the set B as in (24).
IV. CASESTUDY
International Journal of Innovative Technology and Exploring Engineering (IJITEE) ISSN: 2278-3075,Volume-8 Issue-6, April 2019
23 24 25 26 27 28 29 30 31 32 33
1 2 3 4 5 6 7 8 9 10 11 12 13 14 15 16 17 18
19 20 21 22
[image:5.595.47.289.51.226.2]Substation
Fig. 3. System under study [11]
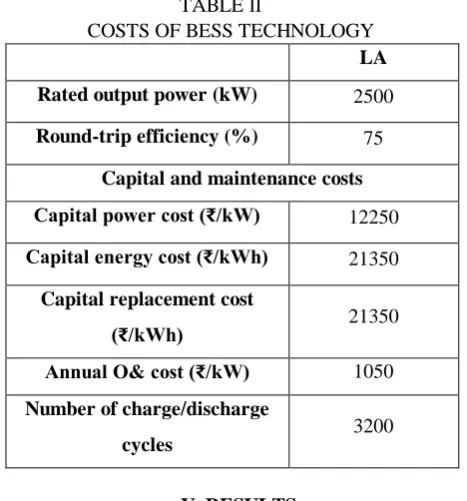
[image:5.595.336.541.79.268.2]The DG considered is an intermittent DG based on wind and is assumed connected at bus 18 as the voltage at that bus is minimum. The costs for DS installation are categorized into: the capital power cost, the capital energy cost of storage capacity, the capital replacement cost, and the operation and maintenance (O&M) cost shown in TABLE Ⅱ. Lead-acid battery (LA), has been selected as ESS. Depending on the availability of the land, the candidate buses for DS placement have to be incorporated in the set B: (16, 17, 21, 22, 25, 32).
TABLE Ⅱ
COSTS OF BESS TECHNOLOGY LA Rated output power (kW) 2500 Round-trip efficiency (%) 75
Capital and maintenance costs Capital power cost (₹/kW) 12250 Capital energy cost (₹/kWh) 21350
Capital replacement cost
(₹/kWh) 21350
Annual O& cost (₹/kW) 1050 Number of charge/discharge
cycles 3200
V.RESULTS
The results from the adopted methodology for a planning period of 5 years using LA battery are shown in TABLE Ⅳ. The capital costs, maintenance costs, replacement costs and the size of battery in kW are shown. The optimal charging/discharging operation done by FOA is shown in TABLE Ⅴ. The voltage profile of 33 bus distribution network with and without ESS are shown if Fig. 4 and Fig. 5 respectively. The optimal charging and discharging schedule for different batteries using linear programming [11]and FOA are shown in TABLE Ⅵ and TABLE Ⅶ respectively. The arbitrage benefit obtained using FOA is more than the
arbitrage benefit obtained using Linear Programming (LP).
TABLE Ⅳ
BESS COSTS AND RATINGS
Scenario LA
N
P
V
of
D
S
c
os
ts Capital costs (₹) 6,720,000
Maintenance costs (₹) 935,900 Replacement costs (₹) 1,747,200
Total (₹) 9,403,100
In
stal
le
d
D
S
u
n
its
(k
W)
Bus 16 0
Bus 17 100
Bus 21 100
Bus 22 0
Bus 25 0
Bus 32 0
[image:5.595.58.292.384.635.2]
TABLE Ⅴ
Optimal DS Charging/Discharging Schedule Load
state no.
DS status LA
1 Charging 5.4
2 Charging 36.7
3 Charging 65.0
4 Charging 90.4
5 Discharging 8.1
6 Discharging 49.8
7 Discharging 99.5
8 Discharging 21.0
9 Discharging 39.5
10 Discharging 100
TABLE Ⅵ
Optimal DS Charging/Discharging Schedule using LP Load
State DS status LA Na/S VR 1 Charging 595.6862 28.3916 27.6863 2 Charging 599.2812 17.1571 13.5272 3 Charging 598.0047 40.1606 48.0789 4 Charging 597.9155 0.0010 0.0865
5 Dischargin
g 213.7863 1.8992 1.0932
6 Dischargin
g 212.1146 1.8774 1.0749 7 Dischargin
g 212.1146 1.8774 1.0749
8 Dischargin
g 225.3859 8.2245 10.2174
9 Dischargin
g 270.7510 24.4057 27.7308 10 Dischargin
g 600.00 100.00 100.00 Arbitrage benefit
(₹) 31,498 1058 370
[image:5.595.324.556.480.833.2]TABLE Ⅶ
Optimal DS Charging/Discharging Schedule using FOA
Load
State DS status LA Na/S VR 1 Charging 525.00 33.00 62.00 2 Charging 478.00 9.10 23.60 3 Charging 434.70 52.70 57.00 4 Charging 423.20 65.80 62.80 5 Discharging 49.80 25.10 0.00 6 Discharging 119.10 85.70 36.50 7 Discharging 223.60 0.20 30.00 8 Discharging 511.60 63.00 0.20 9 Discharging 284.60 15.20 84.90 10 Discharging 600.00 100.00 100.00 Arbitrage benefit (₹) 78,593 29,186 8272
VI. CONCLUSIONS
In this work, the optimal size and placement of ESS considering NPV of BESS capital costs, maintenance costs, replacement costs and arbitrage benefits is determined using Genetic Algorithm. The methodology is adopted for a planning period of five years with an increment of load every year by 5%. The optimal charging/discharging operation of the DS during all the load states is done by using FOA. Integration of ESS in distribution network increases the system reliability, defers upgrades and also reduces the losses in the network. This work can be extended with different combinations of DGs and different DS technologies.
REFERENCES
1. IEEE Guide for Design, Operation, and Integration of Distributed Resource Island Systems with Electric Power Systems, IEEE Standard 1547.4-2011, 2011.
2. Jiazhi Lei and Qingwu Gong, “Operating strategy and optimal allocation of large-scale VRB energy storage system in active distribution networks for solar/wind power applications,” IET Gener. Transm. Distrib. , vol. 11 Iss. 9, pp. 2403-2411, Jun. 2017.
3. Y. Zheng, Z. Yong Dong, F. Ji Luo, Ke Meng, J. Qiu, and K. Po Wong, “Optimal allocation of energy storage system for risk mitigation of DISCOs with high renewable penetrations,” IEEE Trans. Power Syst., vol. 29, no. 1, Jan. 2014.
4. S. X. Chen, H. B. Gooi, and M. Q. Wang, “Sizing of energy storage for microgrids,” IEEE Trans. Smart Grid, vol. 3, no. 1, pp. 142-151, Mar. 2012.
5. C. A. S. Rangel, L. Canha, M. Sperandio, and R. Severiano, “Methodology for ESS-type selection and optimal energy management in distribution system with DG considering reverse flow limitations and cost penalties,” IET Gener. Transm. Distrib. , vol. 12, Iss. 5, pp. 1164-1170, Jan. 2018.
6. A. S. A. Awad, T. H. M. EL-Fouly, and M. M. A. Salama, “Optimal ESS allocation and load shedding for improving distribution system reliability,” IEEE Trans. Power Syst., vol. 28 no. 5, pp. 2339-2349, Sep. 2014.
7. C. Abbey and G. Joss, “A stochastic optimization approach to rating of energy storage systems in wind-diesel isolated grids,” IEEE Trans. Power Syst., vol. 24, no. 1, pp. 418-426, Feb. 2009.
8. C. Chen, S. Duan, T. Cai, B. Liu, and G. Hu, “Optimal allocation and economic analysis of energy storage system in microgrids,” IEEE Trans. Power Electron., vol. 26, no. 10, pp. 2762-2773, Oct. 2011.
9. A. S. A. Awad, T. H. M. EL-Fouly, and M. M. A. Salama, “Optimal ESS allocation for load management application,” IEEE Trans. Power Syst., vol. 30 no. 1, pp. 327-336, Jan. 2015.
10. A. Giannitrapani, S. Paoletti, A. Vicino, and D. Zarrilli, “Optimal allocation of energy storage systems for voltage control in LV distribution networks,” IEEE Trans. Smart Grid, vol. 8, no. 6, pp. 2859-2870, Nov. 2017.
11. A. S. A. Awad, T. H. M. EL-Fouly, and M. M. A. Salama, “Optimal ESS allocation for benefit maximization in distribution networks,” IEEE Trans. Power Syst., vol. 8 no. 4, pp. 1668-1678, Jul. 2017.
12. M. Ghaemi, M-R. F-Derakshi, “Forest optimization algorithm,” Elsevier, Expert system with applications 41, pp. 6676-6687, May, 2014. 13. P. Wang et al., “The IEEE reliability test system-1996. A report prepared
by the reliability test system task force of the application of probability methods subcommittee,” IEEE Trans. Power Syst., vol. 14 no. 3, pp. 1010-1020, Aug. 1999.
14. Y. M. Atwa and E. F. El-Saadany, “Probabilistic approach for optimal allocation of wind-based distributed generation in distribution systems,” IET Renw. Power Gener. , vol. 5, no. 1, pp. 79-88, Jan. 2011.
15. S. A. Arefifar, Y. A. I. Mohamed, and T. H. M. El-Fouly, “Supply-adequacy-based optimal construction of microgrids in smart distribution systems,” IEEE Trans. Smart Grid, vol. 3, no. 3, pp. 1491-1502, Sep. 2012.
16. Y. M. Atwa and E. F. El-Saadany, “Optimal allocation of ESS in distribution systems with a high penetration of wind energy,” IEEE Trans. Power Syst., vol. 25 no. 4, pp. 1815-10822, Nov. 2010.
17. B. Venkatesh, R. Rajan, and H. B. Gooi, “Optimal reconfiguration of radial distribution systems to maximize loadability,” IEEE Trans. Power Syst., vol. 19 no. 1, pp. 260-266, Feb. 2004.
18. S. Wong, K. Bhattacharya, and J. D. Fuller, “Electric power distribution system design and planning in a deregulated environment,” IET Gener. Transm. Distrib. , vol. 3 no. 12, pp. 1061-1078, Dec. 2009.
19. K. M. L. Prasanna, J. Somlal, R. J. Ranjithkumar, and A. Jain, “Load flow studies for distribution system with and without distributed generation,” Water and Energy International, vol. 57, no. 12
20. Kumar T. R., and Gattu K. R., “Multi objective particle swarm optimization algorithm for ideal sizing and siting of distributed generation (DG) systems,” Journal of advanced research in dynamical and control systems, Jan. 2017.
AUTHORSPROFILE
K. Pranavi is pursuing M. Tech (Power Systems) in KLEF, deemed to be university. She obtained her B. Tech degree from V. R. Siddhartha Engineering College, Vijayawada. Her areas of interest include power system optimization and micro grids.
Dr. P. Linga Reddy is a Professor of Electrical Engineering, KLEF, deemed to be university. He studied B. Tech, M. Tech in Andhra University. He passed B. Tech in 1962 with first class and M. Tech in 1965 with first class. He did his Ph. D. in IIT Delhi during 1974-1977. He worked 33 years in JNTU. He published 56 papers in both national and international journals. His research interests are applications of control system principles for practical problems such as power systems, health systems etc., He has got FIE (Fellow of Institution of Engineers, India). He is a life member of ISTE, India. He got 3rd rank in SSLC of Andhra area in 1956. He got central government merit scholarship from intermediate onwards throughout his studies.
![TABLE I PROBABILISTIC LOAD MODEL [11]](https://thumb-us.123doks.com/thumbv2/123dok_us/8214075.263825/3.595.309.540.175.607/table-i-probabilistic-load-model.webp)