International Journal of Innovative Technology and Exploring Engineering (IJITEE) ISSN: 2278-3075, Volume-8 Issue-5S March, 2019
Abstract: Coconut is one of the main agricultural plantation crops in many countries and known as “tree of life”. Coconut is universally facing major challenges due to poor agricultural practices and farm management, especially in the northern part of Malaysia. The objective of this paper is to explore the potential for web-based 3D visualization of GIS data in the management of coconut planting in terms of problems and issues. The data collected from a field observation will be used in this study as the source of primary data for the planting of coconut. Other than that, by interviewing with coconut palm manager, the problems and issues of managing coconut plantation were gathered. The results showed that the main problems for the introduction of new technologies could be highlighted due to the problem of manual cultivation practices and the lack of proper management practices. Besides that, lack of awareness of the farmers regarding the potential of the new technologies which could be utilised for managing and monitoring coconut plantation. The results of this study may help to identify the appropriate problem and problems in the implementation of web-based 3D visualization of GIS data for the management of coconut planting.
Keywords: 3D Visualization, Coconut, Plantation Management, GIS, problems.
I. INTRODUCTION
It is visibly shown recently in Malaysia that coconut planting is almost going to die out compared to other coconut growers worldwide, such as Vietnam, Cambodia, the Philippines and Indonesia. Nowadays, numerous systems for coconut based cultivating have been presented however every one of these procedures are treated as poor cultivating and manual portrayals of plantation. This is because of the point that the necessity for specific manual skills is making issues in the coconut business. This issue might be a straight aftereffect of the diverse business of coconut and the particular cultivating strategy where it is planted. From this time forward, the inspiration behindhand this study is to show the online based computer dependent system and to develop a solution that would support decrease it.
Revised Manuscript Received on March 08, 2019.
Rizinoor Che Mat, School of Creative Industry Management & Performing Arts (SCIMPA), Universiti Utara Malaysia, 06010 Sintok, Kedah Malaysia,
Gonesh Chandra Saha, School of Multimedia Technology and Communication (SMMTC), Universiti Utara Malaysia | 06010 Sintok, Kedah Malaysia
Assurance that coconut cultivating won't finish in Malaysia since it's perceived that it is reasonably profitable to us [1]. Paragraph: use this for the first paragraph in a section, or to continue after an extract.
Information Technology (IT) innovation backing in the agricultural development in certain ways, yet the long-time past years of agricultural practice isn't sufficient for the developing world. In any case, the requirement for current agricultural information dissemination is imperative with the goal that it might be utilized to all piece of the world. Cultivating has been a piece of human being rooted back and the requirement for the information of agriculture is likewise old. Increase in quick advancements in technology innovation and spreading its information and the getting to of information identified with geology are altogether met up to give another effort to Geographical Information Systems (GIS). Since information is the main key to achievement in every single agricultural advancement, GIS and Google Earth are thus trusted as a tool for the dissemination of information in agriculture [2]. Monitoring system governed by ICT is generally connected in various farming regions. Such innovation incorporate the remote monitoring of farming environments and the remote controller of farmhouse tools, for example, water irrigation system, through cell phone uses [3].
Routine monitoring of crop yield health in agriculture is also regularly required for precise site-specific management when determining the high degree of determination [4]. Computer technology has improved many aspects of the oldest occupations, which is agriculture. With this, it is believed that computers have transformed farming activities. Designing of farmer’s three-dimensional (3D) visualization technologies will make significant farming view for decision-making in agriculture, which results in developing a model of web based 3D visualization of GIS data for the management of coconut planting. In agriculture, these improvements include automated milk collection that comprises the robotic milking machine and the use of GIS and Remote Sensing (RS) in agriculture, automated weather station, Global Positioning System (GPS) in agriculture and computerized farmland assessment. With this, it is believed that computers have transformed farming activities.
In relation to this for oil palm plantation, that has been rising gradually by using various technology and methods such as GIS, GPS and RS [5].
Exploring the potential of web based 3D
visualization of GIS data in Coconut plantation
management
RS technology cooperating with GIS innovation has a major potential in directing the player in agriculture industry for settling on a correct decision for correct management. Along these lines, GIS is another approach to visualize, coordinate, solve, manage and exhibit information. GIS is a system for catching, storing, incorporating, analyzing and displaying information which is spatially referenced to the earth. The development of versatile GIS is overhauling the science and technology to new skyline [6].
Besides that, GIS is the sharing and gathering of info to deliver pictorial of the agricultural situations, and monitoring and measuring the effects of management practices for the farm land [7]. Manufacturers utilize GIS to enhanced deal with their plantations by making information-dense reports and draws that provide a one kind point of view of their activities. GIS can be used in conjunction with RS tools to absolutely determine and save preventive costs, control inputs and reduce the volume of damage to the top soil. GIS is used by plant managers to visualize their products, management practices and agricultural land. GIS and RS technology open up a wide range of uses that can now be used [8].
Researchers likewise believe that GIS shows a vital part in framing worldwide farming strategy as decision and incorporated technologies for monitoring crop yield. In farming, GIS shows part in decision creating applications, soil disintegration applications, policy making, prediction applications, reproduce environmental transformation applications, nitrogen and pest management, cropping pattern investigation, managing weeds, utilizing verifiable management to decrease topsoil sampling mistakes, yield information and its monitoring, soil salinity mapping and fertility management so on [9]. GIS and RS are the only tool that allows farmers to visualize data that could otherwise be difficult to infer. The part of GIS in agriculture is growing as technology is analyzing, managing and acquiring information on agricultural forms related to space GIS as a technology is significantly advanced today, so that its employees have been very important in the design of the GIS tools now accessible by distributing their applications and innovations formally and informally. GIS in agriculture identifies that GIS-based tools play a particular role in this area and create it in all facets [10].
In connection with this 3D GIS model, terrain structures are naturally communicated in a way that improves the management and investigation of a proposed venture by 3D visualization. Utilizing 3D GIS modeling offers an adaptable intuitive system while giving extraordinary visual interpretations of information compared to other visual translations of information which supports decision processes and planning. The 3D GIS model provides access to information mapping to help plan, manage and design information. GIS tools and intelligent GIS models help the planning of groups and the application of territorial standards and training. 3D GIS provide planners and organizers with a helpful instrument for displaying and analysis. With analysis and visualization capacity, 3D GIS are viewed as a capable tool to solve different issues [11].
Different 3D visualization systems for geographic data have been developed in the past. They diverge in several aspects such as their used datasets, application, and
visualization techniques. Three-dimensional (3D) computer visuals technology is extensively used in different areas and the usage of 3D models significantly aids to improve the design and cartographic appearance. 3D models are further visually capable, easier and quicker to understand and they can express more comprehensive geographical information. However, it is hard to precisely and efficiently use 3D models in local systems [12]. Besides that, it revealed from another study "Rapidly changing data visualization on the Web-based 3D is challenging" [13].
Presently, 3D visualization applications in agricultural farming that produce a large measure of information could be utilised. This study will investigate the potential use of web based 3D visualization to beat current obstacles in coconut estate plantation to uncover the real issues confronting coconut farmers. At last, it will ensure that coconut plantation will keep on achieving sustained area of coconut palm plantation. A web-based 3D visualization of GIS data for the management of coconut planting can help coconut palm managers manage their planting more efficiently. The objective of this paper is to explore the potential for web-based 3D visualization of GIS data in the management of coconut planting in terms of problems and problems. The results of this study may help to identify appropriate problems and problems in the implementation of web-based 3D visualization of GIS data for the management of coconut planting.
II. PREVIOUS WORKS
Mat et al.(2016,5) investigated a web based 3D visualization technique for oil palm plantations that can help oil palm managers manage their plantation more effectively. They mentioned in their research about the reasonable issues of managing oil palm cultivation and to identify how these issues could be feature in creating of web based 3D visualization systems for oil palm plantation management utilizing diversion game engine technology. Consequently, Visualization is the graphical introduction of data, with the objective of enhancing the visual understanding of the information substance. As the present world is getting wealthier in data, visualization of the data is essential for decision making and powerful communication. The 3D visualization in Computer Aided Design (CAD) is intense tool for passing on data to basic decision making process in normal risk assessment [14].
International Journal of Innovative Technology and Exploring Engineering (IJITEE) ISSN: 2278-3075, Volume-8 Issue-5S March, 2019
More specifically, authors present a method for processing real-time sensor data streams to permit accessible Web-based 3D visualizations. In their work, they look at Web-based 3D visualizations for such sensor data streams. Adding the 3rd dimension allows displaying more data dimensions and spreads the available information space. Distributing such visualizations over the web through a browser-based client expands accessibility.
In an online based farm management method that permits the agriculturalists to access and processes the information that is accessible on the Internet and utilized to manage different phases of a farm. The author descried in their research about the approach to increase the information dissemination to the agriculturalists. It is required for the improvement of farming to develop the livelihood of agriculturalists. The study inspects the basic visualization of plantation in 3D system for Jigawa state agricultural environment. This means that, in what way plant of the space will be showed virtually. The researchers initiated with observing several groups that work on farming activities based on how they developed in farming tools and how to expand the flow of information from farming activities through current channels for rural development and viable farming. It appearances at the implementation of the model and the design of 3D farmer’s visualization tools [2].
Especially in precision agriculture, [16] described the novel 3D sensing methods associate a significant potential to expand crop monitoring. In this contribution, the focus will be on (i) understanding the 3D information of crop surfaces derived by different sensors, (ii) 3D data analysis using multi-temporal Crop Surface Models (CSM), and (iii) applying an established GIS technique for resampling plant height information given to progress crop management. Consequently, in numerous studies it is proofed that corresponding biomass and crop growth can be reliable monitored with 3D data gathering methods. In this connection, [17] proposed a cloud computing technologies that can basically contribute to business procedures in agriculture, by integrating processes like, monitoring, operation farm management, with cloud specific capabilities, through enhancing traditional farm management systems, which will lead to an increased yield. Agriculturalists cloud access various set of data and information related to his farm, in a unified and integrated approach in order to be supported in decision making process and take informed decisions as well.
[18]introduced an open-source 3D solar radiation model combined with 3D GIS that has been shown to achieve efficient visualization and computation for 3D urban models. The combination with 3D GIS can enable the integration of multisource geospatial data in decision making and analysis. At the same time, [19] applied 3D GIS techniques for 3D cadastre in a city environment to bridge the gap between urban space management system and urban simulation. The authors enlarged the details of the applications where 3D GIS should be intensely studied, such as 3D integrated visualization of entities on above and underneath the earth's surface, valid 3D geometric primitives as well as 3D spatial analysis. There is a broad potential field for 3D simulation and visualization, 3D data
and 3D modelling, practice and decision-making support. Also [20] discussed GIS based agricultural system, which can help agriculturalists during various stages of farming. It uses information base to offer support for better reasoning.
Similar to Zhou’s model, [21] presented a 3D models and photorealistic visualizations of environs that are important in many applications ranging from analysis and monitoring of land use/cover, to virtual representation of landscape, as well as landscape planning and management. They supplemented about basic information in 3D modelling that includes GIS datasets for land cover, relief, hydrography, roads, buildings, and visitor infrastructure, as well as RS data such as orthophoto images and satellite, LiDAR, and radar. In their article, the static 3D views were presented as they reveal in the highest level of detail the real world and may be used for creating 3D panoramic maps or for environmental monitoring. Diverse visualization techniques are demonstrated for basic land elements, e.g., rocks, vegetation, water, sand, 3D symbols for trees, buildings, leisure and sport facilities. It deals effective means for visual communication of 3D spatial data. In this connection, [22] conducted a study on the utilization of GIS and remote sensing for enhanced natural resources management: case study from different agroecological zones of West Africa. The study concentrated on the understanding of multi-worldly remote sensing imagery including airborne photographs and high spatial resolution satellite pictures of pilot villages in various AEZ of Benin and Nigeria. It likewise investigated soil disintegration after some time and space with a view to give conceivable methodologies on the enhanced management of natural resources. It recommended that appropriate rangeland management is required to decrease the effect of cows on the soil and vegetation. Different prerequisites are staff trained and proper hardware on GIS and remote sensing.
Recently, [23] mentioned in a study recognizing deserted oil palm zones utilizing satellite pictures is relatively nonexistent. Expectedly, the monitoring of relinquished oil palm lands is repetitive and tedious, particularly finished substantial zones. Consequently, in the article, the capacity of high resolution satellite picture through Satellite Pour I'Observation de la Terre-6 (SPOT-6) items to remove relinquished oil palm territories was investigated, just like the utilization of multi-worldly Landsat Operational Land Imager (OLI) Imager to build up the phenology of surrendered oil palm destinations. The study exhibited the usage of multi-transient Landsat OLI pictures to create trim phenology of surrendered oil palm and non-relinquished oil palm. The outcome demonstrated that product phenology of relinquished oil palm and non-surrendered oil palm isn't as clear as occasional yields, for example, rubber trees and rice paddy.
The study provides a very promising and effective method for forming 3D Web GIS recognition. Another study from [25] described the effectiveness of visualizing web based 3D terrain draped with diverse satellite images.
Work by [8]analyzed the application of RS and GIS for climate transformation and farming in the Philippines to use the data collected by the RS and GIS to enable the growers by taking a full observation of the farmsteads health. The study of GIS and RS for weather change and farming to get wide variety of environmental information can be utilized to deliver the farm workers with precision crop information, yield estimation, maps and much more which is very helpful for the farmers as well as with the policy creators so they can give fundamental intends to encourage the agriculturists. The study defined the requirement of an application that utilize data gathered from GIS and RS tools to inform the farmers and help the agriculturists in Philippines.
Nowadays, most of the systems still maintain 2D visualizations and lack on 3D visualizations. Currently, the trend is moving visualization, which more often can be seen as photorealistic more effectively [5]. In this way, [26] developed the web based 3D terrain visualization system aimed at visualizing oil palm plantation effectively. Unfortunately, this system did not involve the database of oil palm trees where each of the oil palm tree was located manually based on its location on satellite images. Besides that, [27] mentioned a study outcomes from web based 3D Terrain Visualization: Implementation and Testing to decide in what way web based 3D terrain visualization could be involved using the most appropriate GIS application by finding the related web server to introduce the system.
The request for web based 3D terrain visualization has increased not just for geographers, geologists, psychologists and cartographers but also popular amongst the ordinary people.
On the other hand, digital farm for oil palm plantation was also discussed by [28] but most of the discussion in this study only related on how to manage the oil palm plantation by utilizing RS, GIS, and DBMS technology based on 2D technology. None of the discussions mentioned about 3D technology to manage coconut plantation.
III. METHODS AND MATERIALS
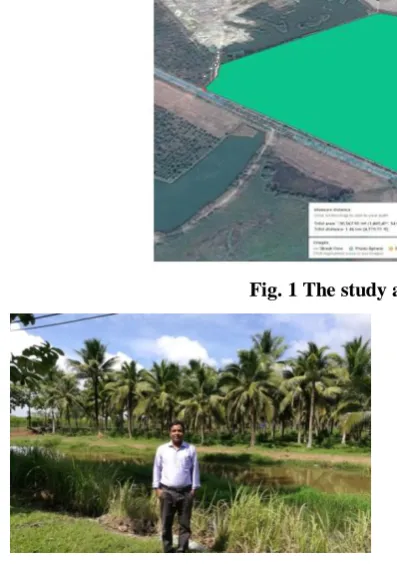
[image:4.595.153.447.436.572.2]To investigate the potential factors of web based 3D visualization, information and comments from the experts are required. The experts involved include those from academia, practitioners and private companies. This paper focus on the expert views from coconut plantation management. This study employed qualitative approach. For the purpose of this study, first the research carried out an observational study at north part of Malaysia referring at Figure 1. From the study site pictures, it shows clearly the condition and status of the study area as the researchers were at a plantation site by personally going there (Figure 2). This study area is at the north part of Malaysia where coconut plantation took place. The features that being observed are coconut breed, consisting of site of plantation and plantation method, the disease, weeds affecting coconut trees and growth based on their breed. All of the criteria and features found during an observation will be adhered in the research to assist in providing a clear picture of the subject.
[image:4.595.74.273.441.723.2]Fig. 1 The study area 1 (Source: Google maps)
Fig. 2 Coconut plantation in north part of Malaysia
These photos will be followed in our research to help with providing a clear concept and valuable information relating to the subject.
International Journal of Innovative Technology and Exploring Engineering (IJITEE) ISSN: 2278-3075, Volume-8 Issue-5S March, 2019
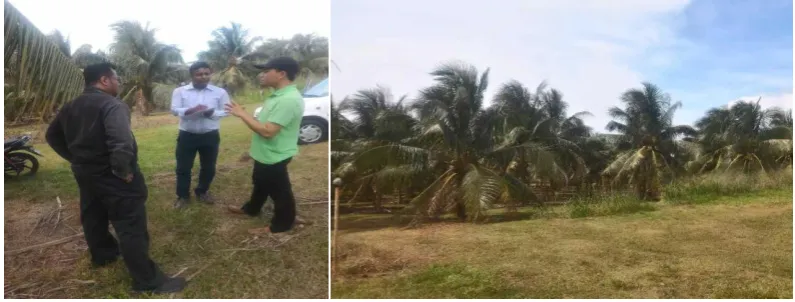
which was a relief. His answers were also witty, insightful and very technical for identifying the real facing problems. The research tends to meet with that plantation manager since he was responsible for coconut plantation with estimated 7.6 acres of land. There were adding up to 454
[image:5.595.99.497.132.283.2]trees in that planted territory. The inter distance among the trees was around 9x9 square meters for each tree in that plots. The interview had a few particular objectives as a top priority when it drew closer with specific questions for finding real plantation difficulties.
[image:5.595.75.310.136.468.2]Fig. 3 Personal interview in plantation area, Perlis
Fig. 4 The study area 2 (Source: Google maps)
The semi structured question that being asked during the interview session are:-
(1) Question 1: Can you brief a little bit about your coconut plantation?
(2) Question 2: What about information of the tree? Are they been recorded? For example, its location, status, age, distribution of water, solar radiation and soil type, selection of unproductive and old coconut tree, dead leaves, weed control, pests & disease control and so on?
(3) Question 3: How long is the distance between each of the coconut palm tree that been planted?
(4) Question 4: What are the important things that need to be monitored for everyday work routines?
(5) Question 5: Is there a change in the crop situation compared to the last surveillanc
(6) Question 6: What kind of change?
(7) Question 7: Is there any serious pest or disease outbreak?
(8) Question 8: Are normally all the pest and diseases identifiable?
(9) Question 9: What management practices are needed at this moment?
(10) Question 10: Can you explain about the management system that normally being used by other organization/ company?
(11) Question 11: There is a research doing on using web based 3D visualization technique to manage coconut palm plantation. Have you ever used and know any web based system that can monitor the coconut palm tree or manage the plantation like this before?
(12) Question 12: If it possible to make a system that can view and display the data of coconut palm trees by navigating through coconut palm plantation in 3D environment, does it will help the management?
(13) Question 13: What are the strategies formulated for coconut plantation in the future?
(14) The results and finding from this field observation and interviewed will be discussed in the next section.
IV. RESULTS AND FINDINGS
From the field observation, it’s displaying that the so-called traditional farming practices are the main reasons for the deterioration in yield. The region of plantation is neither organised nor planned wisely that harming of soil and wastes area here. The cultivation site pictures showing existence of pests and weeds that is necessary to detect earlier for ensuring normal growing and selection of quality seedlings for better yield to sustainable growth in productivity. Theoretically, the best utilization of water, light, nutrients and space by individual plants in a crop stand occurs when plants are equal distance from each other in all directions. This distance, known as the equidistant plant spacing but it’s discovered from the picture that is not equal. This is another investigation issue in cultivation site in north part of Malaysia.
and that is very hard to identify if the tree is infected. They contacted with the agriculture department for protecting the attack of this Red Palm Weevil. He mentioned that Agriculture department have a plan to increase coconut productivity. Another identifiable pests and diseases from the plantation were Termites Hill and coconut palm rhinoceros beetle (Oryctes rhinoceros) that usually affects around the leaves. On the other hand there is no use of GIS application for recording information of the tree but only general data like pests and disease is collected by manually. At the same time, Agricultural department is using GIS based analysis for Jackfruit management. Hence, there is a lack of on-going maintenance activity with 1-2 months interval for controlling pests or pulling dead leaves.
Fertilizer is commonly applied in the plot during dry season depending on the demand for controlling diseases. The frequency of applying fertilizer is two times within a year at rate of 5kg for each tree that’s equivalent to 2.5 kg for 6 months interval. He mentioned that most of the works are done by manually.
[image:6.595.115.485.230.426.2]Additionally, it is identified and discovered from the field interview that is about shortage of reliable and skilled workers for managing coconut plantation and are mostly human dependent. When the respondent was asked about the usage of web based 3D visualization of GIS data for coconut palm plantation management, the respondent agreed with the concept and gave a positive respond.
Fig. 5 Sample of web based 3D visualization for oil palm plantation management (adopted from: [29])
The sample of the system can be referring at Figure 5. He mentioned that the system will definitely help them so much in managing their coconut plantation. For example, by introducing this new system, it’s potential to disseminate information from actual coconut palm plantation data such as area of the plantation, will be view virtually and accessible on the internet, the information of plants in 3D form to farmers (like the air pressure, distribution of water, name, soil type or soil pH of the area or soil materials on the field and solar radiation). The data collects from real coconut plantation such as tree location, number of trees, dried or dead leaves. Besides ripe fruits status, weed and pests control and satellite images and selection of unproductive and old coconut palm with area of plantation, and management practice data could be used. As the real field data could be used for real world simulation in the future system, it is vital for decision makers to understand what information that they can gather for decision making process.
V. CONCLUSION AND FUTURE WORKS
In light of the findings that have been talked about before, it can be concluded that with a specific end goal to plant coconut, it can't be denied that problem and issues facing by the coconut farmer is huge. Taking everything into account, from the field observation and interview conducted, there are numerous problem and issues should be consider in
guaranteeing the feasible coconut plantation. At the point when the coconut trees are in healthy condition, more yields can be obtained from the plantation. The outcome from this study helps in finding the appropriate problem and issues that should be focused in developing online 3D visualization of GIS data for coconut plantation management which are at present managed by manual farming practices. Some of the problem and issues are manual farming practices of coconut based cultivating and absence of legitimate management ractivites is the primary issues could be feature for presenting the new technologies. Other than that, absence of awareness with the agriculturists in regards to the capability of the new technological advancements which could be used for dealing with the information of the coconut plants, diseases and pest problems, and furthermore monitoring exercises of the farmer additionally the challenging issues. By implementing this new online 3D visualization system, the majority of the problem and issues could be managed effectively.
International Journal of Innovative Technology and Exploring Engineering (IJITEE) ISSN: 2278-3075, Volume-8 Issue-5S March, 2019
It would be one of the handful applications of utilizations that make 3D models that would detect real field large information and show it in a more significant manner to apply farm management strategies in managing their plantation at anytime, anywhere and anyplace with effectively and efficiently.
VI. ACKNOWLEDGEMENTS
This research was supported in part by the fellowship grants for higher education and research in ICT, Information and Communication Technology Division, Ministry of Posts, Telecommunication & Information Technology, Government of People’s Republic of Bangladesh and Skim InsentifPascasiswazah from UUM.
REFERENCES
1. Naik, J Nehru, “Growth Trends in Area, Production and Productivity of
Coconut in Major Growing Countries.” IOSR Journal Of Humanities
And Social Science vol. 22, no. 12, pp. 47–56,
2017.https://doi.org/10.9790/0837-2209124756.
2. Obiniyi, Afolayan, “A Web-Based Farm 3D Visualization Management
System.” Journal of Computer Science & Systems Biology, vol. 8, no. 1, pp. 49–54,2015. https://doi.org/10.4172/jcsb.1000170.
3. Yoshida, Koshi, Kenji Tanaka, RyunosukeHariya, IssakuAzechi,
Toshiaki Iida, Shigeya Maeda, and HisaoKuroda, “Contribution of ICT
monitoring system in agricultural water management and
environmental conservation”. In Serviceology for Designing the Future, Springer, Tokyo, Japan, 359–369,2016.
4. Huang, Yan Bo, Steven J. Thomson, W. Clint Hoffmann, Yu Bin Lan,
and Bradley K. Fritz, “Development and Prospect of Unmanned Aerial Vehicle Technologies for Agricultural Production Management.” International Journal of Agricultural and Biological Engineering vol. 6, no.3, pp. 1–10,2013. https://doi.org/10.3965/j.ijabe.20130603.001.
5. Mat, Ruzinoor Che, Norani Nordin, Abdul Nasir Zulkifli, and Shahrul
Azmi Mohd Yusof, “Suitability of Online 3D Visualization Technique in Oil Palm Plantation Management.” In AIP Conference Proceedings 1761, pp. 1–5,2016. https://doi.org/10.1063/1.4960871.
6. Mbaluka, Damaris, and George Okeyo. “Application of Geographical
Information System ( GIS ) and Mobile Application in Livestock Disease Management in Developing Countries.” International Journal of Science and Research (IJSR) vol. 5, no. 11, pp. 183–88. ,2016. https://doi.org/10.21275/ART20162668.
7. ESRI, “GIS Solution for Agriculture.” Retrieved from
http://www.esri.com/library/brochures/pdfs/gis-sols-for-agriculture.pdf on 09.09.17.
8. Brion, Jewarde D, and Francis F Balahadia, “Application of Remote
Sensing and GIS for Climate Change and Agriculture in Philippines.”,2017.
9. Johnson S, Yespolov T (2013). The role of Extension system and GIS
Technology in formation and Predicting Global Agricultural Policy: Precision Agriculture in Coming Fast, International Scientific Electronic Journal 4:1-12.
10.Hada, Edyta, “GIS SYSTEM FOR 3D VISUALIZATION OF
HYDRODYNAMIC MODELING OF FLOOD FLOWS IN RIVER VALLEYS ISOK - IT SYSTEM OF COUNTRY PROTECTION AGAINST EXTREME HAZARDS FLOOD MODELLING AND VISUALIZATION Hydrodynamic Modeling,” 1–5,2014.
11.Al-Rawabdeh, Abdulla, Nadhir Al-Ansari, Hussain Attya, and Sven
Knutsson, “GIS Applications for Building 3D Campus, Utilities and Implementation Mapping Aspects for University Planning Purposes.” Journal of Civil Engineering and Architecture,vol.8,no. 74, pp. 19– 28,2014.https://doi.org/10.17265/1934-7359/2014.01.003.
12.Kumar, Vikas, and Vishal Dave, “KrishiMantra : Agricultural
Recommendation System ∗ Categories and Subject Descriptors.”,2013.
13.Bröring, Arne, David Vial, and Thorsten Reitz.,“Processing Real-Time
Sensor Data Streams for 3D Web Visualization.” In Proceedings of the 5th ACM SIGSPATIAL International Workshop on GeoStreaming- IWGS’14, no. November: 72–80, 2014,
https://doi.org/10.1145/2676552.2676556.
14.Kemec, S, and S Duzgun, “3D Visualization for Urban Earthquake
Risk.” Geohazards, ECI Symposium Series P07, 2006.
http://dc.engconfintl.org/geohazards/37/.
15. Herman, L., and T. Řezník, “3D Web Visualization of Environmental
Information - Integration of Heterogeneous Data Sources When Providing Navigation and Interaction.” International Archives of the Photogrammetry, Remote Sensing and Spatial Information Sciences - ISPRS Archives 40 (3W3), pp. 479–85.
https://doi.org/10.5194/isprsarchives-XL-3-W3-479-2015.
16. Bareth, Georg, “3D Data Acquisition to Monitor Cropping Systems :
Sensors and Methods,” pp. 85–91,2015.
17. Mocanu, Mariana, Valentin Cristea, CatalinNegru, Florin Pop, Vlad
Ciobanu, and CiprianDobre, “Cloud-Based Architecture for Farm Management.” In Proceedings - 2015 20th International Conference on Control Systems and Computer Science, CSCS 2015, pp. 814–19. https://doi.org/10.1109/CSCS.2015.55.
18. Liang, Jianming, Jianhua Gong, Jieping Zhou, Abdoul Nasser Ibrahim,
and Ming Li, “An Open-Source 3D Solar Radiation Model Integrated with a 3D Geographic Information System.” Environmental Modelling & Software vol. 64, pp. 94–101, 2015
https://doi.org/10.1016/j.envsoft.2014.11.019.
19. Ying, Shen, RenzhongGuo, Lin Li, and Biao He, “Application of 3D
GIS to 3D Cadastre in Urban Environment.” In Proceedings of the 3rd International Workshop on 3D Cadastres: Developments and Practices, no. October: 253–72,2012.
20. Jain, Yash, Amita Sharma, and Sanjay Chaudhary, “Spatial Analysis
For Generating Recommendations For Agricultural Crop Production.”, 2012.
21. Dinkov, Davis, RumianaVatsevaEng Davis Dinkov, and
RumianaVatseva, “3D Modelling and Visualization for Landscape Simulation,” no. June: 13–17, 2016.
https://cartography-gis.com/docsbca/iccgis2016/ICCGIS2016-33.pdf. 22. Junge, B., T. Alabi, K. Sonder, S. Marcus, R. Abaidoo, D. Chikoye,
and K. Stahr. 2010. Use of Remote Sensing and Gis for Improved Natural Resources Management: Case Study from Different Agroecological Zones of West Africa. International Journal of Remote Sensing 31 (23): 6115–41.
https://doi.org/10.1080/01431160903376415.
23. Yusoff, Noryusdiana Mohamad, Farrah Melissa Muharam, and Siti
Khairunniza-Bejo, “Towards the Use of Remote-Sensing Data for Monitoring of Abandoned Oil Palm Lands in Malaysia: A Semi-Automatic Approach”. International Journal of Remote Sensing, vol. 38, no.2, pp. 432–49, 2017.
https://doi.org/10.1080/01431161.2016.1266111.
24. Miao, Ru, Jia Song, and Yunqiang Zhu, “3D Geographic Scenes
Visualization Based on WebGL.” 2017 6th International Conference on Agro-Geoinformatics, Agro-Geoinformatics2017.
https://doi.org/10.1109/Agro-Geoinformatics.2017.8046999.
25. Mat, Ruzinoor Che, Abdul Rashid Mohamed Shariff, Biswajeet
Pradhan, Ahmad Rodzi Mahmud, and Mohd Shafry Mohd Rahim “An Effective Visualization and Comparison of Online Terrain Draped with Multi-Sensor Satellite Images.” Arabian Journal of Geosciences, vol. 6 no. 12, pp.4881–89, 2013.https://doi.org/10.1007/s12517-012-0722-3.
26. Ruzinoor CM, Shariff ARM, Mahmud AR, Pradhan B, Rahim MSM,
“Development of Online 3D Terrain for Oil Palm Plantation.” In: World Engineering Congress (WEC 2010), Kuching Sarawak, Malaysia.
27. Ruzinoor, C. M., A. R M Shariff, A. R. Mahmud, and B. Pradhan,
“Online 3D Terrain Visualization: Implementation and Testing.” Journal of Applied Sciences, 2011.
https://doi.org/10.3923/jas.2011.3247.3257.
28. Adam, H., Collin, M., Richaud, F., Beulé, T., Cros, D., Omoré, A., Nodichao, L., Nouy, B. and Tregear, J.W., “Environmental regulation of sex determination in oil palm: current knowledge and insights from other species”. Annals of botany, vol. 108, no. 8, pp.1529-1537,2011.
29. Ruzinoor C M and M Mohd Hafiz, "Using game engine for online 3D
terrain visualization withoil palm tree data," Journal of
![Fig. 5 Sample of web based 3D visualization for oil palm plantation management (adopted from: [29])](https://thumb-us.123doks.com/thumbv2/123dok_us/8215512.264102/6.595.115.485.230.426/fig-sample-based-visualization-palm-plantation-management-adopted.webp)
