International Journal of Innovative Technology and Exploring Engineering (IJITEE) ISSN: 2278-3075, Volume-8 Issue-7, May, 2019
Abstract: This article discusses predictions of motion of railroad underframes along the rails with combinations of railroad switches obtained by models based on "Universal mechanism" software. The predictions are compared with experimental results used for verification of the models and computation of motion kinematics. Recommendations are given on determination of motion speeds along combinations of railroad switches.
Index Terms: combinations of railroad switches, simulation of motion, verification of models, comparison of predictions and tests, kinematic computation, determination of speeds.
I. INTRODUCTION
Motion speeds along the rails with combinations of railroad switches are determined either on the basis of operation experience with similar combinations or on theoretical analysis of motion speed along certain types of combinations based on procedures developed in the 1960-s.
This work is based on simulations of underframe–track dynamic system using "Universal mechanism" software (UM) [1, 2]. This software is used for automated analysis of mechanical objects which can be represented by a system of absolutely solid or elastic bodies connected by kinematic and force elements, such as: wagon, electric locomotive, diesel locomotive. Mechanical system can be either flat or spatial. For complex mechanical systems with high number of bodies not only the analysis of equations is a serious problem but also their derivation and even description of object structure. The method of subsystems implemented in UM significantly simplifies this procedure, especially in the cases when an engineering system comprised of several standard subsystems is analyzed. While simulating, it is required to preset and to describe properties of two interacting design systems: railroad rolling stock and railroad.
II. METHODS A. General description.
Railroad in UM software is characterized by track
Revised Manuscript Received on May 06, 2019
Boris Einikhovich Gliuzberg, Railway Research Institute, Moscow, Russia.
geometry (plane and longitudinal track profile), by geometry of railroad lines (irregularities of the lines in vertical and horizontal planes), elastic dissipative and inertial properties of rails. Simulation variables are comprised of main geometrical variables of railroad switches. Applicability of the developed models and their verification were based on field dynamic strength tests in the tack segment with single regular railroad switches, type R65, model 1/11, positioned counter-wise so that their branched directions formed S shaped curve with the radii of 300 m with straight rail plug of 5.53 m between the curves (front offset of stock rails). Switch points were curvilinear, flexible, secant type, with initial switch angle of 0°27'19.56".
B. Algorithm
The tests were performed on Russian railroads. The motion speed range was 25–60 km/h. The experimental train was comprised of loaded (230 kN/axle) and empty (60 kN/axle) freight wagons and all-steel passenger wagon. During the tests, horizontal transversal accelerations in wagon bodies were detected as well as vertical and horizontal transversal forces acting on the track under the impact of the experimental train. In addition, vertical and horizontal transversal elastic deformations (deflections and displacement under load) of rail elements were detected.
Simultaneously the considered variables were predicted using the models of underframe–track dynamic systems. Field measurements and predictions are summarized in Tables 1–3. On the basis of experimental results and simultaneous predictions, the correlation coefficients were determined between the predictions and experimental values of the considered variables (see Tables 1–3).
III. RESULTSANDDISCUSSION
It follows from the tables that the absolute difference between measurements and predictions in some cases exceeds 20%, however, the correlation coefficients are sufficiently high, which evidences interrelation between the measurements and nearly direct correlation between them. Hence, this required for verification of the used models and their application to prediction of motion speeds along the rails with combinations of railroad switches.
Application of Simulation Techniques Aimed at
Determination of Motion Speed Along Rails
with Combinations of Railroad Switches
The verification was performed according to the following two-stage algorithm.
At the first verification stage the absolute values were compared. The difference exceeded the allowable error determined during the experiments (20% in our case), therefore, the second stage was performed: correlation verification.
Since the correlation coefficients were in the range r ≥ ±0.7, the correlation between predictions and simulations was close to direct, and it was possible to transfer from simulations to field results using correction factors without modifications of model variables.
The correction factors were calculated as weighted average ratios of field measurements to predictions of each studied variable for overall combination of the considered variants. The obtained results are summarized in Table 4.
After calculation of correction factors the convergence of results was analyzed again with consideration for these
correction factors which were assumed to be fixed. The comparison revealed convergence of predictions and measurements which could be estimated as satisfactory with consideration for adopted error. Therefore, the predictions based on underframe–rail dynamic models implemented by means of UM software could be applied for determination of speed along combinations of railroad switches.
[image:2.595.43.559.329.557.2]While developing proposals on determination of underframe speeds along the combinations of railroad switches, it was required to analyze kinematics of their motion along these combinations in addition to their dynamic variables.
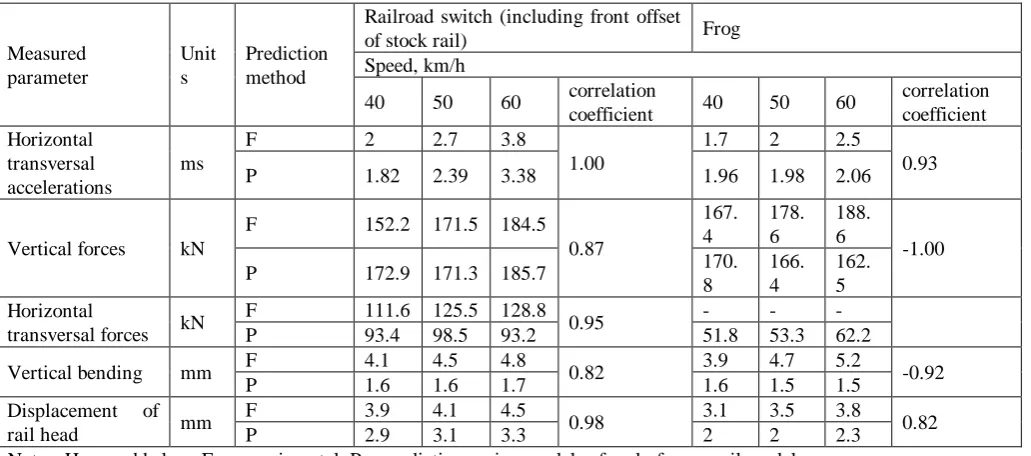
Table 1. Coefficients of correlation between predictions and field scale values of dynamic parameters for loaded open freight wagon
Measured parameter
Unit s
Prediction method
Railroad switch (including front offset
of stock rail) Frog
Speed, km/h
40 50 60 correlation
coefficient 40 50 60
correlation coefficient Horizontal
transversal accelerations
ms
F 2 2.7 3.8
1.00
1.7 2 2.5
0.93
P 1.82 2.39 3.38 1.96 1.98 2.06
Vertical forces kN
F 152.2 171.5 184.5
0.87
167. 4
178. 6
188. 6
-1.00
P 172.9 171.3 185.7 170.
8
166. 4
162. 5 Horizontal
transversal forces kN
F 111.6 125.5 128.8
0.95 - - -
P 93.4 98.5 93.2 51.8 53.3 62.2
Vertical bending mm F 4.1 4.5 4.8 0.82 3.9 4.7 5.2 -0.92
P 1.6 1.6 1.7 1.6 1.5 1.5
Displacement of
rail head mm
F 3.9 4.1 4.5
0.98 3.1 3.5 3.8 0.82
P 2.9 3.1 3.3 2 2 2.3
Notes: Here and below: F – experimental, P – predictions using models of underframe–rail models.
Table 2. Coefficients of correlation between predictions and field scale values of dynamic parameters for empty loaded open freight wagon
Measured parameter
Unit s
Prediction method
Railroad switch (including front offset
of stock rail) Frog
Speed, km/h
40 50 60 correlation
coefficient 40 50 60
correlation coefficient Horizontal
transversal accelerations
ms
F 2.20 2.80 4.20
0.96
2.00 3.00 3.20
0.96
P 2.09 2.86 3.52 1.12 1.38 1.58
Vertical forces kN F 56.80 61.20 66.50 1.00 65.3
0
67.3 0
71.3
International Journal of Innovative Technology and Exploring Engineering (IJITEE) ISSN: 2278-3075, Volume-8 Issue-7, May, 2019
P 46.70 48.60 51.20 43.7
0
46.3 0
48.2 0
Horizontal
transversal forces kN
F 41.20 41.70 42.20
0.99
- - -
P 26.70 29.50 34.10 21.5
0
28.8 0
30.7 0
Vertical bending mm F 3.90 4.80 5.10 0.96 2.90 3.70 4.10 0.98
P 0.42 0.44 0.46 0.40 0.42 0.44
Displacement of
rail head mm
F 2.90 3.10 3.50
1.00 2.90 3.20 3.40 0.98
[image:3.595.43.560.199.437.2]P 1.07 1.17 1.35 1.19 1.40 1.70
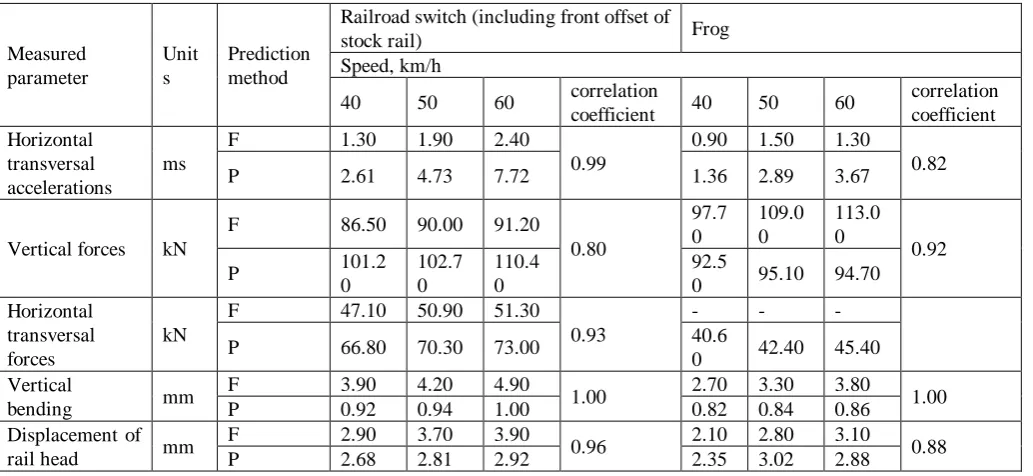
Table 3. Coefficients of correlation between predictions and field scale values of dynamic parameters for passenger wagon
Measured parameter
Unit s
Prediction method
Railroad switch (including front offset of
stock rail) Frog
Speed, km/h
40 50 60 correlation
coefficient 40 50 60
correlation coefficient Horizontal
transversal accelerations
ms
F 1.30 1.90 2.40
0.99
0.90 1.50 1.30
0.82
P 2.61 4.73 7.72 1.36 2.89 3.67
Vertical forces kN
F 86.50 90.00 91.20
0.80
97.7 0
109.0 0
113.0 0
0.92
P 101.2
0
102.7 0
110.4 0
92.5
0 95.10 94.70
Horizontal transversal forces
kN
F 47.10 50.90 51.30
0.93
- - -
P 66.80 70.30 73.00 40.6
0 42.40 45.40
Vertical
bending mm
F 3.90 4.20 4.90
1.00 2.70 3.30 3.80 1.00
P 0.92 0.94 1.00 0.82 0.84 0.86
Displacement of
rail head mm
F 2.90 3.70 3.90
0.96 2.10 2.80 3.10 0.88
[image:3.595.41.561.471.632.2]P 2.68 2.81 2.92 2.35 3.02 2.88
Table 4. Correction factors for various types of rolling stock and areas of railroad switches
Measured parameter
Wagons Freight
Loaded Empty
Railroad switch
(including front offset of stock rail)
Switching curve
Frog and turnout sections
Railroad switch
(including front offset of stock rail)
Switching
curve Frog
Horizontal transversal accelerations
1.41 1.47 1.82 1.38 1.42 1.57
Vertical forces 0.95 0.91 1.12 1.23 1.14 1.38
Horizontal
transversal forces 1.76 1.48 1.25 2.12 2.02 2.15
Analysis of kinematics of underframe motion along the considered combination of various layout of railroad switches is given below. The analysis considers the mutual position of turnouts, existence (absence) of straight rail plugs of various length, underframe base dimensions. The analysis accounted for the main kinematic properties considered at design stage of turnouts and determination of motion speeds:
unbalanced acceleration upon motion along curve
While determining motion speeds along combinations of turnouts, it would be more reasonable to apply the second model. One of the determining variables in this case is variation rate of acceleration [3].
In the case of combination of railroad switches with diverse position of turnouts, three different variants of motion are possible depending on the length of straight rail plug between switch curves f and underframe base b. The straight rail plug can be lower than the underframe base b > f, equal to it b = f and higher than the underframe base b < .
The variation rate of unbalanced acceleration Ψ is determined as derivative of acceleration variation with respect to time Ψ = da/dt.
If the radii of the first and the second curve switches are R1 and R2, respectively, then, according to [3], at b > f the allowable motion speed, depending on the norm of variation rate of acceleration, will be:
V = R1· R2· ( b + f )/ (R1+R2),
and at b ≤ f
V = R · b. The predicted motion speeds along the considered type of combinations of switches at various lengths of straight rail plug between curve switches are summarized in Table 5.
Table 5. Motion speeds along railroad switches, model 1/11, with the front joint of stock rail positioned near the joint of other switch and with diverse lateral turnouts (based on requirements to motion kinematics)
Straight rail plug, m Speeds, km/h Between
front joints
Between point rails
Passenge r all-steel wagon (base: 17 m)
Open freight wagon (base 8.65 m)
Short-base hopper wagon (base: 6.65 m)
0 2× 1.785 47 40 38
0 2× 2.765 48 42 41
4.50 10.03 49 46** 42**
6.25 11.78 50* 46** 42**
8.50 14.03 50* 46** 42**
12.50 18.03 50* 46** 42**
* - restriction with regard to design speed of railroad switch ** - restriction is related with geometry of railroad switch
As follows from Table 5, the motion speeds of the considered underframes along this type of combination of
railroad switches according to kinematic requirements are restricted when there are no straight rail plugs between railroad switches and when the lengths of straight rail plugs between turnouts are less than 6.25 m. In other cases, the restrictions are relegated with underframe passing along the switch and do not depend on the operation of railroad switch as the combination component.
In the case of straight rail plugs between the front joints of railroad switches with length of 6.25 m and higher, the allowable speed on the basis of kinematic requirements for passenger wagons equals to design speed along turnout of railroad switch: 50 km/h. For other underframes the speed is determined by conditions of passage of the given underframe type along the railroad switch itself.
For the combinations with straight rail plugs lower than 6.25 m and at wagon base lower than 8.65 m, the motions speeds according to kinematic requirements should not exceed the values summarized in Table 5.
The requirements of kinematic criteria and restriction with regard to dynamics criteria of interaction between the track and rolling stock upon motion along the segments with combination of railroad switches are obligatory restrictions. These requirements are necessary but not sufficient. While determining motion speeds, the requirements to strength of track elements should be also considered.
On the basis of analysis of predictions according to the performances of dynamic strength and kinematic properties of interaction between underframe and track upon its motion along various combinations of railroad switch layout, the recommended motion speeds were determined for various types of rolling stock (loaded open freight wagon, loaded hopper wagon, passenger wagon). The criteria (including criteria of strength of track elements) were adopted according to valid regulations for Russian railroads.
The recommended motion speeds are summarized in Table 6.
Using the described procedure, the variants of determination of motion speeds along other existing combinations of railroad switches were proposed.
At present the developed recommendations are at the stage of operational verification.
Table 6. Recommended motion speeds along railroad switches, type R65, model 1/11, with the front joint of stock rail positioned near the joint of other switch and with diverse lateral turnouts
Layout of railroad
switches
Calculated speeds for various types of rolling stock with consideration for restricting variables of underframe and track, km/h
International Journal of Innovative Technology and Exploring Engineering (IJITEE) ISSN: 2278-3075, Volume-8 Issue-7, May, 2019
Passenge r
Open freight wagon
Short-base hopper wagon
Passenge r
Open freight wagon
Short-base hopper wagon without straight rail plug
with front offset 1.785 m; 47 40 38 45 42 39
without straight rail plug
with front offset 2.765 m; 47 42 41 44 43 41
straight rail plug 4.50 m; 49 46 42 43 43 39
straight rail plug 6.25 m; 50 46 42 49 47 43
straight rail plug 8.50 m; 50 46 42 52 47 43
straight rail plug 12.50 m 50 46 42 53 48 42
* nominator: speed which can be recommended only on the basis of operational verification testing
IV. CONCLUSION
Operational tests should be used for determination of combination of railroad switches under conditions of higher motion speeds, accumulated deteriorations should be analyzed, and maintenance standards for track segments with combinations of railroad switches should be verified.
REFERENCES
1. D.Yu. Pogorelov, “Komp'yuternoe modelirovanie dinamiki rel'sovykh ekipazhei” [Computer aided simulation of dynamics of railroad underframes], Rostov-on-Don, Proceedings, International congress "Mechanics and tribology of transporation systems–2003", in two volumes, Vol. 2, 2003, pp. 226-232.
2. G.S. Mikhal'chenko, D.Yu. Pogorelov, V.A. Simonov, “Sovershenstvovanie dinamicheskikh kachestv podvizhnogo sostava zheleznykh dorog sredstvami komp'yuternogo modelirovaniya” [Improvement of dynamic properties of railroad rolling stock using computer aided simulation], Tyazheloe mashinostroenie, 12, 2003, pp. 2-6.