5Copyright © 2012 CTTS.IN, All right reserved
Texture Segmentation by using Haar Wavelets and K-means
Algorithm
P. Ashok Babu
Associate Professor, Narsimha Reddy Engineering College, Hyderabad, A.P., INDIA, [email protected]
Dr. K. V. S. V. R. Prasad
Professor & HOD, D.M.S.S.V.H .College of Engineering, Machilipatnam, A.P., INDIA, [email protected]
Abstract - In this paper we focus on image segmentation by proposing a new algorithm based on Haar wavelet decomposition and K- means algorithm. When Haar wavelet decomposition is applied to an image it gives an idea about high frequency components. If higher levels of decomposition are performed, different texture region information can be captured. The paper deals with the texture segmentation of an image and to find the different types of textures present in an image and compares the results with Gabor filter and circular Gabor filter. The proposed Algorithm gives better results compared to other techniques.
Keywords - GEF- Gabor Elementary Function, CGF-Circular Gabor Filter, DFT-Discrete Fourier Transform, Haar wavelet, K-means algorithm.
1. I
NTRODUCTIONSegmentation firstly designate the partitioning a digital image into different parts or objects regions corresponding to individual surfaces, objects, or natural parts of objects [1]. It is the course of action of labeling and grouping each pixel and identifying the analogous regions or the group of pixels sharing some visual characteristics. Ideally each such region could be patterns or objects in the image. Image segmentation is repeatedly characterized as the process that subdivides an image into its fundamental parts and extracts those parts of interest (objects).segmentation results will affect all the successive processes of image analysis, such as feature measurement, object representation and description and even the following higher level tasks such as object classification and scene interpretation therefore it is one of the most critical tasks in automatic image analysis [2]. 1.1. Texture Segmentation
A standard definition of texture is “one or more basic
local patterns that are repeated in a periodic manner”.
Texture Segmentation incorporates segmenting or partitioning an image into various regions of repetitive patterns or textures with preciseness. The Objective of texture segmentation is to group regions with similar textures which might belong to the same class of objects or same objects. The process is accomplished using the filter-bank model which uses a set of linear image filters operating in alongside to decompose or divide an input image into several output images. These filters are primarily designed such that they simultaneously focus on a particular range of frequencies and on local spatial
interactions that gives rise to the new concept of joint spatial/space-frequency decomposition [3].
1.2. Wavelet based Texture Segmentation
Texture analysis is considered to be an essential part of many tasks such as image processing, shape determination etc. The technique called wavelet transform has been taken as a part of this project which is helpful to extract features correlate with individual pixels. The Haar transform has been used as a basic tool in the wavelet transform for feature extraction and image decomposition. Decomposition matrices are used for feature extraction using Haar transform. The specific features like energy, contrast etc can be used after the Haar wavelet decomposition. Some of the segmentation
methods such as “Thresholding” are used to detect
boundaries between regions based on the discontinuity of gray scale. Region growing is referred as wavelet based image segmentation method which is based on seed points.
2. G
ABORF
ILTERGabor filter is a linear filter whose impulse response is defined by a Gaussian function multiplied by a harmonic function. It is optimally confined as per the uncertainty principle in both the frequency and special domain i.e.
∆x.∆ω being close to h, the metric of uncertainty. This
implies that Gabor filters are highly Selective in both frequency and position, thus resulting in sharper texture boundary detection. Segmentation paradigm related to Gabor filter is based on filter bank model in which several filters are applied synchronously to an input image. The filters focus on particular range of frequencies. If an input image contains two different texture areas, the local frequency differences between the areas will detect the textures in one or more filter output sub-images. Gabor Elementary functions (GEFs) can perform joint space decomposition. Each Gabor filters is specified by GEFs. Because of their good spatial and spatial-frequency localization Gabor filters are extensively used for texture segmentation.
2.1.GEF’s and Gabor Filter
A brief overview of Gabor Elementary Functions (GEF’s) and Gabor Filters are given below. GEF’s were first
defined by Gabor and later extended to 2-D by Daugman. A GEF is given by [4].
H (x, y) =g (x', y’) exp [j2π (Ux+Vy)] ………..(1)
5Copyright © 2012 CTTS.IN, All right reserved represent rotated spatial domain rectilinear coordinates.
Letting (u, v) denote frequency-domain rectilinear coordinated, (U, V) represents a particular 2-D frequency. The complex exponential is a 2-D complex sinusoid at frequency
F=√ (U2+V2) and θ =tan-1(V/U) indicates the orientation of the sinusoid. The function g(x, y) is the 2-D Gaussian. It is given as,
g(x,y) = (1/2π σx σy)exp{-1/2[(x/σx)2+(y/σy)2]}…….(2)
Where σx and σy characterize the spatial extent and
bandwidth of the filter respectively. Thus, the GEF is a Gaussian that is modulated by a complex sinusoid. It can be shown that the Fourier transform of h(x, y) is
H (u,v)=exP{-1/2[(σx[u-U]')2+(σy [v-V]')2]} …….(3) Where [(u-U)', (v-V)'] = [(u-U) cos θ + (v-V) sin θ,-(u-U)
sin θ + (v-V) cos θ]
Thus, from (3), the GEF's frequency response has the shape of a Gaussian. The Gaussian's major and minor axis
widths are determined by σx and σy , it is rotated by an angle with respect to the positive u-axis, and is centered about the frequency (U,V) . Thus, the GEF acts as a band
pass filter. In most cases, letting σx = σy = σ is a reasonable design choice. If it is assumed that σx = σy = σ, then, the parameter θ is not needed and the equation (1)
of GEF becomes
H(x,y)=(1/2πσ2)exp{-(x2+y2/2σ2)}exp[j2π(Ux+Vy)…(4) We now define the Gabor filter by equation
M(x,y) = Oh(i(x,y)) = [i(x, y)*h(x, y )] ………..(5) Where m is the output and i is the image.
2.2 Circular Gabor Filter
Gabor filter is a powerful tool in texture analysis. Traditional Gabor function (TGF) is a Gaussian function Modulated by an oriented complex sinusoidal signal. It is mathematically given by
G(x, y)=g(x y)*exp(2πjF(xcos(θ)+ysin(θ))) ………...(6)
Here g(x, y) = (1/ 2πσ2) * exp (-(x2+y2)/2σ2) (it is
assumed that g(x, y) is isotropic). The parameters f & θ
represent the frequency and the orientation of the sinusoidal signal respectively. g(x,y) is the Gaussian
function with scale parameter σ , f , θ , and σ which constitute the parameter space of Gabor filters where θ
lies within the interval [0°-360°]. Gabor filters have many advantages over the Fourier transform. It can achieve the optimal location in both the frequency and spacial domain.
The main advantage of traditional Gabor filters implies that these filters are very instrumental in the detection of texture direction. The orientation of texture becomes less important in rotation invariant texture analysis. Thus traditional Gabor filters are less suitable for this purpose. The sinusoidal grating of the TGF varies in one direction. If the sinusoidal varies in all orientations, it is circular symmetric. This result in a new version of Gabor filter called Circular Gabor filter (CGF). The circular Gabor filter is defined as follows,
G(x, y) =g(x, y) exp (2πjF (√(x2+y2)) ………… (7) Where F is central frequency of the circular Gabor filter.
3. T
EXTURES
EGMENTATIONIn order to recognize the textures, the texture features are calculated from the filtered image as given in the following [5],[6].
Ψ(x, y) = r2(x, y)⊗m (x, y)
r2(x, y) represents the energy of the filtered image and⊗ shows the convolution .m (x, y) is the mask to obtain texture segments. Finer texture measurements can be detected by Mask windows of minute size. Here a Gaussian window can be used to local texture energy. Pattern clustering algorithm is required to identify the regions.
3.1. Invariant Texture Segmentation algorithm using Circular Gabor filter
In Circular Gabor filter first read the image and perform validations on filtering parameters. Perform segmentation for each case and find the impulse response of rotation invariant circular Gabor filter. Now perform the texture segmentation by using convolution with Gabor filter. Find the energy of each pixel position and perform convolution with mask window. Now perform non linear mapping.
1) First select the value of F.
2) To convert the image into a 2-D matrix.
3) Compute the impulse response of the filter by the following formula given below,
G(x, y) = g(x, y) ∗ exp (2πjF (x Cos (θ) + y Sin (θ)) where g(x, y) = (1/2πσ2) * exp (- (x2+y2)/2σ2)
4) The filtered output r (x, y) can be calculated by passing the input image through the filter whose impulse response is obtained in Step3.
5) Calculate the energy of the filtered image E = r2(x, y) 6)The output image is obtained by the equation φ(x, y) =
E⊗m(x, y) Where m(x, y) is the mask window.
The window size is calculated by its standard deviation
σs, whose value is chosen as σs = 2σ. So m(x, y) = (1/
8πσ2)*exp (- ((n12+n22)/4σ2))
7) Finally obtain the output image Ψ(x, y).
3.2.Proposed Algorithm 1) Read the image
2) Map the pixel data to [0 1] and get the image size M*N
3) Use haar wavelet decomposition in horizontal and vertical directions to get the different sub bands of size M/2*N/2 and then perform haar wavelet decomposition on LL band (obtained from first level of decomposition) to get sub-bands of size M/4*N/4.
4) Initialize segments to zero. 5) For each 4*4 block ,
Form a feature vector with the following o Absolute value of a sub-band
coefficient in level2 band
o Average values of absolute values of 2*2 block of sub-band coefficients in level1 band
5Copyright © 2012 CTTS.IN, All right reserved 6) Perform K-means algorithm on above energy values
with 2 clusters. The cluster with higher energy corresponds to high frequency regions.
7) Now perform Gaussian mask on frequency map of the image to remove any outliers present
8) Perform non-linear mapping on above obtained image to stress more on high frequency regions
4. R
ESULTS ANDD
ISCUSSIONFig.1(a)
Fig.1(b)
0 0.1 0.2 0.3 0.4 0.5 0.6 0.7 0.8 0.9 1 0
0.1 0.2 0.3 0.4 0.5 0.6 0.7 0.8 0.9 1
W avelet coefficient m ap
M
ap
pe
d
pi
xe
l v
al
ue
Fig.1(c)
Fig.1.Results for monarch-elevator using proposed algorithm: (a) is input, (b) is out put (c) is non-linear
mapping curve.
Fig.2(a)
Fig.2(b)
0 0.1 0.2 0.3 0.4 0.5 0.6 0.7 0.8 0.9 1 -0.8
-0.6 -0.4 -0.2 0 0.2 0.4 0.6 0.8
Gabor filtered data
M
ap
pe
d
pi
xe
l v
al
ue
Fig.2(c)
Fig.2.Results for monarch-elevator using Circular Gabor filter algorithm:(a) input, (b)output (c) non-linear
5Copyright © 2012 CTTS.IN, All right reserved Fig 3(a)
Fig.3(b)
0 0.1 0.2 0.3 0.4 0.5 0.6 0.7 0.8 0.9 1 0
0.1 0.2 0.3 0.4 0.5 0.6 0.7 0.8 0.9 1
W avelet coefficient m ap
M
ap
pe
d
pi
xe
l v
al
ue
Fig. 3(c)
Fig.3.Results for Wall using proposed algorithm: (a) input,(b) is out put (c) is non-linear mapping curve.
Fig.4(a)
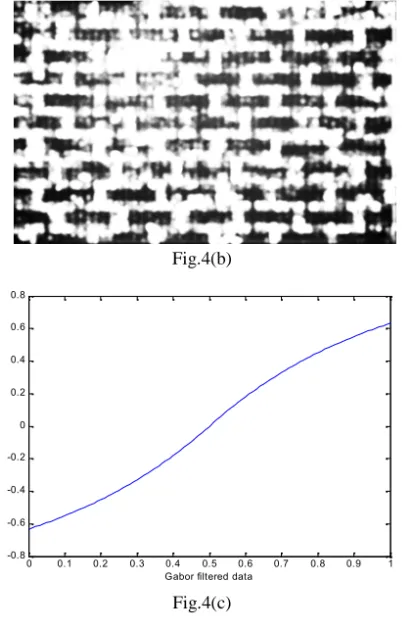
Fig.4(b)
0 0.1 0.2 0.3 0.4 0.5 0.6 0.7 0.8 0.9 1 -0.8
-0.6 -0.4 -0.2 0 0.2 0.4 0.6 0.8
Gabor filtered data
M
ap
pe
d
pi
xe
l v
al
ue
Fig.4(c)
Fig.4.Results for Wall using Circular Gabor filter algorithm: (a) is input, (b) is out put (c) is non-linear
mapping curve
Figure 1 is the input, output and non linear mapping curve of monarch elevator using proposed algorithm. Fig 2 is the input, output and non linear mapping curve of monarch elevator using circular Gabor filter algorithm. Figure 3 is the input, output and non linear mapping curve of wall using proposed algorithm. Figure 4 is the input, output and non linear mapping curve of wall using circular Gabor filter algorithm .If we observe the outputs the proposed algorithm will gives the best results compared to remaining algorithms.
5. C
ONCLUSIONThe energy can be calculated even on higher levels of decomposition for energy calculation. Also morphological operations can be performed on the output images to remove any outliers present. We can design a novel algorithm on texture segmentation using multi-resolution analysis.
6. R
EFERENCES[1] A.D. Jepsonand D.J. Fleet, “Image Segmentation” ,
Internet Draft 2007.
5Copyright © 2012 CTTS.IN, All right reserved Beijing, IRM Press, 2006.
[3] Dennis Dunn, William E. Higgins, and Joseph Wakeley, Texture segmentation Using 2-D Gabor Elementary Functions, IEEE Transactions on Pattern Analysis and Machine Intelligence, VOL.16. NO. 2, February 1994: pp. 130-149. [4] R. Baliarsingh and G. Jena, “Gabor Function: An
Efficient Tool for Digital Image Processing” Dep’t.
Of IT, SRKR, JNTU, Intl. Conf, Current Trends of IT, pp 98-101, Oct. 2005.
[5] Jainguo Zhang, Tieniu Tan, Li Ma, “Invariant Texture Segmentation Via Circular Gabor Filters”
1051- 4651/02 $17.00 (c) 2002 IEEE.
[6] P.S.Hiremath, S.Shivashankar, “Wavelet based