International Journal of Innovative Technology and Exploring Engineering (IJITEE) ISSN: 2278-3075,Volume-8 Issue-8S2, June 2019
Abstract: In this paper, we propose the fingerprint-based DIFFERENCE-MEANS algorithm (FBDMA) to improve the processing speed and the positioning accuracy in an indoor wireless-fidelity (Wi-Fi) environment. We have applied three design philosophies in the proposed algorithm: the consideration of volume of reference point (RP) in building up signals map, the increase of positioning accuracy by minimum Wi-Fi AP usage, and the increase of positioning accuracy in real-time processing. The architecture of the proposed algorithm consists of two steps: the fingerprint learning step and the indoor positioning step.
The main performance metrics in the proposed algorithm are defined as the ratio of successful positioning, the error distances, and the measuring time. The results of the proposed algorithm are summarized as follows: 1) The average ratio of successful positioning in all 24 RPs in the proposed positioning algorithm is measured to 95.8%. This is higher than the 92.7% accuracy achieved by the fingerprint-based algorithm (FBA) and the 80.2% by the fingerprint-based Gaussian-distribution algorithm (FBGA). 2) The average distance of measured errors of the proposed FBDMA is 0.95m; it is less than FBA’s 1.52m and 1.63m of FBGA. 3) The average measuring time of the proposed algorithm is reduced by over 52.3% when compared with FBA and FBGA.
In the future, we will upgrade the proposed algorithm that estimates the user trajectory moving continuously in the RPs of a more extended indoor environment, based on this paper, and confirm the predefined performance metrics.
Index Terms: DIFFERENCE-MEANS, Fingerprint, Indoor Navigation,Positioning, Wi-Fi.
I. INTRODUCTION
Since 2000, the computing era has emerged in all societies and industries in the world, according to the commercial supplies of mobile devices such as smartphones and tablet personal computers (PC). Furthermore, the spread of the Internet of things (IoT) has been dynamically growing in entire industrial fields. The concept of IoT is to share information with each other and to form relationships by connecting people to people, things to things, and things to people on the network. At present, the demands of the positioning service, which is one of the most popular services of IoT, have been rapidly growing, and research and development of the service is universally very active[1]-[4].The global navigation satellite systems (GNSS) cannot be operated for positioning services in an indoor environment due to extremely low signal strength, even
Revised Manuscript Received on May 23, 2019.
Dong Myung Lee, Dept. of Computer Engineering, Tongmyong University, Busan, Republic of Korea.
Tae-Wan Kim, Dept. of Computer Engineering, Tongmyong University, Busan, Republic of Korea.
though it is an indispensable for positioning services in our life[3]. For that reason, the wireless personal area network (WPAN) such as Bluetooth, Zigbee, wireless-fidelity (Wi-Fi), ultra-wide band (UWB), and inertial navigation systems (INS) has been considered for developing indoor positioning system. In particular, indoor positioning services using Wi-Fi is the strong alternative because of rapid commercial provisions in hot-spots regions.
Positioning using Wi-Fi is divided into trilateration and fingerprint schemes. The trilateration scheme estimates the user location in advance by collecting the received signal strength indicator (RSSI) from three Wi-Fi access points (AP), and calculating the coordinates of the user location by the intersection of the three estimated distances obtained from RSSI values. However, this scheme has problems for achieving an accurate positioning due to specific environmental factors such as building structures, the amount of people in motion, temperature, humidity, and signal interference. On the contrary, the fingerprint scheme estimates the user location by a radio signal strength map that has been already built, and the accuracy of this scheme is higher than the trilateration scheme. However, the fingerprint scheme also has problems for achieving an accurate positioning due to the same environmental factors affecting the trilateration scheme[5]-[14].
In this paper, we proposed the fingerprint-based DIFFERENCE-MEANS algorithm (FBDMA) to improve the processing speed and the positioning accuracy in an indoor Wi-Fi environment. We have applied three design philosophies in the proposed algorithm: the proper volume of reference point (RP) in fingerprint building, the increasing of positioning accuracy by reducing Wi-Fi AP usage and supporting real-time processing.The proposed algorithm is basically presented first in [15], and its performance has been proven in a test scenario. However, in this paper, we have set up additional test scenarios and analyzed their performance to demonstrate more objective performance.
II. SYSTEMDESIGNPHILOSOPHIES
A. Volume of RP in Fingerprint Building
The general problem in the fingerprint map building is to define the proper volume of the RP for increasing of the positioning accuracy in the measuring region. Thus, the experimentation layout to define the optimal volume of the RPs between 1m (RP A) and 2m (RP B) volume is executed using three Wi-Fi APs in 6m × 4m spaces.The experiments on two types of RPs volume in the above layout using the fingerprint scheme was
executed by 50 trials. As a result, the average of error distances of the small
Fingerprint-based Difference-Means Algorithm
for Indoor Positioning in Wi-Fi Environment
volume of the RP is lower than that of the large volume of the RP because the size of error distance is strongly dependent on the volume of the RP. That is to say, the average of error distances can be found to be the amount of the assigned volume of the RP.
However, the ratio of successful positioning on the small volume is lower than that of the large volume of the RP because the number of positioning failures on the small volume are much more than that on the large volume.The size of error distance is proportional to the volume of the RP, and the errors are included within the maximum volume of the RP because the received signal strength from the AP includes errors by some path-loss related factors, and the fingerprint scheme is based on probability.
According to the results, we considered the volume of RP to 1m because the error distance is more important than the ratio of successful positioning even though the ratio of successful positioning on 1m is lower than that on 2m.
B. Wi-Fi AP Usage and Real-time Processing
Only three Wi-Fi APs are optimally used in order to detect the left/right space and user movement for improvement of positioning accuracy. In addition to this, Wi-Fi APs on dual frequencies (2.4GHz, 5GHz) are installed in the indoor environment.Therefore, only three Wi-Fi APs are optimally used in order to detect the left/right space and user movement for improvement of positioning accuracy. In addition to this, Wi-Fi APs on dual frequencies are installed in the indoor environment.If the volume of the RP is smaller, more numbers of RPs are required, and this causes an overload of the real-time processing.
In addition to this, if the positioning algorithm is designed to be a light-weighted structure not having full or heavy functions in order to increase the positioning processing speed, the positioning accuracy of the algorithm may be decreased. Moreover, we have seen that the ratio of successful positioning on the small volume of the RP is low. Based on this, we have considered the positioning algorithm that reflects the increase of positioning accuracy and the realization of real-time processing functions[16-18].
III. FINGERPRINT-BASED DIFFERENCE-MEANSALGORITHM
In the design of the positioning system using the DIFFERENCE-MEANS algorithm, the volume of RPs is determined to be 1m, according to the conclusion found in Section 3.1. In order to enhance the positioning accuracy and the average of error distance the ratio of a successful positioning is lower than the 2m case. The proposed positioning algorithm consists of two steps: the fingerprint learning step, and the indoor positioning step. The Wi-Fi information: SSID and RSSI is collected, and the received signal strength map database is built using three APs having dual frequencies.The fingerprint learning step is collected by Wi-Fi information using Wi-Fi APs on dual frequencies and built by radio signal map databases. The positioning limitation of various environments is overcome and the positioning accuracy is increased in the measured location. After launching these processes, the FBDMA is proposed, using the difference between the average value of signal
strength in the map database and the current measured signal strength, in order to improve the positioning accuracy and processing speed.
A. Architecture of Proposed Algorithm
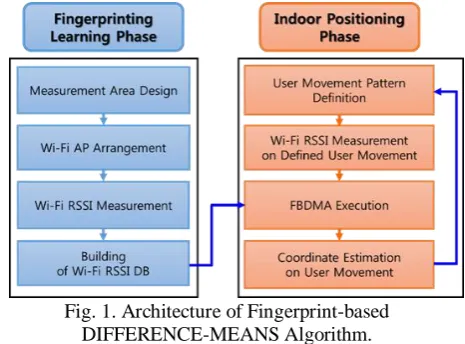
[image:2.595.313.546.263.435.2]The architecture of the proposed algorithm consists of two steps: the fingerprint learning step, and the indoor positioning step as shown in Fig. 1. In the fingerprint learning step, the design of the measurement area, the design of the Wi-Fi AP arrangement, the Wi-Fi information measuring, and the building of the Wi-Fi signal strength map database are sequentially executed. In the indoor positioning step, the user movement to the region for signal strength measuring, the Wi-Fi information measuring, the execution of the FBDMA, and the provision of positioning service are then executed the fingerprint learning step completes[15].
Fig. 1. Architecture of Fingerprint-based DIFFERENCE-MEANS Algorithm.
B. Fingerprint Learning and Indoor Positioning Steps
The whole space of experimental region is divided into 24 RPs that are connected with a 1m interval in a 6m × 4m indoor room. All RPs are indicated from A to X and three APs for Wi-Fi connection are arranged in the region as a triangular formation for detecting of left, right, and the movement of the mobile device.The Wi-Fi information, SSID and RSSI in each RP, is collected by n times in an AP that has dual frequencies (AP 1-3: 2.4GHz, AP' 1-3: 5GHz). The fingerprint map based on Wi-Fi information measuring indicates the average RSSI data measured in each RP, and it can be expressed by Eq. (1), where i is the position of each RP, j is the number of APs in each RP, and k is the number of RSSIs measured in the assigned AP of each RP, respectively.
𝐴𝑉𝑅_𝑅𝑆𝑆𝐼_𝑅𝑃(𝑖, 𝑗)_𝑀𝐴𝑃 = 𝑛 𝑅𝑆𝑆𝐼_𝑅𝑃(𝑖, 𝑗, 𝑘)
𝑘=1 (1)
The indoor positioning step in the proposed FBDMA is executed by Eq. (2). The 𝐷𝐼𝐹𝐹_𝑀𝐸𝐴𝑁𝑆 is a value of the DIFFERENCE-MEANS to be obtained in the current RP. In Eq. (2), n is Wi-Fi signal number, i is a RPindex in the fingerprint map, the 𝐴𝑉𝑅_𝑅𝑆𝑆𝐼_𝑅𝑃(𝑖, 𝑗)_𝑀𝐴𝑃 is an average RSSI value of jth AP in the ith RP of the fingerprint map, and 𝑅𝑆𝑆𝐼 𝑗 is the jth measured
RSSI value.
International Journal of Innovative Technology and Exploring Engineering (IJITEE) ISSN: 2278-3075,Volume-8 Issue-8S2, June 2019
𝑀𝐼𝑁 𝑛 𝐴𝑉𝑅_𝑅𝑆𝑆𝐼_𝑅𝑃(𝑖, 𝑗)_𝑀𝐴𝑃 − 𝑅𝑆𝑆𝐼(𝑗)
𝑗 =1
(2)
IV. EXPERIMENTANDPERFORMANCEANAYSIS
A. Experimental Environment
All the information is measured by the SAMSUNG Galaxy Note 4 S-LTE-based on the Exynos 5433 Octa-Core 1.9GHz + 1.3GHz CPU, 3GB memory, and Android API 21 of the Android Lollipop 5.0.1 OS. The performance analysis of experimental data, generated by the proposed algorithm, is run on a Windows 8.1 Professional x64 OS with an Intel Dual-Core 3GHz CPU and 6GB memory, and the performance analysis software developed in C# on .NET Framework 4.5 is executed on this hardware.
[image:3.595.332.521.50.200.2]The Wi-Fi information is collected at the indoor space of engineering building on university as shown in Fig. 2. The left picture of Fig. 2 shows the preparation for the signal measurement and the installation of APs on triple pole. In order to measure the signal accurately, the smart phone running the signal measuring software is put on the flat plate laid down triple pole. In addition, three APs on dual frequency bands are placed to 24 RPs, and the Wi-Fi information is measured and corrected in each RP by 1m in this indoor space as shown in the center and right pictures of Fig. 2
Fig. 2. Environment of Wi-Fi Information Measurement.
B. Test Scenario
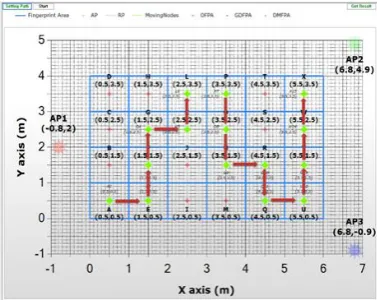
The test scenario of mobile device to analyze the proposed FBDMA algorithm in indoor space is defined by indicating RPs with „◆‟, and the experiments are executed continuously according to marking the line with „●‟ to indicate the forward direction as shown in Fig. 3. Therefore, the test scenario of
mobile device is finally set from
(A→E→F→G→K→L→P→O→N→R→Q→U→V→W→ X). The experiment is repeatedly executed by 100 trials under this scenario. The performance of the proposed FBDMA is then compared with that of the fingerprint based algorithm (FBA) and the fingerprint-based Gaussian-distribution algorithm (FBGA).
Fig. 3. Test Scenario for Estimation of Proposed Algorithm.
C. Experimental Results and Performance Analysis
1. Ratio of successful positioning
The ratio of successful positioning (𝑅𝑆𝑃𝑂)in each RP of the experimental spaces is defined by the ratio of a number of successful positioning trials (𝑅𝑁𝑆𝑃𝑇) over the total measured trials (𝑇𝑇𝑀), and it can be expressed by Eq. (3).
𝑅𝑆𝑃𝑂=
𝑅𝑁𝑆𝑃𝑇
𝑇𝑇𝑀 ∗ 100
(3)
[image:3.595.52.289.386.452.2]The average ratio of successful positioning in 24 RPs of the proposed positioning algorithm based on indoor Wi-Fi environment is compared with each other in Fig. 4. It can be seen that the average ratio of successful positioning of the proposed FBDMA is measured to 95.8%. This is higher than the 92.7% accuracy of FBA and 80.2% of FBGA. In addition, the minimum ratio of successful positioning in all 24 RPs in the proposed positioning algorithm is measured to 84%, and this is higher than 79% of FBA and 39% of FBGA.
Fig. 4. Comparison with Average Ratio of Successful Positioning in RPs of Positioning Algorithms.
2. Error Distances
The error distance is defined as the distance of the errors in each RP, and these are expressed by Eq. (4) and (5), respectively. The average error distance (𝐴𝐸𝐷) can be calculated by averaging of the sum of the difference between the real location (𝑅𝐿𝑂𝐶) and the estimated location (𝐸𝐿𝑂𝐶) in each RP, based on the distance formula from point to point, as shown in Eq. (4). The maximum error distance (𝑀𝐸𝐷) is calculated in the same
manner as 𝐸𝑅𝑅_𝐷𝑆𝑇𝐸𝐴𝑉𝑅
[image:3.595.306.550.487.617.2]instead average value in Eq. (5).
𝐴𝐸𝐷 = 𝐴𝑉𝐸𝑅𝐴𝐺𝐸 𝑅𝐿𝑂𝐶− 𝐸𝐿𝑂𝐶 2
(4)
𝑀𝐸𝐷 = 𝑀𝐴𝑋 𝑅𝐿𝑂𝐶− 𝐸𝐿𝑂𝐶 2 (5)
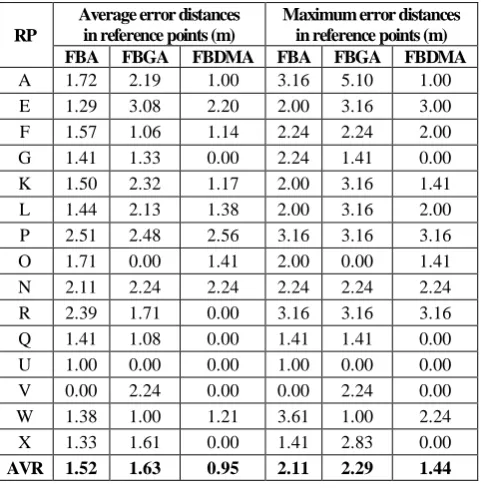
[image:4.595.305.550.84.188.2]As we see in Table 1, the average error distance of the proposed FBDMA are indicated to 0.95m, and it is less than the 1.52m of FBA and the 1.63m of FBGA. In addition, the maximum error distance of proposed FBDMA is 1.44m, and it too is less than the 2.11m of FBA and the 2.29m of FBGA. The largest error distance of proposed FBDMA is 3.16m, and it is less when compared with FBA and FBGA at 0.44m and 1.94m, respectively. However, the average error distance in RP P is measured to 2.56m, which is higher than the 2.51m of FBA and the 2.48m of FBGA. In spite of this, the average error distance of proposed FBDMA in RP P is measured to 95%. This is better in comparison with that of 94% of FBA and 83% of FBGA. As a result, the error distance in RP P would be decreased because the measured errors in FBA and FBGA are more than that of the FBDMA.
Table 1: Average/maximum Error Distances in RPs
3. Average measuring time
The average measuring time is the average running time of in each RP, and it can be expressed by Eq. (6). It is calculated by averaging the difference between the finishing time of algorithm execution (𝑇𝐹𝐼𝑁) and the starting time of algorithm execution (𝑇𝑆𝑅𝑇).
𝑇𝐴𝑉𝑅 = (𝑇𝐹𝐼𝑁 − 𝑇𝑆𝑅𝑇) (6)
The average measuring time in each RP of the positioning algorithm measured in the indoor environment are compared with each other in Fig. 5. The average measuring time of the proposed FBDMA is measured to 26.6ms, and it is much less than the 55.7ms of FBA and the 50.1ms of FBGA. It is confirmed that the proposed FBDMA achieved a savings of
[image:4.595.43.285.342.587.2]processing time by over 52.3% compared with FBA and FBGA.
Fig. 5. Comparison with Average Measuring Time in RPs of Positioning Algorithms.
V. CONCLUSION
In this paper, the FBDMA, in an indoor Wi-Fi environment, is proposed, in order to improve processing speed and positioning accuracy. In addition, the performance of the proposed FBDMA is also analyzed by comparing it with that of FA and FBGA using test scenario. The main performance metrics in the proposed algorithm are defined to the ratio of successful positioning, the positioning accuracy, and the average measuring time.
It can be noted that fingerprint and triangulation schemes have been widely used with indoor positioning fields for a long time. Although the fingerprint scheme is somewhat vulnerable to environmental conditions, it has traditionally been adopted to develop indoor positioning systems because it is better than the triangulation scheme in positioning accuracy.The key motivation behind the proposed fingerprint-based DIFFERENCE-MEANS algorithm is to mitigate the drawbacks of the traditional fingerprint scheme with regard to the following three system design philosophies: 1) considering the volume of the RP in fingerprint building; 2) increasing the positioning accuracy with minimal Wi-Fi AP usage; and 3) increasing positioning accuracy in real-time processing.
The performance of the proposed FBDMA algorithm can be summarized as follows: 1) Average ratio of successful positioning in all 24 RPs in the proposed FBDMA algorithm is measured to 95.8%. This is higher than the 92.7% of FA and the 80.2% of FBGA. The main point of the proposed FBDMA algorithm is that it has achieved the average ratio of successful positioning of 100% in three RPs (Q, V, X). 2) The average positioning accuracy of the proposed FBDMA is 0.95m, and it is less than FBA at 1.52m and the 1.63m of FBGA. In addition, the maximum positioning accuracy of the proposed FBDMA is 1.44m. This is also less than the 2.11m of FBA and the 2.29m of FBGA. 3) The proposed FBDMA achieved a minimum of 52.3% savings in processing time when compared with FBA and FBGA.
The major innovation of the proposed FBDMA compared with both FA and FBGA is that it enables the measuring speed to be lowered by simplifying the computation of the positioning algorithm, while simultaneously enhancing the positioning accuracy. Generally, the complexity of the positioning algorithm must
be increased in order to enhance the positioning accuracy, and this leads to
RP
Average error distances in reference points (m)
Maximum error distances in reference points (m) FBA FBGA FBDMA FBA FBGA FBDMA
A 1.72 2.19 1.00 3.16 5.10 1.00
E 1.29 3.08 2.20 2.00 3.16 3.00
F 1.57 1.06 1.14 2.24 2.24 2.00
G 1.41 1.33 0.00 2.24 1.41 0.00
K 1.50 2.32 1.17 2.00 3.16 1.41
L 1.44 2.13 1.38 2.00 3.16 2.00
P 2.51 2.48 2.56 3.16 3.16 3.16
O 1.71 0.00 1.41 2.00 0.00 1.41
N 2.11 2.24 2.24 2.24 2.24 2.24
R 2.39 1.71 0.00 3.16 3.16 3.16
Q 1.41 1.08 0.00 1.41 1.41 0.00
U 1.00 0.00 0.00 1.00 0.00 0.00
V 0.00 2.24 0.00 0.00 2.24 0.00
W 1.38 1.00 1.21 3.61 1.00 2.24
X 1.33 1.61 0.00 1.41 2.83 0.00
International Journal of Innovative Technology and Exploring Engineering (IJITEE) ISSN: 2278-3075,Volume-8 Issue-8S2, June 2019
increased measuring speed. However, the positioning accuracy can be improved if the positioning algorithm is simplified for real-time processing. In summary, the proposed FBDMA realized two performance objectives simultaneously: the enhancement of the positioning accuracy and the decrease of measuring speed for real-time positioning.The interval of the RPs is set to the 2m based on the system design philosophies in order to increase the positioning accuracy and to reduce the radio signal map and the signal measuring time. In the future, we will upgrade the proposed algorithm that estimates the trajectories for objects moving continuously in the RPs of extended indoor environment, based on this paper, and confirm the predefined performance metrics.
ACKNOWLEDGMENT
This work was supported by the BB21+ Project in 2019.
REFERENCES
1. M. Weiser, “The Computer for the 21st Century,” Scientific American, Sep. 1991, pp.94-104.
2. S. W. Lee and S. W. Kim, “Indoor Location Positioning Technology Trend and Outlook,” KICS Press, vol. 32, no. 2, Jan. 2015, pp.81-88. 3. H. Y. Kim, S. D. Kim, D. G. Suh, J. G. Jee, H. T. Jang, “Localization
and Tracking Technologies in Near Fields,” Weekly Technology Trends, Institute for Information Technology Advancement (IITA), Vol. 02-07, 2007, pp.1-13.
4. H. Y. Kim, “Internet of Things-Concept, Implementation Technologies and Business. Hongrung Publishing Company, Sep. 2014, pp.5-67. 5. M.I.Jee, et.al., “Development Trends of the Indoor Localization
Technology based on Wi-Fi,”Information and Communications Magazine, Korean Institute of Communications and Information Sciences (KICS), vol. 28, no. 7, Jun. 2011, pp.52-58.
6. L. Chen,B. Li,K. Zhao,C. Rizos,Z. Zheng, “An Improved Algorithm to Generate a Wi-Fi Fingerprint Database for Indoor Positioning,” Sensors (Basel). MDPI, 13(8), Aug. 2013, pp.11085–11096.
7. P. Jiang, Y. Zhang, W. Fu, H. Liu, X. Su, “Indoor Mobile Localization Based on Wi-Fi Fingerprint's Important Access Point,” International Journal of Distributed Sensor Network, Apr. 2015.
8. Y.E. Kim, H. J. Shin, Y. H. Chon, H. J. Cha, “Smartphone-based Wi-Fi tracking system exploiting the RSS peak to overcome the RSS variation problem,” Pervasive and Mobile Computing, vol. 9, Issue 3, Jun. 2013, pp.406-420.
9. C. Laoudias, R. Piché, C. G. Panayiotou,“Device Self-calibration in Location Systems using Signal Strength Histograms,” J. Location Based Services, vol. 7, no. 3, Aug. 2013, pp.165-181.
10. E. L. Lau, B. G. Lee, S. C. Lee, W. Y. Chung, “Enhanced RSSI-based high accuracy real-time user location tracking system for indoor and outdoor environments,” Smart Sensing and Intelligent Systems, vol. 1, No. 2, Jun. 2008, pp.534-548.
11. S. Y. Son, Y. J. Park, B. J. Kim, Y. J. Baek, “Wi-Fi Fingerprint location estimation system based on reliability,” J. Korean Institute of Communications and Information Sciences (KICS), vol. 38C, no. 6, Jun. 2013, pp.531-539.
12. I. Ha, Z. Zhang, H. Park, and C. Kim, “Analysis of Wi-Fi Signal Characteristics for Indoor Positioning Measurement,” J. KIICE, vol. 16, no. 10, Oct. 2012, pp. 2177-2184.
13.K. Kaemarungsi, P. Krishnamurthy, “Modeling of indoor positioning system based on location fingerprinting,” in Proc. of INFOCOM 2004, IEEE Computer and Communications Societies, vol. 2, Mar. 2004, pp.1012-1022.
14.T.N. Lin, P.C. Lin, “Performance comparison of indoor positioning techniques based on location fingerprinting in wireless networks,”in Proc. of IEEE Wireless Networks, Communications and Mobile Computing 2005, vol. 2, Jun. 2005, pp.1569-1574
15.D.M. Lee, T.W. Kim, “Development of the Indoor Localization System using Fingerprint-based Difference-Means Algorithm in Wi-Fi Environment,” In Proc. of 7thInternational Conference on Indoor
Positioning and Indoor Navigation (IPIN). Oct. 2016.
16. A. Hatami, K. Pahlavan, “Comparative statistical analysis of indoor positioning using empirical data and indoor radio channel models,” in Proc. of IEEE Consumer Communications and Networking Conference 2006 (CCNC 2006), vol. 2, Jan. 2006, pp.1018-1022.
17. I. H. Jeong, C. M. Kim, Y. S. Choi, S. B. Kim, and Y. Lee, “A study of Establishment on Radiomap that Utilizes the Mobile device Indoor Positioning DB based on Wi-Fi,” J. KOGSIS, vol. 22, no. 3, Sep. 2014, pp.57-69.
18. H. O. Oh, I. C. Kim, “WiFi location estimation in indoor environments using Gaussian processes,” J. of Korean Institute of Information Scientists and Engineers (KIISE), Korea Information Science Society, vol. 17, Issue. 10, Oct. 2011, pp.564-568.
AUTHORSPROFILE
Dong Myung LeeProf. Lee had received B.S., M.S., and Ph.D. in Dept. of Computer Science from Soongsil University, Seoul, Republic of Korea on 1982, 1988 and 1996, respectively. He had worked as a principal member of research staff at Electronics and Telecommunications Institute (ETRI) that located in Taejonduring 18 years. In ETRI, he had participated to some national projects for developing some systems that running various network protocols based on the OSI model during 1982-1988. After then, he had participated to the CDMA cellular system project, and had designed and implemented the call processing and handoff functions that are a key role at the Base Station in the CDMA cellular system during 1991-1998. He had also worked the fundamental researches for the 3rd
generation wireless system and joined a project to develop the IMT-2000 system during 1996-2000. In the year 2000, he had transferred to the Dept. of Computer Engineering in Tongmyong University in Busan, Republic of Korea. He has been teaching network related courses (computer network, network programming) in undergraduate school and some advanced courses in graduate school (mobile computing and high speed communication network) in Tongmyong University since 2000. He has been now working about the researches on sensor based localization algorithms with graduate school students by several projects.