International Journal of Innovative Technology and Exploring Engineering (IJITEE) ISSN: 2278-3075, Volume-8 Issue-7, May 2019
Estimation and Analysis of Highway Traffic
G. Poorani, G.Nivedhitha, S.Padmavathi
Abstract: Based on multivariate analysis, that directly counts and classifies vehicles. a number of the present algorithms are inaccurate in poor quality videos and additionally fail to extract the reliable options. Here, we tend to propose a regression formula, that is helpful even once the vehicle resolution is low and when there are severe occlusions. In our planned formula, there are 2 contributions, First, to observe the foreground segments, a deformation technique is developed, that contain unclassified vehicles. throughout the deformation method, there's some vehicle distortion, that is caused by foreshortening impact. A projective transformation and estimating and applying the heterogeneous mesh grid to scale back the vehicle distortion. Second, for every of the foreground segments, a group of low-level options is extracted and a cascaded regression approach is developed to count and classify the vehicles. Our planned regression primarily based formula are sturdy and correct, even in poor quality videos..
Keywords— Warping method, projective transformation, a nonuniform mesh grid, cascaded regression.
I. INTRODUCTION
To record the traffic data endlessly or perpetually, video cameras may well be used. it's to get any data of interest and to analyse the traffic videos in real time. in a very given period, the task is to count the vehicles, that is passing endlessly in highways and at the identical time classifies vehicles into completely different classes. on a selected road, the vehicle counts are to be done. A vision-based traffic analysis system might consists of
some elements like shadow removal, foreground
segmentation, pursuit and have extraction as in [1]. Across multiple image frames, if we have a tendency to extract the feature points robustly, then it's potential to fit express 2D/3D vehicle model as in [2],[3]. A 2nd vehicle shapes are distorted, which provides weak perspective projection. In our paper, the foreground segments are extracted and backgrounds are calculable and to notice the
foreground segments, a warp technique is
developed, that contain unclassified
vehicles. throughout the warp method, there's some
vehicle distortion, that is caused by foreshortening impact. A projective transformation and a heterogenous mesh grid are calculable and applied to scale back the vehicle distortion. for every of the foreground segments, a collection of low-level options is extracted and a cascaded regression approach is developed to count and classify the vehicles.
Revised Manuscript Received on May 07, 2019.
G. Poorani, Assistant. Professor, Department. of CSE, Sri Krishna
College of Technology, Coimbatore.
G.Nivedhitha, Assistant. Professor, Department. of CSE, Sri Krishna
College of Technology, Coimbatore.
S.Padmavathi, Assistant. Professor, Department. of CSE, Sri Krishna
College of Technology, Coimbatore.
A cascaded regression contains 3 completely
[image:1.595.351.514.184.341.2]different regressorsas mathematician method regression, co mmonplace Poisson regression, and Bayesian Poisson regression i.e., to classify vehicles into tiny, medium and enormous vehicles.
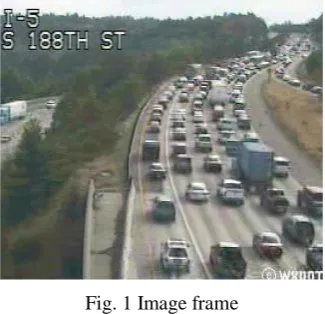
Fig. 1 Image frame
Fig. 1 Image frame shows that frame is converted from videos.
II. RELATEDWORK
The Vehicle count and Classification from a Traffic Scene is recommended by Pancharatnam .M, D.U.J. Sonnadara. Extracting the moving vehicles initial by applying the adaptive background subtraction technique and
by exploitation threshold and median
filters, characteristic the isolated image blobs because
the individual vehicles. Background
detection methodology, that uses average of pixels at intervals a variety of frames to sight the background as in [3]. Then Camera activity is meted out for the transformation of image coordinates to world coordinates as in [4]. In lane detection, establish the vehicles in every lane one by one. Categorizing the vehicles into 3 categories in keeping with the dimensions of vehicles like little, medium, large. Real Time Vehicle Detection and count methodology for unattended Traffic Video on Highways is recommended by Mrs. Daigavane P. M. and Dr. Bajaj. P.R. The Background Subtraction and Image Segmentation techniques are supported morphological transformation for pursuit and count vehicles in highways to develop theautomated detection and counting of vehicles on highways. Subtracting each image from the background scene, here frame is assumed as initial background and thresholding the ultimate difference image to work out the foreground image as in [5],[6]. Refine the vehicle sort and proper errors that are caused thanks to occlusions in
foreground detection. Traffic police
Meshram and A.V.Malviya. Vehicle count is performed by Background subtraction and finding the center of mass. Classification is finished by thresholding methodology. In most of the traffic police investigation systems, to estimate the required traffic parameters, a number of the main stages are used , i.e., vehicle detection, counting, tracking, and classification [7]. Thresholding techniques are usually accustomedsection pictures. whereas a
replacement object enters into the frame, it's detected by background subtraction. police work edges is that the method of characteristic and locating sharp discontinuities in a picture, that characterize boundaries of objects in an exceedingly scene [8], the amount of edge detection strategies like Prewett, Sobel, canny, Robert.
III.PROPOSEDSYSTEM
The formula consists of 4 steps, first, the backgrounds are being calculable and foreground are segmental. Second, the unclassified vehicles are detected. Third, the options are extracted and at last, the cascaded regression is employed to classify the vehicles into little, medium and enormous vehicles like sedan, SUV/mini-van and trucks.
A. Background Estimation and Foreground Segmentation
First, videos are born-again into frames and RGB is converted into grey scale pictures, then normalize the image with threshold pictures. for many vision-based systems background estimation may be a necessary pre-processing step. Backgrounds are calculable victimization the averaging methodology as in [9],[10]. The foreground image
is extracted from background pictures.
By victimization thresholds and morphological operations like (e.g., erosion and dilation), the foreground segments are extracted. Erosion is completed from the binary image, during which the irrelevant details are eliminated. Dilation is to extend the dimensions of the article from the binary image. To discover the foreground pixels, An adaptational multi-cue segmentation strategy is planned as in [11].
B. Detection of Unclassified Vehicles
The calculable background is taken. on the road direction, a sample tiny set of points are marked as dotted lane markers. Thin-plate splines are marked by activity its position and its distance. Between 2 consecutive points, the horizontal distances and therefore the vertical positions are calculated. The sampled points i.e., blue points are marked on the paved surface. on the road direction, the spline is fitted by vertical positions. The vertical axis is that the corresponding y coordinates and therefore the horizontal axis is the same because the variety of sampled points. Then, the spline fitted by the horizontal distances. The horizontal
distance is that the corresponding scaling
[image:2.595.326.547.45.359.2]factors on coordinate axis.
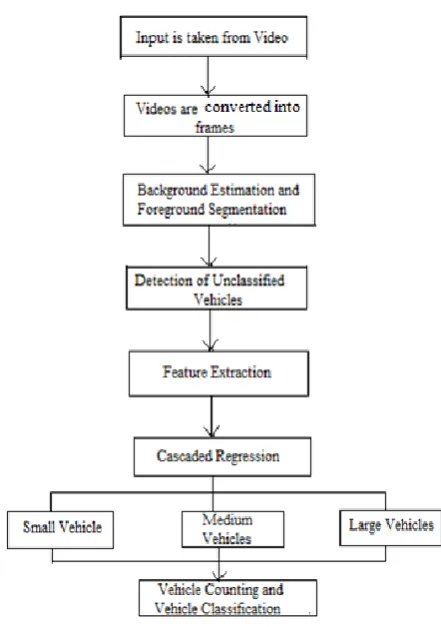
Fig. 2 The Flow of Vehicle Counting and Classification
Fig 2. describes the flow of car investigation and classification of road vehicles. Input is taken from video, during whichvideos are born-again into frames. Then backgrounds are calculable and foregrounds are metameric. The unclassified vehicles are detected and options are extracted and eventually, cascaded regression is to classify the vehicles into tinyvehicles, medium vehicles and enormous vehicles.
[image:2.595.344.520.572.712.2]Based on the mesh grid, to notice unclassified vehicles, distortion technique is employed. Background image is compared with this image frame. within the planned system, distortion technique uses the Thin-Plane spline warping as in [12].
International Journal of Innovative Technology and Exploring Engineering (IJITEE) ISSN: 2278-3075, Volume-8 Issue-7, May 2019
[image:3.595.338.529.54.839.2]Fig. 4 Unclassified vehicles
Vehicle form can be distorted, once the vehicle size is giant. Then apply the projective transformations to cut
back the distortions. Comparisons are done
between this frame and crooked results to observe the unclassified vehicles.
C. Feature Extraction
In caliber image frames, for detective
work and chase reliable options, the feature extraction may well be troublesome. a group of low level options is employed, that gift weak linear relations. The low level options include: a) phase area; b) segment length; c) segment width; and d) segment perimeter. The similar options are used as in [13]. supported the smoothing
spline, the options are normalized. The y
coordinate, that is near the image bottom with the reference line is taken for standardisation. Then, estimate the traffic flight. The phase length and dimension are computed by projection. within the phase, the larger vehicles are indicated by longer length and dimension. to create a one7× 1 feature vector, these options are get concatenated along. To estimate the count of huge vehicles, that feature vector is taken because the input vector..
D. Cascaded Regression
The cascaded regression classifies the vehicles into 3 totally different categories like tiny vehicles as sedan, medium vehicles as minivan/SUV and huge vehicles as bus/truck. To estimate emissions on highways, vehicle counts and categories are combined. detection many alternative categories is troublesome once cameras captures low frame rate videos and low resolution. The four totally different categories are taken as industrial trucks, medium-duty trucks (i.e., the trucks with 2 axles and 6 tires), light-duty trucks and cars/jeeps, that are utilized in [14]. the quantity of vehicles are calculated to spot the
massive vehicles like
truck/bus mistreatment mathematician method regression, whereas Poisson regression is to spot the medium vehicles like mini-van/SUV and eventually, tiny vehicles like sedan are known mis-treatment the theorem method regression as in [13].
IV.EXPERIMENTALRESULTS
A 5-minutes video is collected from the dataset [15] of road agglomeration and classification. The collected dataset has been born-again into frames. There are numerous frames, that is born-again from
video, however here solely 5 frames are taken for sample. The sample 5 frames are shown below:
Fig. 5(a) Sample Frame 1
Fig. 5(b) Sample Frame 2
Fig. 5(c) Sample Frame 3
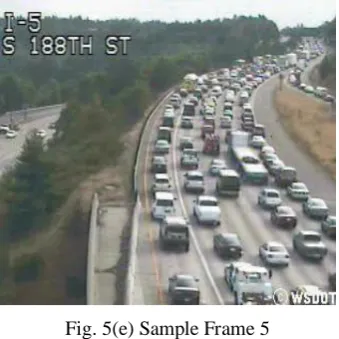
[image:3.595.87.262.56.201.2] [image:3.595.347.517.84.396.2]Fig. 5(e) Sample Frame 5
The higher than 5 sample frames of video has been taken and there's solely a small changes of moving the vehicles in every of the frames, as a result of here solely a 5 minutes video is taken. Those frames are taken as input and from that input, estimating the background and segmenting the foreground, then unclassified vehicles are detected and extracting the options and their results are shown below:
Table I
Results of feature extraction Feature
s
Imag e1
Image 2
Image 3
Image 4
Image 5 Length
(cm) 3 8 2 1 7
Width
(cm) 2 2 1 2 2
Area
(cm2) 6 16 2 2 14
Perimete
r(cm) 10 20 6 6 18
[image:4.595.90.260.51.221.2]From the table one, the options of length, width, space and perimeter are extracted from varied image frames. The extracted options are taken for reckoning and classification victimization multivariate analysis.
Fig. 6 Vehicle Counts and Classification
Fig. 6 shows the vehicles of small, medium and large vehicles like sedan, mini-van/SUV and truck/bus counts and classifications are done for approximately 53frames.
V. CONCLUSIONS
The Counting andClassification formula for route vehicles is bestowed during this paper. several existing algorithms are inaccurate in poor quality videos and conjointly fail to extract the reliable options. To count and classify the vehicles directly, a cascaded regression model is applied. A regression formula, that is helpful even once the vehicle resolution is low and when there are severe occlusions. The traffic density and vehicle emissions are calculable by
applying our formula. the longer term work of
the planned system is to boost in many areas and plenty of subtle algorithms is applied for background estimation and shadow removal.
REFERENCES
1. 1. N. Buch, S. A. Velastin, and J. Orwell, “A review of pc vision techniques for the analysis of urban traffic,” IEEE Trans. Intell. Transp. Syst., vol. 12, no. 3, pp. 920–939, Sep. 2011.
2. J. Lou, T. Tan, W. Hu, H. Yang, and S. J. Maybank, “3-D model- based mostly vehicle trailing,” IEEE Trans. Image method., vol. 14, no. 10, pp. 1561–1569, Oct. 2005.
3. Gupte . S, “Detection and Classification of Vehicles”, University of Gopher State 2002.
4. Coifman . B "A period of time pc Vision System for Vehicle trailing and Traffic Surveillance" University of Golden State, 1998.
5. Raman Maini, Dr. Himanshu Aggarwal” Study and Comparison of varied Image Edge Detection Techniques”.
6. Kaewtra Kulpong .P and Bowden .R, “An Improved adjustive Background Mixture Model for period of time trailing with Shadow Detection”, In Proceedings of the ordinal European Workshop on Advanced Video-Based police work Systems, 2001.
7. Jun-Wei Hsieh, Shih-Hao Yu, Yung-Sheng bird genus, and Wen-Fong Hu,” Automatic Traffic closed-circuit televisionFor Vehicle trailing And Classification” IEEE Transactions On Intelligent Transportation Systems, Vol. 7, No. 2, 2006.
8. Messelodi . S, Modena C. M., and Zanin . M, “A pc vision system for the detection and classification of vehicles at urban road intersections,” Pattern Anal. Appl., vol. 8, no. 1/2, pp. 17–31, 2005. 9. N. K. Kanhere, S. J. Pundlik, and S. T. Birchfield, “Vehicle
segmentation and trailing from a low-angle off-axis camera,” in Proc. IEEE CVPR, 2005, vol. 2, pp. 1152–1157.
10. N. K. Kanhere and S. T. Birchfield, “Real-time progressive segmentation and trailing of vehicles at low camera angles mistreatment stable options,” IEEE Trans. Intell. Transp. Syst., vol. 9, no. 1, pp. 148–160, Mar. 2008.
11. L. Unzueta et al., “Adaptive multicue background subtraction for strong vehicle count and classification,” IEEE Trans. Intell. Transp. Syst., vol. 13, no. 2, pp. 527–540, Jun. 2012.
12. F. L. Bookstein, “Principal warps: Thin-plate splines and therefore the decomposition of deformations,” IEEE Trans. Pattern Anal. Mach. Intell., vol. 11, no. 6, pp. 567–585, Jun. 1989.
13. A. B. Chan and N. Vasconcelos, “Counting folks with low-level options and Bayesian regression,” IEEE Trans. Image method., vol. 21, no. 4, pp. 2160–2177, Apr. 2012.
14. G. R. McGaughey et al., “Analysis of automobile emissions in a very Houston tunnel throughout the American stateAir Quality Study 2000,” Atmosp. Environ., vol. 38, no. 20, pp. 3363–3372, Jun. 2004.
15. The dataset collected from this link
[image:4.595.53.546.277.776.2]International Journal of Innovative Technology and Exploring Engineering (IJITEE) ISSN: 2278-3075, Volume-8 Issue-7, May 2019
AUTHORS PROFILE
G.Poorani completed her M.E. degree in 2016 at Sri Ramakrishna College of Engineering and Technology, Coimbatore. She has about Two years of experience in teaching. Her areas of interest are Network security, Grid computing and Image Processing. She published her papers in various International/ National Journals. She is a Member in IAENG.
G.Nivedhitha completed her M.E. degree in 2017
at Kumaraguru College of Technology,
Coimbatore. She has about Two years of experience in teaching. Her area of interest Network security, Grid computing and Wireless Technology. She published her papers in various International/ National Journals. She is a Member in IAENG.
S.Padmavathi completed her M.E. degree in 2013 at Angel College of Engineering and Technology, Tirupur. She has about Five years of experience in teaching. Her areas of interest Network security, Grid computing and Wireless Technology. She published her papers in various International/ National Journals. She is a Member i n IAENG.