International Journal of Innovative Technology and Exploring Engineering (IJITEE) ISSN: 2278-3075, Volume-8 Issue-7 May, 2019
Optimal Location of Doubly-Fed Induction
Generator and Unified Power Flow Controller with
Pso Algorithm
M.Muthuvel, G.Udhayakumar
Abstract: Power system operation can sometime operate under heavily loaded conditions which may lead to real power and reactive power loss, voltage deviation or even system collapse. This can occur mainly due to booming demand of electricity. This paper proposed a new methodology of integrating both Double Fed Induction Generator (DFIG) and Unified Power Flow Controller (UPFC) in a modified 30 bus system to overcome those problems. Particle Swarm Optimization technique (PSO) is used to find out the optimal location of DFIG and UPFC thereby reducing these losses and stabilizing the voltage levels (0.9 per unit-1.1 per unit). PSAT tool box is used in MATLAB platform to perform the power flow analysis. Final results show that the optimal location is achieved with sufficient reduction in power loss, better control over voltage profile and with better convergence from PSO algorithm.
Keywords: Particle Swarm Optimisation, Unified Power Flow Controller, Doubly Fed Induction Generator, Real Power loss, Reactive Power loss
I. INTRODUCTION
The aim of Distributed Generator (DG) is to generate a small amount of electric power equal to the total amount of electricity consumed [1]. The choice of distributed systems results in installation of both DGs and FACTS controller in Power Systems. The interaction of both DFIG (also referred as DG) and FACTS may either decrease or increase Power System stability based on the controls and positioning of those controllers [2]. Technically, we may observe an increment in unintentional power exchanges due to the contention among utilities, between generating stations and people who use the electricity. It can cause some power transmission lines to overload, eventually causing congestion. Number of innovative techniques can be created to increase the power handling ability of transmission lines and to control the power generated by using those controllers [3].The impact assessment of wind turbine based on double fed induction generator and FACTS device on electrical systems analyzed the effect of integrating both controllers based on the voltage instability, active power losses in IEEE 30 bus system that reduced significant amount of real power loss and improving the overall stability. [4]. The impact of Distributed Generation and FACTS controllers in power systems reviewed the work from the view point of different performance characteristics like such as minimization of active and reactive power losses. To reduce the capital cost of system, real, reactive power loss and to raise the system efficiency, the use of both these DFIG and FACTS will have a huge influence in it.
Revised Manuscript Received on May 5, 2019
Mr.M.Muthuvel, PG Scholar, Power system engineering, Valliammai Engineering College, Kattankulathur,Chennai-603203.
Dr.G.Udhayakumar M.E. Ph.D., Associate Professor, Department of EEE, Valliammai Engineering College, Kattankulathur,Chennai-603203.
In the field of machine intelligence, to find out the best results from random inputs, some of the advanced search algorithms like genetic algorithm [5] and evolutionary programming [6] are used to solve the complex development problems. To estimate solutions for all types of tedious problems, evolutionary techniques are mostly used as they don’t make any ideas regarding fitness landscape [7]..Each variable in PSO moves with a particular velocity that will be modified in accordance with its own travel experience and also its travel experience of nearby variable. Every variable is treated as a volume less particle in the dimensional search area. Genetic algorithm can be viewed as a general search method, based on Darwinian principles of biological evolution, reproduction and the survival of the fittest [8]. Genetic algorithm maintains a collection of solutions known as population and repeatedly changes them. At each and every step, it selects variables from the present population to be parents and uses them to produce offspring for the upcoming generation. In IEEE-30 bus system, at regular conditions all bus voltage lies in between 0.9 p.u and 1.1 p.u. Violation of voltage levels below the acceptable range & increased loss of real and reactive power can occur when there is sudden increase in demand of load that can’t be compensated by the base system. So integration of DFIG and UPFC in 30 bus system is much needed to rectify this problem.
The performance of the PSO is more efficient than that of genetic method from the evolutionary point of view, and it seems PSO arrives at its final parameter values in fewer generations than genetic method [9].In this paper particle swarm optimization technique is used to optimally locate the controllers for stabilizing the voltage deviations and reducing the power losses.
A. PSAT
Optimal Location of Doubly-Fed Induction Generator and Unified Power Flow Controller with Pso Algorithm B. DFIG
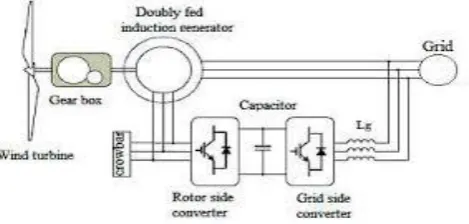
Induction generators with windings present on both static and moving parts that can transfer electricity between shaft and the system is referred to as DFIG. Doubly-fed electric machines can control both real and reactive power, output power to a certain level and can also manipulate voltage and speed. These are variable speed three-phase wound-rotor induction machines with more merits and technical advancements over conventional generators.
[image:2.595.310.544.213.315.2]The rotor windings are connected to the grid through slip rings and back-to-back converters that can manipulate both rotor and grid currents. Frequency of rotor usually varies smoothly from the grid frequency. The converter is used to keep in line the rotor currents, and also to change the active and reactive power.
Fig.1. DFIG based wind turbine
C. UPFC
Unified Power Flow Controller has two back to back converters known as shunt converter and series converter manipulated through a DC link rendered by a dc storage capacitor. It operates as a perfect ac to ac converter in which real power will flow either in direction between the two converts. Reactive power can be controlled by both converters and it can be either absorbed or supplied. Shunt converter is connected in parallel to the transmission line with shunt transformer and series converter is connected in series with the series transformer. The dc terminals of two converters are joined and it makes active power exchange between two converters. The magnitude of injected voltage and phase angle can be manipulated with these converters. Voltage source acts as a pathway for transmission line current that can transfer both active and reactive power.
[image:2.595.52.287.239.351.2]The real power is converted back into its dc power which lies at the dc link as real power demand .Shunt converter is used to supply or absorb real power at the common dc link to enhance real power transfer due to the injection of series voltage.
Fig.2. Unified Power Flow Controller II. METHODOLOGY
A. IEEE 30 Bus System
PSAT performs power flow analysis 30 bus system which consists of 30 buses, 38 lines, 3 transformers, 6 generators and 12 loads. Power flow results shows voltage profile, line flows, total real power and reactive power generation, total real and reactive power loss. From the table it has been observed that the total generation of real power is 291.78 MW and reactive power generation is 123.17 MVAR with real power loss of about 4.42 % and reactive power loss of about 18.48%
TABLE I: POWER FLOW RESULTS OF IEEE 30 BUS SYSTEM
Real power generation 291.8 MW
Reactive power
generation 123.17 MVAR
Real power load 278.9 MW
Reactive power load 100.42 MVAR
Real power loss 12 MW
Reactive power loss 22.7 MVAR
B. MODIFIED IEEE 30 BUS SYSTEM WITH DFIG
Loads at bus 14 and bus 5 are increased randomly that maximized the total real power generation from 291.8 MW to 332.06 MW and total base load from 278.9 MW to 311.5 MW. This also made the total real power loss to increase from 12 MW to 20.5 MW and reactive power loss to increase from 22.7 MVAR to 50.73 MVAR. This can also create a impact on voltage profile at bus 24 to reduce from 0.982 p.u to 0.861 p.u. But voltage limit should lie in between 0.9 p.u to 1.1 p.u. So DFIG can be connected to bus 24 through a separate bus 31 along with a transformer connected to it. Load is kept constant at 311.5 MW, DFIG generates 6.8 MW of real power which reduced total generation from 332.06 MW to 325.2 MW, real power losses reduced from 20.5 MW to 13.71 MW and reactive power loss decreased from 50.73 MVAR to 21.20 MVAR.
C. MODIFIED 30 BUS SYSTEM WITH DFIG AND UPFC
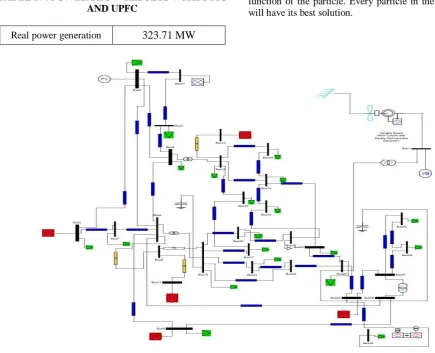
The total real and reactive power loss can be further reduced by integrating DFIG in bus 24 along with placement of UPFC in between bus 25 and 26 as shown in fig.3. UPFC is located at that location because the voltage profile is much lower in those buses when compared with all other buses. The ratings of DFIG and UPFC are shown in table II and III. Power flow results are shown in table IV.
TABLE II: DFIG RATING
Power, Voltage and Frequency
100 MVA, 33 KV, 50 HZ
Gain Constant (Kr), Time
constant(Tr) 50 p.u , 0.1 p.u
[image:2.595.59.282.645.778.2]International Journal of Innovative Technology and Exploring Engineering (IJITEE) ISSN: 2278-3075, Volume-8 Issue-7 May, 2019
TABLE III: UPFC RATING
Power, Voltage and Frequency
100 MVA, 33 KV, 50 HZ
Gain Constant (Kr), Time
constant(Tr) 50 p.u , 0.1 p.u
Maximum Vp and Minimum
Vp 1.1 p.u. , 0.90 p.u.
Maximum Iq and Minimum
Iq 1.1 p.u. , 0.9 p.u.
It can also be done manually by placing both these controllers in each and every 30 bus individually to analyze which location yields very low real and reactive power loss, but it can consume lot of time to execute those results. So an efficient particle swarm optimization algorithm is implemented here to find out the optimal location of both controllers in an efficient manner.
TABLE IV: POWER FLOW RESULTS WITH DFIG AND UPFC
Real power generation 323.71 MW
Reactive power
generation 114.78 MVAR
Real power load 311.5 MW
Reactive power load 100 MVAR
Real power loss 12.20 MW
Reactive power loss 14.85 MVAR
E. PSO ALGORITHM
[image:3.595.48.292.70.172.2]It is an easy technique based on the social behavior of the species like bird flocking, fish schooling. The algorithm keeps the particles within the search area with initial velocities. Velocities are allocated to these particles arbitrarily. Each and every particle in search area will find its optimal solution with the help of two parameters called position and velocity that can also calculate the fitness function of the particle. Every particle in the problem area will have its best solution.
Fig.3. PSAT Representation of modified 30 Bus System with DFIG and UPFC
STEP 1: Initialization: The velocities and positions of all particles are initialized within a standard range with predefined values.
STEP 2: Updating Velocity: The velocities of all particles are modified with position and velocity of particle i at every iteration. pi best and gi best are the position with the best objective obtained so far by particle i and the entire population.
STEP 3: Updating Position: In between each successive iterations, the positions of all particles are modified in
[image:3.595.56.492.273.626.2]Optimal Location of Doubly-Fed Induction Generator and Unified Power Flow Controller with Pso Algorithm
STEP 5: Termination: Steps from 2 to 4 are repeated until certain termination criteria’s are met, such as a pre-defined number of iterations or a failure to make advancement for certain number of iterations.
The following equation yields the best solution for the controllers to be placed in the 30 bus system
v(i,j)=w*v(i,j)+c1*rand()*(pbest(i,j)-xt(i,j))... +c2*rand()*(gbest(1,j)-xt(i,j))
v(i,j) Particles Velocity
w Inertia coefficients
c1.c2 Learning factors
xt(i,j) Particles position at time t pbest(i,j) Particles individual best position
gbest(1,j) Swarms best solution
The optimal location can be found based on bus location which yields low real and reactive power generation or low real and reactive power loss.
PSO Parameters:
Swarm size =20
Max no of iterations =100 Learning Factors c1, c2 =2, 2 wmax and wmin (inertia) =0.9,0.4
III. RESULTS AND DISCUSSION
PSO algorithm finds the best connected bus for DFIG and best connected line for UPFC with the help of power flow analysis results from PSAT and the it locates the controllers at all individual buses, eventually it finds the optimal location that yields low real and reactive power generation thereby reducing the loading conditions which in turn also reduces the total real and reactive power loss
Best DFIG connected bus = Bus24 Best UPFC connected bus = Bus 25_26 Active Power generation =3.2353 p.u Reactive Power generation =1.0609 p.u Total Computational time = 25.043 seconds.
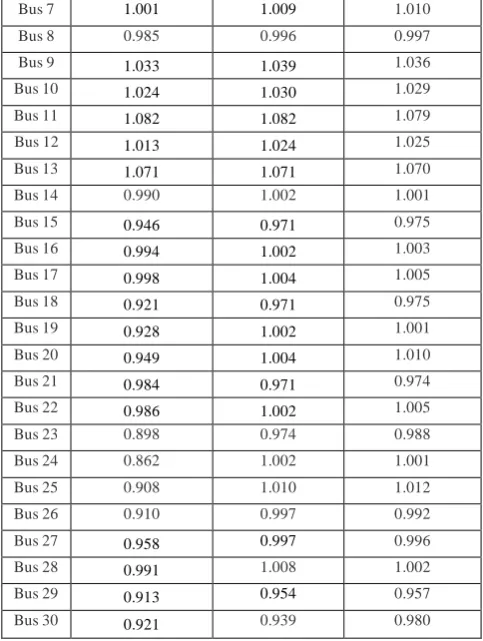
[image:4.595.304.546.53.374.2]Though slight improvement of voltage had occurred at almost all buses after locating DFIG and UPFC, PSO algorithm has a better control over voltage profile of the modified 30 bus system with significant amount of change in certain buses 3,6,8,23,24,27,28 and 30 as shown in table V.
TABLE V: COMPARISON OF VOLTAGE PROFILE
BUS NO VOLTAGE PROFILE WITHOUT DFIG & UPFC (LOAD INCREASED) (P.U) VOLTAGE PROFILE WITH DFIG &
UPFC (P.U) VOLTAGE PROFILE WITH DFIG,UPFC & PSO (P.U)
Bus 1 1.060 1.060 1.061
Bus 2 1.045 1.045 1.050
Bus 3 1.026 1.036 1.032
Bus 4 1.018 1.030 1.031
Bus 5 1.010 1.010 1.009
Bus 6 1.010 1.018 1.012
Bus 7 1.001 1.009 1.010
Bus 8 0.985 0.996 0.997
Bus 9 1.033 1.039 1.036
Bus 10 1.024 1.030 1.029
Bus 11 1.082 1.082 1.079
Bus 12 1.013 1.024 1.025
Bus 13 1.071 1.071 1.070
Bus 14 0.990 1.002 1.001
Bus 15 0.946 0.971 0.975
Bus 16 0.994 1.002 1.003
Bus 17 0.998 1.004 1.005
Bus 18 0.921 0.971 0.975
Bus 19 0.928 1.002 1.001
Bus 20 0.949 1.004 1.010
Bus 21 0.984 0.971 0.974
Bus 22 0.986 1.002 1.005
Bus 23 0.898 0.974 0.988
Bus 24 0.862 1.002 1.001
Bus 25 0.908 1.010 1.012
Bus 26 0.910 0.997 0.992
Bus 27 0.958 0.997 0.996
Bus 28 0.991 1.008 1.002
Bus 29 0.913 0.954 0.957
Bus 30 0.921 0.939 0.980
IV . CONCLUSION
The integration of DFIG and UPFC in a 30 bus system had reduced real and reactive power loss to a significant margin, and by incorporating PSO algorithm the optimal location of DFIG is achieved at bus number 24 and UPFC between bus 25 and bus 26. Voltage values of the modified 30 bus system are compared in presence and absence of PSO algorithm and the tabulation results shows that voltage deviations at multiple buses are controlled in a better manner. In future, new methodologies can be implemented using hybrid algorithm in achieving better results.
REFERENCES
1.Pepermans G, Deeriesen J ,Belmans R.D’haeseleer Wind Energy Distribution generation: Energy Policy: 33,pp:787–798.
2.Mokhtari M, Khazaie J (2013 ) “Interaction analysis of multifunction FACTS and DFACTS controllers” Turk Journal of Electrical Engineering Computer Science Vol.21,pp:1685–702.
3.Study of system operating impacts of FACTS technologies (1993) GE, ECC Inc., Carson Taylor Seminars, Final Report on EPRI RP 3022-25. 4.Labiba ADJOUDJ, Fatiha LAKDJA and Fatima Zohra GHERBI
(2015)“Impact of wind turbine based on double feed induction generator and FACTS devices on power systems” Leonardo Journal of Sciences Issue 26, pp:97-112.
5.Alabduljabbar A, Milanovic J (2006) “Genetic algorithm based optimization for allocation of static VAr compensators” Proceeding of the 8th IEE international conference on AC and DC power transmission, pp:115–20.
International Journal of Innovative Technology and Exploring Engineering (IJITEE) ISSN: 2278-3075, Volume-8 Issue-7 May, 2019
7.Fogel DB. Evolutionary computation: toward a new philosophy of machine intelligence. Piscataway, NJ: IEEE Press; 1995. ISBN: 0471669512.
8.D.E. Goldberg, Genetic Algorithms in Search, Optimization, and Machine Learning, Addison-Wesley, 1989.
9.Sidhartha Panda , Narayana Prasad Padhy (2008) “Comparison of particle swarm optimization and genetic algorithm for FACTS-based controller design”. Elsevier, Applied Soft Computing.Vol.8,pp: 1418– 1427.
Author-1:
Mr.M.Muthuvel
PG Scholar, Power system engineering, Valliammai Engineering College,
Kattankulathur,Chennai-603203.
Author-2
Dr.G.Udhayakumar M.E. Ph.D.,
Associate Professor, Department of EEE, Valliammai Engineering College,