Abstract: The ideal objective of combining therapeutic pictures is converging of the numerous pictures acquired from multimodalities into a solitary picture for prevalent sickness analysis. A tale calculation for skillful melding of multimodal restorative pictures is proposed in this paper. For combining of restorative pictures, Undecimated Discrete Wavelet Transform domain (UDWT) and Intuitionistic fuzzy sets are used. Dominant of the available fusion techniques are working in light of Discrete Wavelet Transform (DWT). A slight obscuring is seen when DWT is utilized for image fusion. By using UDWT, this blurring is significantly reduced. There is no decimation process in UDWT. Henceforth, wavelet coefficients are processed for every area permitting better identification of prevailing highlights. It is a non-orthogonal multi-resolution decomposition. In the UDWT domain, the low recurrence sub-groups are combined by the Maximum Selection Rule and the high recurrence sub-groups are intertwined by the Modified Spatial Frequency (MSF). Recreations are carried on different therapeutic pictures and diverged from strategies exist up until now. Predominance of the proposed technique is introduced and supported. Combined picture quality is affirmed with number of value measurements i.e., Entropy (H), Spatial Frequency (SF), Peak Signal to Noise Ratio (PSNR), Mean Square Error (MSE), Edge-based image fusion metric (QAB/F), Correlation Coefficient (CC), Quality Index (QI) and Structural Similarity (SSIM).
Index Terms: Image fusion, Fuzzy Set Theory, Discrete Wavelet Transform, Medical Image Processing, Wavelet Transform, PSNR
I. INTRODUCTION
Various image processing techniques are generally utilized in Medical field for Smart Healthcare Systems. Among the techniques, picture combination is quickly expanding its hugeness in the combination of medicinal pictures X-ray, CT, MRI, MRA, and PET, SPECT pictures. Over the previous decade, gigantic research has been done in preparing and examination of medicinal information for analysis reason. Intertwining of CT and MRI pictures, MR and PET images, MR and SPECT images provide rich data valuable for effective diagnosis since the CT image gives the details of thick structures like bones and implants with little distortion, but cannot identify physiological changes, while the MRI gives typical and pathological soft tissues information. PET images provide help to evaluate functions of Organs and Tissues. SPECT images provide help in diagnosis of stress fractures in the spine, the blood deprived
Revised Manuscript Received on April 07, 2019.
Praneel Kumar Peruru, Research Scholar, Department of CSE, Jawaharlal Nehru Technological University Anantapur, Ananthapuramu, India.
Kasa Madhavi, Associate Professor of CSE, Jawaharlal Nehru Technological University Anantapur, Ananthapuramu, India..
T Tirupal, Associate Professor of ECE, G Pullaiah College of Engineering and Technology, Kurnool, India.
areas of a brain stroke. In extraction of the information from such images, the progression of developing novel algorithms provided major stimulus in image and signal processing. The goal of computer based medical diagnostic system is to empower the quick conclusion of disease, disease monitoring, and healthier treatment of disease. Medical images of various modality provide reciprocal information and this is incorporated for better evaluation. Fusing of multimodality images provide a solitary composite image that is dependable for enhanced investigation of disease diagnosis.
The most imperative research focus is extricating crucial information by fusion of multimodal medical images [1]. Existing exploration techniques are DWT [2, 23], UDWT [3], pixel-based and region-based methods [4, 23], the enhanced image capture [5], the laplacian pyramid [6], the complexity pyramid [7], the proportion of-low-pass pyramid [8], morphological pyramid [10], ripplet change [21] and the DWT technique [11-13]. A serious diagram of therapeutic picture combination strategies are alluded in [14]. The scarcest troublesome system of picture melding is to take pixel by pixel normal of two info pictures that may prompt a complexity decrease. All pyramid techniques fails to display spatial introduction on selectivity in disintegration of the procedure [9], which cause blocking impacts and undesired edges in the intertwined picture. Another strategy of restorative picture intertwining is the wavelet-based technique that utilizes discrete wavelet transform (DWT) in the combination where DWT jelly varied recurrence data in standard structure and permits great limitation in time and recurrence space. The real disadvantage of DWT is that the change would not give move invariance that causes a noteworthy change in the wavelet[16-17] coefficients of the pictures for minor changes in the info pictures. In restorative picture examination, it is critical to know and protect the definite purpose of the data and it is happened which is called as UDWT [15].
II. PRELIMINARIES 2.1. DWT
The DWT is a widely used image and signal processing technique utilizing an alternate set of the wavelet scales and translations agreeing with pre-defined rules. DWT also breakdowns signals into commonly symmetrical group of wavelets, a fundamental contrast from a continuous wavelet transforms (CWT), or its utilization for different time series often labeled as discrete time CWT (DT-CWT).
For getting a two dimensional wavelet transform (WT),
Multimodal Medical Image Fusion based on
Undecimated Wavelet Transform and Fuzzy Sets
the single dimension is applied initially on the rows and then on the columns to create four sub-bands: low-resolution, horizontally, vertically, and diagonally. At every level, the WT can be re-connected to the low-goals sub-band to additionally disassociate the picture. The last setup holds a little low-goals sub-band. Also, the expression level '0' can be used for alluding to the first picture information dependent on various dimensions of change. The primary info picture information (level-0) will be considered as a low-pass band and preparing pursue its normal stream for solicitations at zero dimensions of change.
2.2. UDWT
Contrast to DWT that minimizes the approximation coefficients and the detail coefficients at each crumbling dimension, it doesn't fuse the limiting undertakings. As such, the gauge coefficients and detail coefficients at each dimension are at an indistinct length from the parent flag. UDWT expands the example coefficients of the lowpass and high pass channels at each dimension. The upsampling activity and widening wavelets are equivalent[18]. The assurance of the UWT coefficients lessens with growing dimensions of weakening.
The 'a trous' wavelet[1] change is a non-symmetrical multi-goals disintegration that disengages the low recurrence data (inexact esteem) from high recurrence data (nitty gritty coefficient). Such a disengagement utilizes a low-pass channel , which is related with the scale work , to get dynamic approximations of a flag through scales as below:
n
j j
j k hn a k n j N
a ( ) ( ) 1( 2 1), 1,...., (1)
Where a0(k) does correspond to unique discrete signal:s(k); N and jare the number of scales and scale index, respectively.
A high-pass filter g(n) is used to extract the wavelet coefficients, linked with the wavelet function(x), via the
following decompose operation:
n
j j
j k gna k n
w ( ) ( ) 1( 2 1)(2)
The exact reconstructing of data can be performed by presenting two double filters
hr
(
n
)
and gr(n)that should be satisfying the quadrature mirror filter condition: n l n l g n gr n l h n
hr( ) ( ) ( ) ( ) ()(3)
the (l) is a Dirac function. A straightforward decision comprises in considering the above filters as equal to Dirac function (hr(n)gr(n)(n)) . Therefore g(n) is
concluded from (3) as
) ( ) ( )
(n n h n g (4)
Hence, these wavelet coefficients obtained by a little contrast among two progressive approximations as below:
) ( ) ( )
(k a 1 k a k
wj j j (5)
To build this sequence, successive convolutions with a filter obtained from an auxiliary function named as the scaling function can be performed by this algorithm. Given an imageI, the sequence of approximations built are as follows:
) ( ),
( ),
( 2 1 3 2
1 F I A F A A F A
A (6)
Where
F
represents a scaling function. A B3 cubic spline function is frequently utilized for the characterization of the scaling function [19] and the B3 cubic spline usage prompts to a convolution bearing a mask of 55 1 4 6 4 1 4 16 24 16 4 6 24 36 24 6 4 16 24 16 4 1 4 6 4 1 256 1 (7)
As shown above, the wavelet planes has been calculated as the variance among two successive approximations Aj1
andAj.
Allowing djAj1Aj, j1,...,n(8) In whichA0I, the remaking formula is
J
j j J A d I
1
(9)
In this portrayal, the images Aj(j0,1,....,J) are approximations of the primary image Iat expanding scales (diminishing resolution levels), dj(j1,...,J) are the multi resolution wavelet planes and AJis a lingering image.
Taking note of the first image A0 that has a dual resolution thanA1, the image A1dual resolution than A2 and so on. However, all the continuous approximations (and wavelet planes) have the similar quantity of pixels as of the first image. It is a result of the fact that the „a trous‟ algorithm stands as non-orthogonal more sampled transform.
2.3. Intuitionistic Fuzzy Set (IFS)
This section deals with point of interest of intuitionistic fuzzy set method, a proposed technique for multimodal medicinal picture combination. Therapeutic pictures are poor in brightening, has numerous vulnerabilities as commotion, having dark limits, dim dimensions are covered, imperceptible veins and difficult to separate items from the picture. Fluffy sets in picture preparing increment the difference, smoothen the regions of intrigue, and sharpen the edges and fine structures of the picture.
IFS(R; )1(1 I(R)) (10)
0 , )) ( 1 ( ) ;
(R R (1)
vIFS I (11)
) ; ( ) ; ( 1 ) ; (
IFS R IFS R vIFS R (12)
As α varies for every one of the pictures, the ideal estimation of α is acquired utilizing another target work called intuitionistic fluffy entropy (IFE) presented by Vlachos and Sergiadis and is described as
1 0 1
0 2 2 2
2 ) ; ( ) ; ( ) ; ( ) ; ( ) ; ( ) ; ( 2 1 ) ; ( M i N
j IFS ij IFS ij IFS ij
ij IFS ij IFS ij IFS R R v R R R v R N M I IFE (13)
IFE is calculated using Eq. (16) for all values of α and is optimized by finding the maximum IFE i,e.,
)) ; (
max(
opt IFE I (14)
Using this optimum value of α, new membership degree, new non-membership degree and new hesitation degree of the two input images respectively are computed. So, in the intuitionistic fuzzy domain, the two enhanced images
opt IFS opt
IFS I
I1 _ , 2 _ for the two registered input images using
new membership degrees is represented as
, ( ; ), ( ; ), ( ; )| 0,1,..,. 1
_ R R v R R R L
IIFS opt IFS opt IFS opt IFS opt (15) The fused image is then constructed by using the two new enhanced images as
RI IFS opt I IFS opt
FI , 1 _ , 2 _ (16)
The detail description of Intuitionistic fuzzy image fusion can be seen in [25].
III. PROPOSEDMULTIMODALMEDICALIMAGE
FUSIONMETHOD
In area 3, a novel methodology for medicinal picture combining is introduced, which is based on solidifying the pieces of low-frequency sub-bands (LFSs) and high- frequency sub-bands (HFSs) utilizing differing combination plans. The essential focus of this paper is intertwining of the multimodal medicinal images[22] in which the characteristics of the pictures are considered. From fig. 2 the CT pictures give clear bones data without delicate tissues data, while the MR pictures give clear delicate tissues data without bones data. Thus, when the two pictures are melded both the bone and delicate tissues data are found in the intertwined picture. Thus in the fig. 3 the MR picture gives clear delicate tissue subtleties and PET picture gives working subtleties of organs and tissues. By combination of these two pictures, the tissue data can be unmistakably found in the resultant picture. From fig. 4, the MR image soft tissue information is visible and from SPECT image blood deprived areas of brain are clearly visible. As these two images are fused, then the result image shows clear soft tissue and brain stroke information to a great extent. The fusion of two different images such as CT and MR, MR and PET, MR and SPECT images provide valuable
information for the evaluators or doctors to effectively diagnose the disease and provide accurate treatment to the patient. Such diagnosis leads for effective smart healthcare systems by which patients can get treatment and suggestions from remote locations without visiting the doctor by transferring such images over online medical systems.
3.1. Algorithm
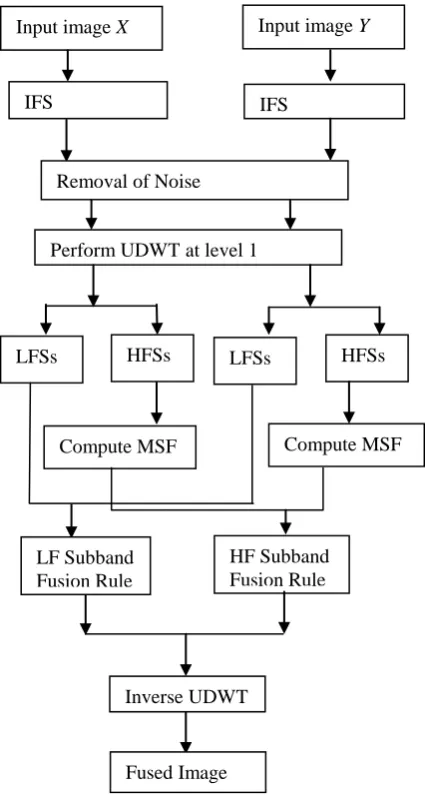
The multimodal medical image fusing is achieved by the following steps:
1.The source medical images X and Y are given as input. 2.The images are fuzzified using Intuitionistic Fuzzy Set. 3.The fuzzified images are passed through a filter for
removal of noise.
4.The noise filtered images are decomposed using UDWT for obtaining LFSs and HFSs.
5.The coefficients of LFSs are fused to get fused LFS using the maximum selection rule.
6.The coefficients of HFSs of two source images are segmented into several regions.
7.The modified spatial frequency of comparing regions of segmented HFSs of two source images is computed. 8. Compare the changed spatial recurrence of comparing districts of two source pictures to finish up which ought to be utilized to develop the intertwined HFS
picture.
otherwise
HFS
MSF
MSF
if
HFS
HFS
Y i Y i X i X i F (17)Where HFSF is the fused HFS image, MSFiX and MSFiY are the
modified spatial frequencies of the ith region of HFS image for X and Y images respectively.
8.Final fused medical image is obtained by performing inverse undecimated discrete wavelet transform on the fused LFSs and HFSs.
3.2 Function of the system and Block diagram
Fig. 1. Schematic diagram of the proposed medical image fusion method
IV. EXPERIMENTALRESULTSAND COMPARISONS
The performance of proposed fusing of multimodal medical picture strategy on different therapeutic pictures is introduced. Fig. 2 which contains info and yield pictures of various strategies. Figs. 2a and b are two information CT and MRI therapeutic pictures. Figs. 2c-f are combined pictures by utilizing DWT [2], UDWT [3], IFS techniques [25] and of the proposed strategy individually. Trial results on a few sets of restorative pictures, for example, Figs. 3a and b are MR and MRA pictures with some disease demonstrate that the proposed technique delivers preferred restorative data over the other three methodologies. Figs. 4a and b are base and best centered MR and SPECT pictures.
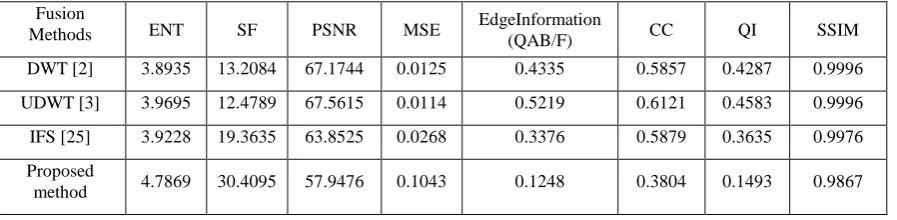
For looking at the combining results, the target criteria are recorded in Table 1 for fig. 2, Table 2 for fig. 3 and Table 3 for fig. 4. Table 1 , Table 2 and Table 3, demonstrates the metrics[20] got for three sets of pictures with execution assessment measurements. It tends to be seen that the estimations of a few quality measurements of proposed strategy are superior to those of DWT, UDWT, IFS strategies.
V.CONCLUSIONS
In this paper, a one of a kind technique is proposed dependent on UDWT and Fuzzy Sets with MSF for melding multimodal medicinal pictures. The intertwining of medicinal pictures assumes a critical job in numerous restorative applications as they give more exact data than single lot of pictures. Maybe a couple of the current issues in combining strategies, for example, obscuring impacts have been fundamentally outperformed. This paper demonstrates the utilization of UDWT and Fuzzy sets for combining the multimodal restorative pictures in three stages. As an initial step, the info therapeutic pictures are fuzzified utilizing IFS and gone through a channel to evacuate commotion and the clamor separated pictures are disintegrated utilizing UDWT to get LFSs and HFSs. In the second step, the coefficients of low-recurrence band are melded utilizing most extreme choice guideline and the high-recurrence band coefficients are intertwined utilizing adjusted spatial recurrence. In the last advance, the intertwining of information picture is worked by the backwards UDWT with the composite coefficients. The new technique displayed here has demonstrated its precision and quality over existing picture melding calculations in both visual and quantitative measures.
(a) (b)
(c) (d)
[image:4.595.312.540.319.705.2](e) (f)
Fig. 2. Fusion results for CT and MR images (a) CT image (b) MR image (c) Fused image by DWT (d) Fused image by UDWT (e) Fused image by Fuzzy
(f) Fused
LFSs HFSs LFSs HFSs
Compute MSF
Input image X Input image Y
IFS IFS
Perform UDWT at level 1 Removal of Noise
LF Subband Fusion Rule
Inverse UDWT
HF Subband Fusion Rule
Fused Image
image by the proposed method
(a) (b) (c)
[image:5.595.106.492.70.351.2](d) (e) (f)
Fig. 3. Fusion results for MR image and PET image (a) MR Image (b) PET image (c) Fused image by DWT (d) Fused image by
UDWT (e) Fused image byIFS (f) Fused image by the proposed method
(a) (b) (c)
(d) (e) (f)
Fig. 4. Fusion results for MR image and SPECT image (a) MR Image (b) SPECT Image (c) Fused image by DWT (d) Fused
[image:5.595.103.491.391.666.2]Table 1 Performance evaluation results for different fusion methods for figure 2
Table 2 Performance evaluation results for different fusion methods for figure 3 Fusion
Methods ENT SF PSNR MSE EdgeInformation (QAB/F
) CC QI SSIM
DWT [2] 4.0911 17.0929 64.4709 0.0232 0.5251 0.8301 0.7585 0.9976 UDWT [3] 4.1385 15.8658 64.8409 0.0213 0.5992 0.8403 0.7739 0.9976 IFS [25] 4.2684 17.8788 61.9822 0.0412 0.4914 0.7932 0.6711 0.9959 Proposed
method 4.0281 30.9617 58.3489 0.0951 0.2626 0.7102 0.5042 0.9885 Table 3 Performance evaluation results for different fusion methods for figure 4
Fusion
Methods ENT SF PSNR MSE EdgeInformation (QAB/F) CC QI SSIM
DWT [2] 3.8935 13.2084 67.1744 0.0125 0.4335 0.5857 0.4287 0.9996 UDWT [3] 3.9695 12.4789 67.5615 0.0114 0.5219 0.6121 0.4583 0.9996 IFS [25] 3.9228 19.3635 63.8525 0.0268 0.3376 0.5879 0.3635 0.9976 Proposed
method 4.7869 30.4095 57.9476 0.1043 0.1248 0.3804 0.1493 0.9867
REFERENCES
1.X. Li, M.He, and M.Roux,: “Multifocus image fusion based on redundant wavelet transform”, IET Image Process., 2010, 4, (4), pp. 283–29.
2.El-Hoseny, H.M., El. Rabaie, E.S.M., Elrahman, W.A., et al.: „Medical imagefusion techniques based on combined discrete transform domains‟, 2017 Proc. 34thNational Radio Science Conference (NRSC), Alexandria, 2017, pp. 471-480.
3.Tirupal, T., Mohan, B.C., and Kumar, S.S.,: „Image fusion of natural, satellite, and medical images using Undecimated Discrete Wavelet Transform and contrast visibility‟, 2015 Proc. National Conference on Recent Advances in Electronics & Computer Engineering (RAECE), Roorkee, 2015, pp. 11-16.
4.N.Mitianoudis and T.Stathaki,: “Pixel-based and region-based image fusion schemes using ICA bases,” Information fusion, 2007, 8, (2), pp. 131-142.
5.P.J.Burt and R.J.Kolczynski,: “Enhanced image capture through fusion,” Proc. IEEE International Conference on Computer Vision, 1993, pp. 173-182.
6.P.J.Burt and E.H.Adelson,: “The laplacian pyramid as a compact image code,” IEEE Transactions on Communications, 1983, 31, (4), pp. 532-540.
7.A.Toet, J.J.Van Ruyven, and J.M.Valeton,: “Merging thermal and visual images by a contrast pyramid,” Optical Engineering, 1989, 28, (7), pp. 789-792.
8.A.Toet,: “Image fusion by a ratio of low-pass pyramid,” Pattern Recognition Letters, 1989, 9, (4), pp. 245-253.
9.A.Toet,: “A morphological pyramidal image decomposition,” Pattern Recognition Letters, 1989, 9, (4), pp. 255-261.
10. S.Das, M.Chowdhury, and M.K.Kundu,: “Medical image fusion based on ripplet transform type-I,” Progress in Electromagnetics Research, 2011, vol. 30, pp. 355-370.
11. H.Li, B.S.Manjunath, and S.K.Mitra,: “Multisensor image fusion using the wavelet transform,” Graphical Models and Image Processing, 1995, 57, (3), pp. 235-245.
12. Y.Yang, D.S.Park, S.Huang, and N.Rao,: “Medical image fusion via an effective wavelet-based approach,” EURASIP Journal on Advances in Signal Processing, vol. 2010, article ID 579341, 2010.
13. Q.Guihong, Z.Dali, and Y.Pingfan,: “Medical image fusion by wavelet transform modulus maxima,” Optics Express, 2001, 9, (4), pp. 184-190. 14. A.P.James and B.V.Dasarathy,: “Medical image fusion: a survey of the
state of the art,” Information Fusion, 2014, 19, pp. 4-19.
15. J.Flower,: “The redundant discrete wavelet transform and additive noise,” IEEE Signal Processing Letters, 2005, 12, (9), pp. 629-632. 16. S. Mallat,: “A theory for multiresolution signal decomposition: the
wavelet representation”, IEEE Transactions on Pattern Analysis Machine Intelligence, 1989, 11, (7), pp. 674-693.
17. M. Malfait and D. Roose,: “Wavelet-based image denoising using a markov random field a priori model”, IEEE Transactions on Image Processing, 1997, 6, (4), pp. 549-565.
18. M. Unser,: “Texture classification and segmentation using wavelet frames”, IEEE Transactions on Image Processing, 1995, 4, (11), pp. 1549-1560.
Fusion
Methods ENT SF PSNR MSE
EdgeInformation
(QAB/F) CC QI SSIM
DWT [2] 6.7541 16.4915 70.5235 0.0058 0.7014 0.9762 0.9538 0.9996 UDWT [3] 6.7432 15.4391 71.8740 0.0042 0.7548 0.9825 0.9657 0.9996 IFS [25] 6.5281 8.6021 64.6636 0.0222 0.4679 0.9198 0.8125 0.9971 Proposed
[image:6.595.77.526.342.452.2]19. J. Nunez, X. Otazu, O. Fors, A. Prades, V. Pala and R. Arbiol,: “Multiresolution-based image fusion with additive wavelet decomposition”, IEEE Transactions on Geoscience Remote Sensing, 1999, 37, (3), pp. 1204-1211.
20. A.Eskicioglu and P.Fisher,: “Image quality measures and their performance,” IEEE Transactions on Communications, 1995, 43, (12), pp. 2959-2965.
21. S.Das and M.K.Kundu,: “Ripplet based multimodality medical image fusion using pulse-coupled neural network and modified spatial frequency,” Proc. IEEE International Conference on Recent Trends in Information Systems, 2011, pp. 229-234.
22. H.O.Shanker Mishra and S.Bhatnagar,: “MRI and CT image fusion based on wavelet transform,” International Journal of Inf. and Computer Tech., 2014, 4, (1), pp. 47-52.
23. Shutao Li, and Bin Yang,: “Multifocus image fusion using region segmentation and spatial frequency”, Image and Vision Computing, 2008, 26, (7), pp. 971-979.
24. C.S.Xydeas and V.Petrovic,: “Objective image fusion performance measure”, Electronic Letters, 2000, 36, (4), pp. 308-309.
25. Tamalika Chaira,: “Intuitionistic Fuzzy Set Theory in Medical Imaging”, International Journal of Soft Computing and Engineering (IJCSE), 2011, ISSN:2231-2307, 1, Issue-NCRAMT2011
AUTHORSPROFILE
Praneel Kumar Peruru, pursuing full-time Ph.D from Jawaharlal Nehru Technological University Anantapur, Ananthapuramu. His research interests include Image Processing, Big Data and Cloud Computing and have several publications in the above fields. He did M.Tech and B.Tech in Computer Science discipline from Jawaharlal Nehru Technological University Anantapur, Ananthapuramu. He has ten years of teaching experience.
Dr. K. Madhavi, Associate Professor of CSE, Jawaharlal Nehru Technological University Anantapur College of Engineering, Ananthapuramu. She has 17 years of teaching and 11 years of Research experience. She did her Ph.D from Jawaharlal Nehru Technological University Anantapur, Ananthapuramu and is guiding several doctoral students. Her research interests include Image Processing, Wireless Networks, Big data, Cloud Computing. She has around 50 publications in reputed Journals and Conferences.