This is a repository copy of Effect of Al O nanoparticle dispersion on the specific heat ₂ ₃ capacity of a eutectic binary nitrate salt for solar power applications.
White Rose Research Online URL for this paper: http://eprints.whiterose.ac.uk/114468/
Version: Accepted Version
Article:
Hu, Y, He, Y, Zhang, Z et al. (1 more author) (2017) Effect of Al O nanoparticle dispersion ₂ ₃ on the specific heat capacity of a eutectic binary nitrate salt for solar power applications. Energy Conversion and Management, 142. pp. 366-373. ISSN 0196-8904
https://doi.org/10.1016/j.enconman.2017.03.062
© 2017 Elsevier Ltd. This manuscript version is made available under the CC-BY-NC-ND 4.0 license http://creativecommons.org/licenses/by-nc-nd/4.0/
[email protected] https://eprints.whiterose.ac.uk/
Reuse
Unless indicated otherwise, fulltext items are protected by copyright with all rights reserved. The copyright exception in section 29 of the Copyright, Designs and Patents Act 1988 allows the making of a single copy solely for the purpose of non-commercial research or private study within the limits of fair dealing. The publisher or other rights-holder may allow further reproduction and re-use of this version - refer to the White Rose Research Online record for this item. Where records identify the publisher as the copyright holder, users can verify any specific terms of use on the publisher’s website.
Takedown
If you consider content in White Rose Research Online to be in breach of UK law, please notify us by
Effect of Al
2O
3nanoparticle dispersion on the specific heat
1
capacity of a eutectic binary nitrate salt for solar power
2
applications
3
Yanwei Hu1, Yurong He1*, Zhenduo Zhang1, Dongsheng Wen2, 3 4
1, School of Energy Science & Engineering, Harbin Institute of Technology, Harbin, China, 150001 5
2, School of Aeronautic Science and Engineering, Beihang University, Beijing, China, 100191 6
3, School of Chemical and Process Engineering, University of Leeds, Leeds, U.K., LS2 9JT 7
*Corresponding author: Yurong He
8
Email: [email protected]
9
Tel. +86 0451 86413233; Fax +86 0451 86413233
10
Abstract: Molten salts can be used as heat transfer fluids or thermal storage materials
11
in a concentrated solar power plant. Improving the thermal properties can influence the
12
utilization efficiency of solar energy. In this study, the effect of doping eutectic binary
13
salt solvent with Al2O3 nanoparticles on its specific heat capacity (cp) was investigated.
14
The effects of the mass fraction of nanoparticles on the cp of the composite nanofluid
15
were analyzed, using both differential scanning calorimetry measurements and
16
molecular dynamics simulations. The specific heat capacity of the nanocomposites
17
was enhanced by increasing the nanoparticle concentration. The maximum
18
enhancement was found to be 8.3%, at a nanoparticle concentration of 2.0%. A
19
scanning electron microscope was used to analyze the material morphology. It was
20
observed that special nanostructures were formed and the specific heat capacity of the
21
nanocomposites was enhanced by increasing the quantity of nanostructures.
22
Simulation results of cp agreed well with the experimental data, and the potential
23
energy and interaction energy in the system were analyzed. The change in Coulombic
24
energy contributed to most of the large change in cp, which explains the discrepancy
25
in values between conventional nanofluids and molten salt-based nanofluids.
26
Keywords: solar energy application; nanocomposite; specific heat capacity;
27
molecular dynamics simulation; potential energy analysis
28
29
1. Introduction
31
The depletion of fossil fuels and the harmful gas emissions during the burning of
32
fossil fuels compel the search for renewable and clean energy sources and higher
33
efficiency of energy utilization [1–3]. To solve the energy crisis, some researchers
34
focus on improving heat transfer efficiency via optimizing the heat transfer surface
35
[4–7] while others tend to using high performance working media [8,9]. Meanwhile,
36
the development of renewable energy was investigated. Solar energy is regarded as
37
the best potential source to replace fossil fuels, with the average amount of energy
38
transported to the earth as sunlight in one hour able to provide all of the energy
39
currently consumed globally in one year [10]. A promising technology for the
40
collection and use of solar energy is the concentrating solar power (CSP) system,
41
which transforms solar energy to thermal energy with a heat-transfer fluid (HTF) [11].
42
Mahian et al.[12,13] used different working fluids in solar collectors and investigated
43
the thermal efficiency. In solar collectors, lower specific heat capacity will induce a
44
higher outlet temperature, increasing the solar energy utilization efficiency. However,
45
solar energy is quite unsteady and unpredictable, since it varies from day to night, by
46
cloud condition, and season. Hence, a working medium is needed to store the energy
47
when it is available and then release it when there is insufficient sunlight. Considering
48
the large amount of HTF and thermal energy storage (TES) materials required in a
49
CSP plant, it is necessary to reduce the cost of these materials while improving their
50
heat transfer and thermal storage performance. With thermal stability, comparable
51
viscosity, and low vapor pressure at high temperature, various molten salts are used in
52
modern CSP systems [14]. Solar salt, with a composition of 60% NaNO3 and 40%
53
KNO3 by weight, was used in the Solar Two central receiver systems [15] and other
54
solar plants [16]. Other molten salts are also being researched to improving the
55
thermal performance [17–19].
56
However, these molten salts also have some disadvantages that limit the
57
applicability of solar plants, for instance relatively low specific heat capacity and
58
thermal conductivity [20]. Doping base fluids with nanosized particles to make
59
nanofluids [21] is a potential way to improve their thermal properties, especially
60
thermal conductivity [22]. Wen et al. [23] reviewed the heat transfer applications of
61
nanofluids, including their formulations, influences on the effective thermal
62
conductivity, and enhancement mechanisms. In previous research, various mechanisms
63
have been identified that could enhance the effective thermal conductivities of these
materials, including the formulation of an interfacial layer, Brownian motion of the
65
nanoparticles, ballistic transport of energy carriers, and structural effects. Most of the
66
research has focused on thermal conductivity; however, the influence of nanoparticles
67
on the specific heat capacity is still unclear [24].
68
Das et al. [25,26] investigated the specific heat capacity of nanofluids using a
69
mixture of water and ethylene glycol as the base fluid. Silica, zinc oxide, and alumina
70
nanoparticles were used and results indicated that the cp decreased with an increase in
71
the nanoparticle concentration, but increased with increasing temperature. Similar
72
results were found by Zhou et al. [27] with CuO nanofluids, Zhou and Ni [28] with
73
Al2O3 nanofluids, and Elias et al. [29] with Al2O3 nanofluids. It seems that for
74
conventional nanofluids (those with water, oil, ethylene glycol, or alcohol as the base
75
fluid), the specific heat capacity is reduced by doping with nanoparticles. However,
76
with molten salt or an ionic liquid as the base fluid, the influence of adding
77
nanoparticles had the opposite effect. He et al. [30] prepared a carbonate salt/carbon
78
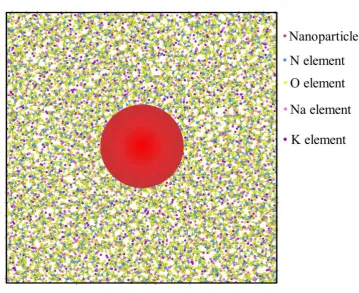
nanomaterial composite to enhance the performance of a high-temperature salt. Both
79
the specific heat capacity and thermal conductivity were significantly enhanced. Ding
80
et al. [31] prepared a mixture of solar salt and nanoparticles by mechanic grinding and
81
mixing. An enhancement of 10.48% in the specific heat capacity was obtained by
82
adding CuO nanoparticles up to a mass concentration of 0.1%. Beyond this
83
concentration, however, the enhancement worsened, and the specific heat capacity
84
deteriorated at a concentration of 1.5%. Ho and Pan [32] formulated the Hitec-based
85
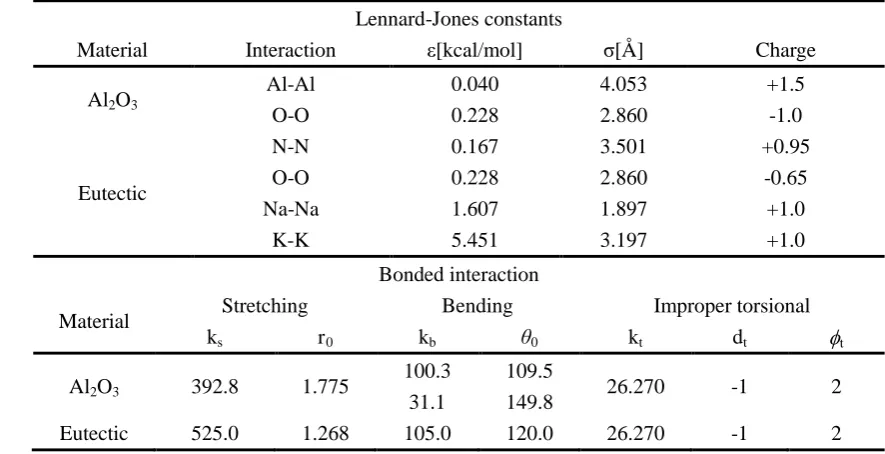
Al2O3 nanocomposite in a specially designed rid at high temperature. They studied the
86
effects of nanoparticle concentration on the specific heat capacities of nanocomposites
87
and found that the optimal concentration was 0.063% with an enhancement of 20%.
88
Jo and Banerjee [33,34] investigated the influence of graphite and multi-walled
89
carbon nanotubes (MCNT) on the specific heat capacity of a carbonate mixed salt. An
90
enhancement greater than 20% was obtained, and molecular dynamics simulations
91
(MDS) were carried out to better understand the tremendous improvement. Shin et al.
92
[35–39] performed a series investigation on carbonate salt-based SiO2
93
nanocomposites. The enhancement in the specific heat capacity varied from 5% to
94
30%, and they proposed three models to explain the enhancement: (1) a higher cp for
95
the silica nanoparticles than that of the bulk material; (2) solid-fluid interaction energy;
96
and (3) a semi-solid layer formulation of liquid molecules surrounding the
97
nanoparticles. Lu et al. [40] and Schuller et al. [41] prepared solar salt-based Al2O3
98
nanocomposites using a similar method, but obtained contrary results. The former
showed a decrease in the cp, while in the latter it was enhanced 30.6%.
100
Though several studies have reported increased specific heat capacity, the rules
101
and mechanisms involved for this increase in molten salts with nanoparticle doping
102
are still insufficient. Most explanations about the significant enhancement of cp were
103
based on some assumptions. In the present work, different mass fractions of solar
104
salt-based nanofluids were investigated using experimental measurements and
105
simulations. The nanomaterials were prepared by a dissolution method, and the specific
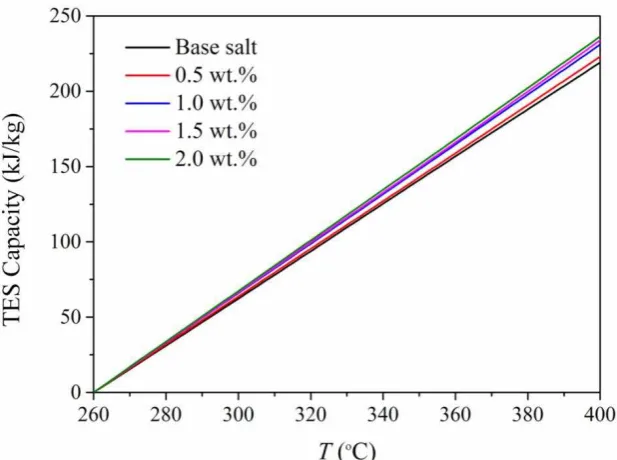
106
heat capacity was measured by a differential scanning calorimeter (DSC) using the
107
sapphire method. Material morphology analysis was conducted by a scanning electron
108
microscope. The effects of nanoparticles on the potential energy were then analyzed
109
by molecular dynamics simulations.
110
2. Experiment
111
2.1 Nanocomposite synthesis
112
In this study, we used the liquid solution method proposed by Shin et al. [36] to
113
formulate the nanocomposites. Sodium nitrate and potassium nitrate were procured
114
from Tianjin Fengchuan Chemical Reagent Technologies Co., Ltd., both with purities
115
above 99.0%. Al2O3 nanoparticles were purchased from Beijing Dk Nanotechnology
116
Co. Ltd. The average diameter was about 20 nm and the purity was 99.99%. The
117
procedure followed for obtaining the molten salt nanomaterial is illustrated in figure 1.
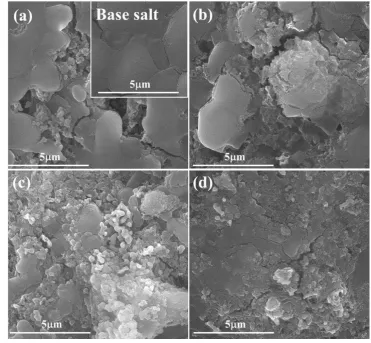
118
Initially, 5 mg of Al2O3 nanoparticles were added to 20 mL of deionized water, which
119
was then stirred for 20 min to form a suspension. Then, the suspension was sonicated
120
for 60 min in an ultrasonicator (PS-100A, Jieken Ultrasonic Cleaner Limited, China) at
121
a frequency of 40 kHz to ensure good dispersion and to minimize the potential
122
agglomeration of nanoparticles. After that, different weights of the solar salt were
123
dissolved in the suspension, so that the mass fraction of nanoparticles varied from 0.5%
124
to 2.0%. The mixture was ultrasonicated for another 60 min to guarantee uniformity of
125
the mixture. After sonication, the solution was then heated in a vacuum drying oven at
126
atmospheric pressure with a temperature setting of 110 °C, according to the research
127
of Jo [34] that evaporation temperature has little effect on the results. It was heated for
128
7 hours to obtain the dehydrated salt, which was the testing material for the DSC. All
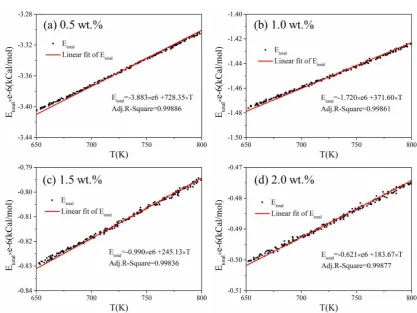
129
powders were weighed using an electronic microbalance (Sartorius MC 21S). It should
130
be noted that there is no dispersing agent used in the preparation procedure.
2.2 Measurement of specific heat capacity
132
The specific heat capacities of the samples were measured based on the sapphire
133
method using a DSC (204F1, NETZSCH). Aluminum pans were used to contain the
134
samples, and the sample masses ranged from 5 mg to 15 mg. To protect the instrument
135
from potential damage, the aluminum pans were covered with pierced lids. In the
136
sapphire method, the heat flow through an empty pan, an aluminum pan with sapphire,
137
and an aluminum pan with a prepared sample is measured. Then, using the three results
138
and the specific heat capacity of sapphire, the specific heat capacity of each sample is
139
calculated. The samples were heated to 50 °C and maintained at this temperature for 5
140
min to stabilize the calorimeter signal. A ramping rate of 20 °C/min was then applied,
141
with the end temperature set to 450 °C. The sample was maintained at 450 °C for 5 min
142
to ensure signal stability. Each sample was measured 3 times following the same
143
procedure.
144
2.3 Uncertainty analysis
145
Uncertainties in the experimental results are dependent on the measurement
146
deviations for each of the parameters, including mass and heat flow. The specific heat
147
capacity was determined by Equation (1):
148
s sapp p,s p,sapp
sapp s q m
c c
q m
(1) 149
where cp is the specific heat capacity, q is the heat flow, m is the weight, and the
150
subscripts s and sapp denote sample and sapphire. Taking f as a function of several
151
independent parameters fi, and each uncertainty as fi, then the uncertainty of the
152
experiment can be expressed as:
153
1
ln (ln )
n
i i i
f
d f f
f
(2)154
The accuracy of the electronic balance was ±0.005 mg, and the accuracy of the heat
155
flow measurement was ±0.1 W. Hence, the maximum measurement uncertainty of
156
the specific heat capacity was estimated to be 2.4%.
157
3. Molecular dynamics simulations
159
Molecular dynamics (MD) simulations were performed to explore interactions
160
between the nanoparticles and solvent molecules using the Large-scale
161
Atomic/Molecular Massively Parallel Simulator (LAMMPS) package. Initially, one
162
Al2O3 nanoparticle fixed with a diameter of 2 nm was placed in the center of the
163
simulation box and the solar salt molecules were placed randomly in the box, as
164
shown in figure 2. The length of the simulation box was varied to adjust the
165
nanoparticle mass concentration from 0% to 2.0%.
166
The Lennard-Jones (L-J) potential with long-range Coulombic force was
167
employed to calculate the interaction between two non-bonded atoms, as shown in
168
Equation (3), where E(r) is the potential of the two atoms, r is their distance from each
169
other, qi and qj are the charges on atoms i and j, respectively, is the potential well depth,
170
and is the finite distance at which the inter-particle potential is zero. The L-J
171
parameters between different atomic species were calculated by the Berthlot mixing
172
rule [42], as shown in Equation (4). In addition, bond stretching, bond bending, and
173
torsion were considered for the bonded interactions, as shown in Equation (5), where r
174
is bond length, is bond angle, is torsional angle, ks, kb, kt are stretching, bending
175
and torsional constants, respectively. All parameters used for the different atoms in the
176
MD simulation are listed in Table 1.
177
q qi j 4 12 6E r
r r r
(3)
178
,
i j i j
, ,
2
i j
i j
(4)
179
2
s 0 b 0 t
k k k 1 cos
E rr d n (5)
180
Since the solar salt molecules were randomly placed in the simulation box, it is
181
highly possible that there would be overlapping atoms, which would result in
182
non-physical interactions. Hence, an energy minimization step was implemented to
183
redistribute the atoms. During this step, the temperature of the system was reduced to
184
zero K. Afterwards, a microcanonical ensemble was used to perform the relaxation
185
procedure. Subsequently, the system temperature was raised to 650 K. A canonical
186
Nose-Hoover thermostat (NVT integration, with a constant number of atoms N,
187
volume of the system V, and temperature T controlled through direct temperature
188
scaling) was used for the temperature range from 650 to 800 K to obtain the specific
heat capacity of the system.
190
4. Results and Discussion
191
4.1 Specific heat capacity results
192
The solar salt was doped with Al2O3 nanoparticles with an average diameter of 20
193
nm at mass fractions of 0.5%, 1.0%, 1.5%, and 2.0%. To guarantee the accuracy of the
194
instrument, the melting temperature and enthalpy of Sn and Bi were measured and
195
good agreement was shown with reference values, as shown in table 2.
196
Figure 3 shows the variations in the specific heat capacities of the base salt and
197
nanocomposite mixtures in the full temperature range (80 °C to 400 °C). There are two
198
peaks in the temperature range, at about 130 °C and 227 °C, which indicate the phase
199
change temperatures. The peak at about 130 °C was formed by the solid-solid phase
200
change of the eutectic salt and the peak at about 227 °C was formed by the solid-liquid
201
phase change, agreeing with data from the literature [43] in which the respective peaks
202
were at 130.4 °C and 224.8 °C. The specific heat capacity of the base salt in the liquid
203
phase had an average value of 1.56 J/(g∙K), showing a good agreement with values in
204
the literature of 1.50 to 1.53 J/(g∙K) [44], a less than 5% error. It also can be seen that
205
the specific heat capacities of the samples changed only slightly with temperature,
206
indicating that temperature does not substantially affect the specific heat capacities of
207
these samples. In other words, the specific heat capacity is nearly independent of
208
temperature. Meanwhile, we can see that with an increase in the mass fraction of the
209
Al2O3 nanoparticles, the specific heat capacity of the samples increased.
210
Thermal energy storage (TES) capacity is an important parameter for TES systems,
211
since it influences the scope of the system and the operating cost. The TES capacity (Q)
212
was calculated as below.
213
400
260
/
C
C h T dT
Q
mdT dt
(6)214
where h is the heat flow, T is the working temperature, m is the weight of the sample,
215
and dT/dt is the heating rate. The total Q for pure base salt and after adding 0.5, 1.0, 1.5,
216
and 2.0 wt.% nanoparticles were 219.03, 223.01, 231.07, 233.84, and 236.32 kJ/kg in
217
the working temperature range of 260–400 °C, respectively. This indicates that the Q
218
value of the nanocomposite with ~2.0 wt.% nanoparticles has a maximum increase of
219
17.29 kJ/kg. Figure 4 plots Q versus temperature for pure base salt and after adding
different amounts of nanoparticles. With increasing the nanoparticle mass fraction, the
221
TES capacity increases in the working temperature range of 260–400 °C.
222
Usually, the specific heat capacity of the mixture is calculated using a simple
223
mixing model. The mixing model is based on the assumption of thermal equilibrium
224
between the particles and fluid and can be expressed as:
225
np p,np s p,s p,nf
nf
m c m c
c
m
(7)
226
where cp is the specific heat capacity, m is the mass, and the subscripts nf, np, and s
227
denote the property values of the nanofluid, nanoparticle, and salt, respectively. The
228
specific heat capacity of the base salt and Al2O3 particles are 1.56 J/(g∙K) and 1.12
229
J/(g∙K), respectively, as measured in present work. Figure 5 shows a comparison
230
between the experimental value and the value predicted by the simple mixing model.
231
The measured average specific heat capacity of the base salt and nanocomposites,
232
from lowest to highest concentration, were 1.56 J/(g∙K), 1.59 J/(g∙K), 1.65 J/(g∙K),
233
1.67 J/(g∙K), and 1.69 J/(g∙K), respectively. This indicates that the specific heat
234
capacity of the nanocomposite with an Al2O3 particle concentration of about 2.0% by
235
weight has a maximum enhancement of about 8.3%. However, the prediction values
236
decreased with an increase in the nanoparticle mass fraction, indicating that the
237
simple mixing model is not applicable in the evaluation of the specific heat capacity
238
of a nanocomposite.
239
4.2 Material Characterization
240
Since the specific heat capacity has a close relationship with the phase or
241
structure of the material, scanning electron microscope (SEM) (Quanta 200FEG) was
242
used to perform material characterization analyses. Figure 6 shows an SEM image of
243
the salt with various concentrations of nanoparticles after the DSC measurement. The
244
surface of the base salt was relatively smooth and had few visible structures. With the
245
addition of nanoparticles, some punctate and nubby microstructures appear (Figure 6
246
a). Adding more nanoparticles (Figure 6 b, c, and d) increases the quantity of these
247
microstructures and decreases the structure size. This kind of microstructure results in
248
an increase of the surface area. Due to the mismatch of vibrational density of states
249
between liquid and solid phase, there will be an interfacial thermal resistance, well
250
known as Kapitza resistance [45]. With the increase of the surface area, the total
251
interfacial thermal resistance will increase significantly [46,47], which will provide
252
additional thermal storage being responsible for enhancing the specific heat capacity.
4.3 Molecular dynamics simulations
254
To verify the accuracy of the MD simulations, the densities and cp values of the
255
solar salt mixed with different mass concentrations of nanoparticles were calculated.
256
Figure 7 shows the comparison of density results from the MD simulation system and
257
theoretical calculation using Equation (8). Good agreement was obtained.
258
nf p 1 f
(8)
259
where is the volume fraction of nanoparticles and the subscripts p and f denote the
260
nanoparticles and fluid, respectively.
261
In figure 8, it can be seen that the total energy of the ensemble changes linearly
262
with temperature for various nanoparticle mass concentrations, with an Adj. R2 >
263
0.998. Hence, the cp of the solar salt-based nanofluid is almost constant in the
264
temperature range of 650-800 K.
265
The specific heat capacity, cp, is calculated as:
266
p
E c
T V
(9)
267
where E is the energy change, T is the temperature change, V is the volume, and is
268
the density of the ensemble. Figure 9 shows the experimental and simulated cp values
269
with different nanoparticle mass concentrations. Acceptable agreement was
270
obtained—for pure base salt, cp obtained from the MD simulation was 1.491 J/(g∙K)
271
with an error of about -4.42% compared with the experimental value of 1.56 J/(g∙K).
272
The same trend with nanoparticle concentration was also obtained: cp increased with
273
increasing nanoparticle mass concentration, and at 2.0 wt.% nanoparticles, the cp
274
enhancements were 6.24% and 8.33%, respectively, for the simulation and
275
experiment.
276
In order to explain this unusual enhancement of the cp, we analyzed the energy
277
components and interaction for each atomic type (figure 10) in the simulation. The
278
energy of each atom can be divided into two parts: the kinetic energy (Eke) and the
279
potential energy (Epe), as shown in Equation (10).
280
ke pe
EE E (10)
281
where the potential energy is composed of Van der Waals energy (Evdw), Coulombic
282
energy (Ecoul), long-range k-space energy (Elong), and molecular energy (Emol). From
283
Figure 10, we can see that there was no significant change for Eke, Evdw, andElong,
284
while Epe increased with the nanoparticle mass concentration due to the increase of
Ecoul and Emol. In other words, adding nanoparticles does not change the movement of
286
molecules, the interaction potential between two atoms and the energy in k space.
287
Figure 10 (b) shows the energy of three different intermolecular interactions in NO3-.
288
All of them change only slightly, indicating that the influence of added nanoparticles
289
on the molecular structure of NO3- is negligible. Hence, the slight increase in Emol per
290
atom is due to the high molecular energy of Al2O3. Only the Coulombic energy
291
change significantly for different nanoparticle mass fractions. Hence, the
292
enhancement of cp is mainly due to the increase of the Coulombic energy, which can
293
also explain the different effects on cp from adding nanoparticles to conventional base
294
fluids and molten salts. Since there are more ions in molten salt, the influence of the
295
Coulombic force is more significant.
296
Conclusion
297
In this study, the specific heat capacities of a binary nitrate salt and
298
nanocomposites with different mass fractions of added nanoparticles (0, 0.5, 1.0, 1.5,
299
and 2.0 wt.%, respectively) were investigated. The nanocomposites were synthesized
300
using a solution method. DSC was employed to measure the specific heat capacity.
301
Results show that the enhancement of the specific heat capacity of nanocomposites
302
ranges from 1.9% to 8.3% with an increase in the mass fraction of added
303
nanoparticles. The simple mixing model failed to predict the specific heat capacity of
304
the molten salt-based nanofluids. Material characterization analyses were carried out
305
using SEM. From the SEM images, we can see the formulation of punctate or nubby
306
nanostructures, which may induce the enhancement of specific heat capacity through
307
the enlarged specific surface area. The influence of nanoparticles on the energy
308
components of each atomic type was analyzed by molecular dynamics simulations.
309
Results indicate that the change in Coulombic energy per atom contributes the
310
greatest portion of the enhanced cp.
311
Acknowledgements
312
This work is financially supported by the National Natural Science Foundation of
313
China (Grant No. 51676060), the Science Creative Foundation for Distinguished
314
Young Scholars in Heilongjiang (Grant No. JC2016009), the Science Creative
315
Foundation for Distinguished Young Scholars in Harbin (Grant No. 2014RFYXJ004)
316
and the Fundamental Research Funds for the Central Universities (Grant No. HIT.
BRETIV. 201315).
318
References
319
[1] Owusu PA, Asumadu-Sarkodie S. A review of renewable energy sources, sustainability issues
320
and climate change mitigation. Cogent Eng 2016;3:1–14. doi:10.1080/23311916.2016.1167990.
321
[2] Kim MH, Kim H, Lee KS, Kim DR. Frosting characteristics on hydrophobic and
322
superhydrophobic surfaces: A review. Energy Convers Manag 2017;138:1–11.
323
doi:10.1016/j.enconman.2017.01.067.
324
[3] Mahian O, Kianifar A, Kalogirou SA, Pop I, Wongwises S. A review of the applications of
325
nanofluids in solar energy. Int J Heat Mass Transf 2013;57:582–94.
326
doi:10.1016/j.ijheatmasstransfer.2012.10.037.
327
[4] Kim MH, Kim H, Kim DR, Lee KS. A novel louvered fin design to enhance thermal and
328
drainage performances during periodic frosting/defrosting conditions. Energy Convers Manag
329
2016;110:494–500. doi:10.1016/j.enconman.2015.11.028.
330
[5] Kundu B, Lee KS. Effects of psychrometric properties on fin performances of minimum
331
envelope shape of wet fins. Energy Convers Manag 2016;110:481–93.
332
doi:10.1016/j.enconman.2015.09.054.
333
[6] Park SJ, Jang D, Yook SJ, Lee KS. Optimization of a chimney design for cooling efficiency of a
334
radial heat sink in a LED downlight. Energy Convers Manag 2016;114:180–7.
335
doi:10.1016/j.enconman.2016.02.024.
336
[7] Jang D, Park SJ, Lee KS. Thermal performance of a PCB channel heat sink for LED light bulbs.
337
Int J Heat Mass Transf 2015;89:1290–6. doi:10.1016/j.ijheatmasstransfer.2015.06.027.
338
[8] Mahian O, Kianifar A, Sahin AZ, Wongwises S. Performance analysis of a minichannel-based
339
solar collector using different nanofluids. Energy Convers Manag 2014;88:129–38.
340
doi:10.1016/j.enconman.2014.08.021.
341
[9] Meibodi SS, Kianifar A, Mahian O, Wongwises S. Second law analysis of a nanofluid-based
342
solar collector using experimental data. J Therm Anal Calorim 2016;126:617–25.
343
doi:10.1007/s10973-016-5522-7.
344
[10] Crabtree GW, Lewis NS. Solar energy conversion. Phys Today 2007;60:37–42.
345
doi:10.1063/1.2718755.
346
[11] Price H, L̈pfert E, Kearney D, Zarza E, Cohen G, Gee R, et al. Advances in parabolic trough
347
solar power technology. J Sol Energy Eng 2002;124:109. doi:10.1115/1.1467922.
348
[12] Salavati S, Kianifar A, Niazmand H, Mahian O, Wongwises S. Experimental investigation on the
349
thermal efficiency and performance characteristics of a flat plate solar collector using SiO2/EG–
350
water nanofluids. Int Commun Heat Mass Transf 2015;c:71–5.
351
doi:10.1016/j.icheatmasstransfer.2015.02.011.
352
[13] Mahian O, Kianifar A, Sahin AZ, Wongwises S. Entropy generation during Al2O3/water
353
nanofluid flow in a solar collector: Effects of tube roughness, nanoparticle size, and different
354
thermophysical models. Int J Heat Mass Transf 2014;78:64–75.
355
doi:10.1016/j.ijheatmasstransfer.2014.06.051.
356
[14] Lu J, Yu T, Ding J, Yuan Y. Thermal storage performance of molten salt thermocline system
357
with packed phase change bed. Energy Convers Manag 2015;102:267–74.
358
doi:10.1016/j.enconman.2014.10.049.
[15] Peng Q, Yang X, Ding J, Wei X, Yang J. Design of new molten salt thermal energy storage
360
material for solar thermal power plant. Appl Energy 2013;112:682–9.
361
doi:10.1016/j.apenergy.2012.10.048.
362
[16] Zhang HL, Baeyens J, Degrève J, Cacères G. Concentrated solar power plants: Review and
363
design methodology. Renew Sustain Energy Rev 2013;22:466–81.
364
doi:10.1016/j.rser.2013.01.032.
365
[17] Boerema N, Morrison G, Taylor R, Rosengarten G. Liquid sodium versus Hitec as a heat transfer
366
fluid in solar thermal central receiver systems. Sol Energy 2012;86:2293–305.
367
doi:10.1016/j.solener.2012.05.001.
368
[18] Dunn RI, Hearps PJ, Wright MN. Molten-salt power towers: Newly commercial concentrating
369
solar storage. Proc. IEEE, vol. 100, 2012, p. 504–15. doi:10.1109/JPROC.2011.2163739.
370
[19] Jo B, Banerjee D. Effect of solvent on specific heat capacity enhancement of binary molten
371
salt-based carbon nanotube nanomaterials for thermal energy storage. Int J Therm Sci
372
2015;98:219–27. doi:10.1016/j.ijthermalsci.2015.07.020.
373
[20] Ye F, Ge Z, Ding Y, Yang J. Multi-walled carbon nanotubes added to Na2CO3/MgO composites
374
for thermal energy storage. Particuology 2014;15:56–60. doi:10.1016/j.partic.2013.05.001.
375
[21] Choi SUS, Eastman JA. Enhancing thermal conductivity of fluids with nanoparticles. ASME Int.
376
Mech. Eng. Congr. Expo., vol. 66, 1995, p. 99–105. doi:10.1115/1.1532008.
377
[22] Sadeghinezhad E, Mehrali M, Saidur R, Mehrali M, Tahan Latibari S, Akhiani AR, et al. A
378
comprehensive review on graphene nanofluids: Recent research, development and applications.
379
Energy Convers Manag 2016;111:466–87. doi:10.1016/j.enconman.2016.01.004.
380
[23] Wen D, Lin G, Vafaei S, Zhang K. Review of nanofluids for heat transfer applications.
381
Particuology 2009;7:141–50. doi:10.1016/j.partic.2009.01.007.
382
[24] Sekhar YR, Sharma K V. Study of viscosity and specific heat capacity characteristics of
383
water-based Al2O3 nanofluids at low particle concentrations. J Exp Nanosci 2017;10:86–102.
384
doi:10.1080/17458080.2013.796595.
385
[25] Namburu PK, Kulkarni DP, Dandekar A, Das DK. Experimental investigation of viscosity and
386
specific heat of silicon dioxide nanofluids. Micro Nano Lett 2007;2:67 –71. doi:10.1049/mnl.
387
[26] Vajjha RS, Das DK. Specific heat measurement of three nanofluids and development of new
388
correlations. J Heat Transfer 2009;131:71601. doi:10.1115/1.3090813.
389
[27] Wang BX, Zhou LP, Peng XF, Du XZ, Yang YP. On the specific heat capacity of CuO nanofluid.
390
Adv Mech Eng 2010;2010. doi:10.1155/2010/172085.
391
[28] Zhou SQ, Ni R. Measurement of the specific heat capacity of water-based Al2O3 nanofluid. Appl
392
Phys Lett 2008;92:93123. doi:10.1063/1.2890431.
393
[29] Elias MM, Mahbubul IM, Saidur R, Sohel MR, Shahrul IM, Khaleduzzaman SS, et al.
394
Experimental investigation on the thermo-physical properties of Al2O3 nanoparticles suspended
395
in car radiator coolant. Int Commun Heat Mass Transf 2014;54:48–53.
396
doi:10.1016/j.icheatmasstransfer.2014.03.005.
397
[30] Tao YB, Lin CH, He YL. Preparation and thermal properties characterization of carbonate
398
salt/carbon nanomaterial composite phase change material. Energy Convers Manag
399
2015;97:103–10. doi:10.1016/j.enconman.2015.03.051.
400
[31] Lasfargues M, Geng Q, Cao H, Ding Y. Mechanical dispersion of nanoparticles and its effect on
401
the specific heat capacity of impure binary nitrate salt mixtures. Nanomaterials 2015;5:1136–46.
402
doi:10.3390/nano5031136.
[32] Ho MX, Pan C. Optimal concentration of alumina nanoparticles in molten Hitec salt to maximize
404
its specific heat capacity. Int J Heat Mass Transf 2014;70:174–84.
405
doi:10.1016/j.ijheatmasstransfer.2013.10.078.
406
[33] Jo B, Banerjee D. Enhanced specific heat capacity of molten salt-based nanomaterials: Effects of
407
nanoparticle dispersion and solvent material. Acta Mater 2014;75:80–91.
408
doi:10.1016/j.actamat.2014.05.005.
409
[34] Jo B, Banerjee D. Effect of dispersion homogeneity on specific heat capacity enhancement of
410
molten salt nanomaterials using carbon nanotubes. J Sol Energy Eng 2014;137:11011.
411
doi:10.1115/1.4028144.
412
[35] Shin D, Banerjee D. Enhanced thermal properties of SiO2 nanocomposite for solar thermal
413
energy storage applications. Int J Heat Mass Transf 2015;84:898–902.
414
doi:10.1016/j.ijheatmasstransfer.2015.01.100.
415
[36] Shin D, Banerjee D. Enhanced specific heat of silica nanofluid. J Heat Transfer 2011;133:24501.
416
doi:10.1115/1.4002600.
417
[37] Shin D, Banerjee D. Enhanced specific heat capacity of nanomaterials synthesized by dispersing
418
silica nanoparticles in eutectic mixtures. J Heat Transfer 2013;135:32801.
419
doi:10.1115/1.4005163.
420
[38] Tiznobaik H, Shin D. Experimental validation of enhanced heat capacity of ionic liquid-based
421
nanomaterial. Appl Phys Lett 2013;102:173906. doi:doi:http://dx.doi.org/10.1063/1.4801645.
422
[39] Tiznobaik H, Shin D. Enhanced specific heat capacity of high-temperature molten salt-based
423
nanofluids. Int J Heat Mass Transf 2013;57:542–8.
424
doi:10.1016/j.ijheatmasstransfer.2012.10.062.
425
[40] Lu MC, Huang CH. Specific heat capacity of molten salt-based alumina nanofluid. Nanoscale
426
Res Lett 2013.
427
[41] Schuller M, Shao Q, Lalk T. Experimental investigation of the specific heat of a nitrate–alumina
428
nanofluid for solar thermal energy storage systems. Int J Therm Sci 2015;91:142–5.
429
doi:10.1016/j.ijthermalsci.2015.01.012.
430
[42] Li L, Zhang Y, Ma H, Yang M. An investigation of molecular layering at the liquid-solid
431
interface in nanofluids by molecular dynamics simulation. Phys Lett A 2008;372:4541–4.
432
doi:10.1016/j.physleta.2008.04.046.
433
[43] Xiao J, Huang J, Zhu P, Wang C, Li X. Preparation, characterization and thermal properties of
434
binary nitrate salts/expanded graphite as composite phase change material. Thermochim Acta
435
2014;587:52–8. doi:10.1016/j.tca.2014.04.021.
436
[44] Betts MR. The effects of nanoparticle augmentation of nitrate thermal storage materials for use
437
in concentrating solar power applications. A Thesis Maeter Sci 2011.
438
[45] Pollack GL. Kapitza Resistance. Rev Mod Phys 1969;41:48–81.
439
doi:10.1103/RevModPhys.41.48.
440
[46] Zain-ul-abdein M, Raza K, Khalid FA, Mabrouki T. Numerical investigation of the effect of
441
interfacial thermal resistance upon the thermal conductivity of copper/diamond composites.
442
Mater Des 2015;86:248–58. doi:10.1016/j.matdes.2015.07.059.
443
[47] Hu H, Sun Y. Effect of nanopatterns on Kapitza resistance at a water-gold interface during
444
boiling: A molecular dynamics study. J Appl Phys 2012;112:53508. doi:10.1063/1.4749393.
445 446
Figures list
448
Fig. 1 Nanocomposite preparation procedure
449
Fig. 2 Simulation domain showing an Al2O3 nanoparticle surrounded by solar salt
450
molecules
451
Fig. 3 Variation in cp with temperature for the pure base salt and at different
452
nanoparticle mass concentrations (0.5%, 1.0%, 1.5%, and 2.0%)
453
Fig. 4 Variation of TES capacity with temperature, for pure base salt and after adding
454
different amounts of nanoparticles.
455
Fig. 5 Comparison of average experimental cp values and the values predicted by the
456
simple mixing model
457
Fig. 6 SEM images of the salt with various nanoparticle concentrations after DSC
458
measurement: (a) 0.5 wt.%,(b) 1.0 wt.%, (c) 1.5 wt.%, and (d) 2.0 wt.%.
459
Fig. 7 Comparison between simulations and theoretical calculations of the densities of a
460
solar salt mixed with nanoparticles
461
Fig. 8 Total energy of the ensemble versus temperature: (a) 0.5 wt.%,(b) 1.0 wt.% 3, (c)
462
1.5 wt.%, and (d) 2.0 wt.%
463
Fig. 9 Experimental and simulated cp values with different nanoparticle mass
464
concentrations in the salts
465
Fig. 10 Potential and interaction energy analysis in the nanofluid system at 650 K
466
467 468
469 470 471
472 473
474 475 476
477 478
479 480 481
483
[image:16.595.73.502.151.695.2]484
Fig. 1 Nanocomposite preparation procedure 485
486 487 488
489
[image:16.595.138.498.400.693.2]490
Fig. 2 Simulation domain showing an Al2O3 nanoparticle surrounded by solar salt molecules 491
492
494
495
[image:17.595.131.469.107.364.2]496
Fig. 3 Variation in cp with temperature for the pure base salt and at different nanoparticle mass 497
concentrations (0.5%, 1.0%, 1.5%, and 2.0%) 498
499
500
501
Fig. 4 Variation of TES capacity with temperature, for pure base salt and after adding different 502
amounts of nanoparticles. 503
[image:17.595.156.465.447.677.2]506
Fig. 5 Comparison of average experimental cp values and the values predicted by the simple 507
mixing model 508
509
510
Fig. 6 SEM images of the salt with various nanoparticle concentrations after DSC measurement: 511
[image:18.595.111.483.371.714.2]513
[image:19.595.130.463.91.346.2]514
Fig. 7 Comparison between simulations and theoretical calculations of the densities of a solar salt 515
mixed with nanoparticles 516
517
518
Fig. 8 Total energy of the ensemble versus temperature: (a) 0.5 wt.%,(b) 1.0 wt.% 3, (c) 1.5 wt.%, 519
[image:19.595.87.505.410.723.2]521
522
[image:20.595.130.467.111.346.2]523
Fig. 9 Experimental and simulated cp values with different nanoparticle mass concentrations in the 524
salts 525
526
527
Fig. 10 Potential and interaction energy analysis in the nanofluid system at 650 K 528
529
530 531
532 533
534 535 536
537 538
[image:20.595.83.506.416.567.2]540
[image:21.595.58.512.77.787.2]541
Table 1 Simulation parameters for the MD simulation 542
Lennard-Jones constants
Material Interaction [kcal/mol] [Å] Charge
Al2O3
Al-Al 0.040 4.053 +1.5
O-O 0.228 2.860 -1.0
Eutectic
N-N 0.167 3.501 +0.95
O-O 0.228 2.860 -0.65
Na-Na 1.607 1.897 +1.0
K-K 5.451 3.197 +1.0
Bonded interaction
Material Stretching Bending Improper torsional
ks r0 kb 0 kt dt t
Al2O3 392.8 1.775
100.3 109.5
26.270 -1 2
31.1 149.8
Eutectic 525.0 1.268 105.0 120.0 26.270 -1 2
543
544
545
546
547
548
549
550
551
Table 2 Experimental validation 552
Sample Melting temperature (°C) Enthalpy (J/g)
Experiment Reference Error Experiment Reference Error
Sn 232.2 231.9 0.13% 59.28 60.5 -2.02%
Bi 271.7 271.4 0.11% 52.12 53.1 -1.85%
553
554
555
556
557
558
559
[image:21.595.68.511.123.350.2]561
562
Nomenclature
Symbol Meaning
cp specific heat capacity, J/(gK)
q heat flow, W
m weight, kg
E potential energy, J
r distance between two atoms,
q charge of atom, C
k constant
d sign convention constant
T temperature, K
V volume, m3
Q thermal energy storage capacity, J/g
h heat flow, mW/mg
Greek symbols
potential well depth, kcal/mol
finite distance for zero inter-particle potential, angle value, degrees
volume fraction, -
torsional angle, degrees
density, g/cm3
Subscripts
s sample
sapp sapphire
b bending
t torsional
563