This is a repository copy of Empirically derived cut-points for sedentary behaviour: are we
sitting differently?.
White Rose Research Online URL for this paper: http://eprints.whiterose.ac.uk/105883/
Version: Accepted Version
Article:
Clarke-Cornwell, AM, Farragher, TM orcid.org/0000-0002-1968-6378, Cook, PA et al. (1 more author) (2016) Empirically derived cut-points for sedentary behaviour: are we sitting differently? Physiological Measurement, 37 (10). pp. 1669-1685. ISSN 0967-3334
https://doi.org/10.1088/0967-3334/37/10/1669
© 2016 Institute of Physics and Engineering in Medicine. This is an author-created,
un-copyedited version of an article accepted for publication in Physiological Measurement. The publisher is not responsible for any errors or omissions in this version of the
manuscript or any version derived from it. The Version of Record is available online at http://dx.doi.org/10.1088/0967-3334/37/10/1669. Uploaded in accordance with the publisher's self-archiving policy.
[email protected] https://eprints.whiterose.ac.uk/
Reuse
Unless indicated otherwise, fulltext items are protected by copyright with all rights reserved. The copyright exception in section 29 of the Copyright, Designs and Patents Act 1988 allows the making of a single copy solely for the purpose of non-commercial research or private study within the limits of fair dealing. The publisher or other rights-holder may allow further reproduction and re-use of this version - refer to the White Rose Research Online record for this item. Where records identify the publisher as the copyright holder, users can verify any specific terms of use on the publisher’s website.
Takedown
If you consider content in White Rose Research Online to be in breach of UK law, please notify us by
Empirically derived cut-points for sedentary behaviour: are we sitting differently?
Alexandra M. Clarke-Cornwell1
Tracey M. Farragher2
Penny A. Cook1
Malcolm H. Granat1
Author information:
1School of Health Sciences, University of Salford, Salford, UK
2Leeds Institute of Health Sciences, University of Leeds, Leeds, UK
Address for correspondence: Alexandra Clarke-Cornwell, School of Health Sciences, Room
L828, Allerton Building, University of Salford, M6 6PU, UK; Telephone: 0161 295 2805;
Abstract
Purpose: Sedentary behaviour (SB) is associated with a number of adverse health outcomes.
Studies that have used accelerometers to define sedentary time tend to use a threshold of
<100 counts per minute (cpm) for classifying SB; however, this cut-point was not empirically
derived for adults. It is not known whether accelerometer cut-points for SB differ depending
on the context in which it occurs. We aimed to: 1) empirically derive an optimal threshold for
classifying SB, using the cpm output from the ActiGraph GT3X+, compared to the sedentary
classification from the activPAL3™; and 2) ascertain whether this varied by day of the week
and in working time versus non-working time.
Methods: A convenience sample of 30 office-based university employees (10 males, 20
females; age 40.47±10.95 years; BMI 23.93±2.46 kg/m2) wore the ActiGraph GT3X+ and
activPAL3™ devices simultaneously for seven days. Data were downloaded in one minute
epochs and non-wear time was removed. Generalised estimating equations were used to make
minute by minute comparisons of sedentary time from the two devices, using sitting from the
activPAL3™ as the criterion measure.
Results: After data reduction participants provided on average 11 hours 58 minutes of data
per day. The derived cut-points from the models were significantly higher on a Saturday
(97cpm) compared to weekdays (60cpm) and Sunday (57cpm). Derived cpm for sedentary
time during working time were significantly lower compared to non-working time (35
[95%CI 30-41] vs. 73 [54-113]). Compared to the 100cpm and 150cpm thresholds, the
empirically derived cut-points were not significantly different in terms of
area-under-the-curve, but had lower mean bias for each day of the week and for working and non-working
Conclusion: Accelerometer cut-points for SB can depend on day and also domain,
suggesting that the nature of sitting differs depending on the context in which sedentary time
is accrued.
Keywords:
accelerometers, objective measurement, physical inactivity, threshold, workplace, sedentary
Introduction
Sedentary behaviour (defined as any waking behaviour in a sitting or reclining position, with
energy expenditure ≤1.5 METs (Sedentary Behaviour Research Network [SBRN] 2012)) is
associated with a number of health outcomes (Owen et al 2010), including: metabolic
syndrome risk factors (Hamilton et al 2007, Stamatakis et al 2012); obesity (Hu et al 2003);
type 2 diabetes (Hu et al 2003); back pain (Chen et al 2009); and mortality (in particular from
cardiovascular disease and cancer) (Katzmarzyk et al 2009, van der Ploeg et al 2012). Many
of these correlates of sedentary behaviour and health-related outcomes have been shown to be
independent of moderate to vigorous physical activity levels (Owen et al 2010). The extent to
which this apparent effect of sedentary behaviour is an artefact of the way physical activity is
incorporated into the analysis models is unclear, since a recent study that adjusted for total
physical activity (including light physical activity) showed that sedentary behaviour was not
an independent risk factor for cardio-metabolic biomarkers (Maher et al 2014). A
compositional analysis by Chastin et al (2015) showed that the distribution of time spent in
sedentary behaviour, co-dependent with time spent sleeping, and in light- and moderate to
vigorous physical activity, was associated with some, but not all cardio-metabolic
biomarkers. There is a need to further improve how we measure sedentary behaviour and
light physical activity.
Many studies that have found associations between sedentary behaviours and health-related
outcomes have primarily measured self-reported sedentary time based on leisure time (i.e.
television time) (Thorp et al 2010), or self-reported total sedentary time (Proper et al 2007).
Subjective measures of sedentary behaviour are limited by: underestimates of sedentary time
(Clemes et al 2012, Rosenberg et al 2010); recall limitations in questionnaires; and tend to
Objective measures of sedentary behaviour, such as those obtained from the use of
accelerometer-based devices (Matthews et al 2008, Healy et al 2016, Dunstan et al 2012), are
able to examine duration, frequency and intensity of activities, including how much time is
spent at a predetermined level of activity using different thresholds.
Matthews et al. (Matthews et al 2008) were the first to describe time spent in sedentary
behaviours using an objective measure of sedentary time, for participants in the National
Health and Nutrition Examination Survey (NHANES). The accelerometer-based device used
in their study was the ActiGraph 7164; the magnitude of the acceleration measured by an
ActiGraph device within a specified epoch is converted to a count using a proprietary
algorithm, as an approximation for energy expenditure. Sedentary behaviour was defined as
less than100 counts per minute (cpm). This cut-point had been based on a study that defined
sedentary behaviour thresholds in a sample of adolescent girls (age 13-14 years old) (Treuth
et al 2004a). The aim of the study by Treuth et al (2004a) was to define a regression equation
to estimate energy expenditure (metabolic equivalent) from accelerometer counts using the
ActiGraph 7164 device, and to define thresholds of these counts for different activity levels
(including sedentary behaviour). Although the 100 cpm cut-point has been widely used in
adult sedentary behaviour studies it should be noted that: (i) it was derived from an
adolescent female population; it is known that activity behaviour differs between adults and
children, with children tending to carry out activity in short and sporadic bursts compared to
adults (Welk et al 2000), and an increase in sitting time with increasing age (Matthews et al
2008); (ii) it was derived from two screen based leisure activities (TV viewing and playing
computer games), that are not representative of sedentary time in adults; (iii) the counts from
the study by Treuth et al (2004a) were recorded in 30 second epochs; the relationship
count thresholds from 30 second to 60 second epochs, would lead to “considerable error in
total estimates” (Aguilar-Farías et al 2013).
There is limited evidence in adults on the validity of the <100 cpm used to define sedentary
time, especially in newer models of the ActiGraph accelerometer. In a study of 20 overweight
office workers (mean body mass index [BMI] 33.7 kg/m2), Kozey-Keadle et al (2011)
suggested that 150 cpm may be a more appropriate cut-point to define sedentary behaviour,
when compared to direct observation. This is comparable to an ActiGraph calibration study,
by Lopes et al (2009) that also found a higher threshold (200 cpm) for sedentary behaviour in
obese and overweight patients (mean BMI 31.0 kg/m2) (Lopes et al 2009). Crouter et al
(2006) proposed an arbitrary cut-point of 50 cpm to distinguish sedentary behaviour from
light physical activity, in a cohort of working age adults (mean BMI 24.2 kg/m2). In contrast,
a study of older adults (mean age 73.5 years), found that a much lower threshold (<25 cpm,
based on the activPAL3™ sedentary behaviour classification) may be more appropriate to
define sedentary behaviour in an older age group (Aguilar-Farías et al 2013). These studies
suggest that it may be appropriate to have different cut-points dependent on BMI and age
(Owen et al 2010).
It has been suggested that sedentary time in the work and leisure domains may represent
differing associations with health outcomes (Pinto Pereira et al 2012). Given that there is so
much variation between the accelerometer cut points derived for different populations, it is
reasonable to assume that different contexts may also lead to different thresholds. There has
been no empirically derived accelerometer cut-points for sedentary behaviour in adults, and
therefore the primary aim of this study was to empirically derive an optimal threshold for
accelerometer, when compared to the sedentary classification from the activPAL™
accelerometer in a free-living environment. The activPAL™ device, which is used to classify
posture, has been shown to be a valid measure when distinguishing between sitting/lying,
standing and locomotion in everyday activities (Kozey-Keadle et al 2011, Grant et al 2006).
It is important to be able to accurately measure sedentary behaviour on different days (i.e.
work and work) (Proper et al 2007), and also in different domains (i.e. working and
non-working hours) (Thorp et al 2012, Clemes et al 2014); and consequently, a secondary aim
was to ascertain whether thresholds for sedentary behaviour cut-points varied by day of the
week and in working time versus non-working time.
Methods
A convenience sample of 30 employees/post graduate students (healthy volunteers that spend
most of their ‘working day’ sitting) from the University of Salford were asked to participate
in the study. Prior to the study commencement, ethics approval was granted by the College of
Health and Social Care Ethical Approval Panel at the University of Salford, and participants
provided written informed consent.
Accelerometers
The ActiGraph GT3X+ accelerometer is a small (4.6x3.3x1.5cm), light-weight (19g)
instrument that records acceleration in the vertical, antero-posterior and medio-lateral axes,
worn at the waist (ActiGraph LLC, Pensacola, Florida). To ensure the outcomes of this study
were analogous with other generations of ActiGraph devices, only the accelerations on the
vertical axis were analysed (Thorp et al 2012, Matthews et al 2008, Maher et al 2014,
Stamatakis et al 2012). These accelerations are integrated, using a proprietary algorithm, as
The activPAL3™ is a small, light-weight (15g) accelerometer-based device that is attached to
the anterior aspect of the thigh (PAL Technologies Ltd, Glasgow, Scotland). Data from this
instrument classifies activities into sedentary (sitting/lying), standing and stride events.
Consecutive stride events are combined to give walking events. The output from the
activPAL™ has been validated for classification of sedentary, upright, standing and walking
activities in a range of populations including older adults (Grant et al 2006, 2008), and is an
accurate device to measure sedentary behaviour in a free-living environment (Kozey-Keadle
et al 2011, Baumgartner et al 2015).
Procedure
Participants were asked to wear the ActiGraph GT3X+ and the activPAL3™ devices,
simultaneously for seven days. The ActiGraph GT3X+ was worn during all waking hours;
the activPAL3™ was worn continuously for 24 hours a day and was only removed for
bathing or swimming. The ActiGraph GT3X+ was worn on the right hip (on the midaxillary
line), attached with an adjustable belt; the activPAL3™ was attached to the front
(middle-anterior line) of the right thigh (with hypoallergenic double-sided adhesive pad). Participants
were asked to record their sleeping hours in an activity diary; they were also asked to record
their working hours, and if either accelerometer was removed, the time it was removed and
the reason it was removed.
Data cleaning and data reduction
The data from both device types were downloaded using the manufacturer’s software, and
imported into Stata, where all data cleaning, reduction and analysis was carried out
LP). The data from the ActiGraph GT3X+ device were downloaded using the ActiLife
v5.10.0 software by ActiGraph, using the low-frequency extension for 60 second epochs
(Cain et al 2013); the cpm from the vertical axis were transferred to Stata along with the date
and time variables. The data from the activPAL3™ device were downloaded using the
activPAL(tm) v7.2.29 software by PAL Technologies Ltd; the time, interval and activity
variables were transferred from the events file to Stata (Edwardson et al 2016). To ensure that
data related to only genuine wear time a number of decision rules were implemented. An
automated program was written in Stata to match the 60 second epoch data from both devices
and to derive non-wear time for all participants; the rules for deleting non-wear time were
implemented in the following order: (i) the first five minutes after both devices were attached
were deleted, and conversely the five minutes prior to at least one device being removed were
also deleted (reasons accelerometers were removed included sleeping, bathing and
swimming); (ii) using the activity diary, for any recorded periods of cycling or attending the
gym, the period was removed together with the ten minutes before and the ten minutes after
the stated period. Due to the lack of movement of the body’s core when cycling, using gym
equipment (e.g. rowing machine) and resistance training, the accelerometer may not
accurately measure these activities (Welk et al 2000); (iii) the Troiano automated algorithm
was used to remove further non-wear time; this was defined as bouts of ≥60 minutes of
consecutive zero counts from the ActiGraph GT3X+, allowing interruptions of up to two
counts of non-zero counts (less than or equal to 100cpm) (Troiano et al 2008); (iv) sedentary
bouts longer than 120 minutes from the activPAL3™ were also assumed to be non-wear
time; (v) lastly, spurious data of over 15,000 cpm from the ActiGraph GT3X+ were deleted
(Esliger et al 2005).
Statistical methods used in calibration studies to derive cut-points from accelerometers have
tended to generate regression equations for different activity intensities, based on statistical
models between energy expenditure and accelerometer counts. Indirect calorimetry units that
are used to measure energy expenditure can be a burden to the user, and are only generally
used for a few hours in a free-living environment where sedentary behaviour most naturally
occurs (Crouter et al 2013). To derive an appropriate cut-point for sedentary behaviour, the
change in counts over time from the ActiGraph GT3X+ must first be accounted for. The
counts from each successive minute are likely to be autocorrelated with the previous minute
and also with the following minute; for example, a person sitting during a given minute is
more likely to be sitting during the next minute (Tryon 2011). The statistical models of
choice for this study, generalised estimating equations (GEEs), were used to make minute by
minute comparisons of cpm from the ActiGraph GT3X+ and the sedentary classification of
the activPAL3™. A sedentary minute from the activPAL3™ was defined when all 60
seconds were classified as sitting or lying; however, since the participants wore both devices
during waking hours only, the sedentary behaviour recorded was more likely time spent
sitting than lying.
GEEs take into account the within-subject correlation between measurements, whilst also
making use of all available data (Liang and Zeger 1986). An advantage of GEE analysis over
standard regression techniques is that they are designed specifically for analysis of repeated
measures. Individual GEE models were generated for each day of the week, working days,
weekend days, all seven days of the week, worktimes and non-worktimes. For each GEE
model, the mean of the predicted distribution was calculated from the reciprocal of mµ (based
on the gamma distribution and the reciprocal link function); the upper-threshold of the
waking hours of between 08:00 and 22:00 to achieve sufficient replicates for model
convergence. Working hours were limited between 09:00 and 16:30, and non-working hours
were limited between 18:00 and 22:00.
The accuracy of the derived cut-points from the GEE models was maximized using
bootstrapping techniques, by resampling the observations 1000 times for each regression
model; all models were adjusted for age and sex. The classification accuracy of the derived
cut-points was compared to that of the previously proposed cut-points for sedentary
behaviour (100 and 150 cpm) by calculating the sensitivity, specificity, and area under the
receiver operating characteristic curve (ROC-AUC). ROC-AUC analysis calculates the area
under the curve when sensitivity (probability a minute is defined as sedentary from the
ActiGraph GT3X+ derived cut-point, given that the minute is defined as sedentary from the
activPAL3™) is plotted against, 1-specificity (probability a minute is defined as
non-sedentary from the ActiGraph GT3X+ derived cut-point, given that the minute is defined as
non-sedentary from the activPAL3™). To maximize the validity of the outcome, the outcome
that gives the bigger area under the curve is seen as the optimum when comparing cut-points.
The amount of sedentary time is presented as percentage of sedentary time across each day.
Mean bias percentages [(ActiGraph sedentary minutes/activPAL3™ sedentary minutes) – 1 x
100], average difference in sedentary time and limits of agreement (LoA) for sedentary time
calculated from the derived cut-points, were compared to sedentary time from the
activPAL3™ using the Bland-Altman method.
Results
The average age of men in the study was 44.8 ± 11.1 years, and women were 38.3 ± 10.2
across the sample was 24 to 62 years old. The mean BMI of participants was 23.93 (± 2.46,
range: 19.2-28.0 kg/m2).
Accelerometers were reported not to be worn, or worn incorrectly, on only eight of the 210
days of data collection; reasons included going away for the weekend, not being in work on
first day of data collection and incorrect placement of the activPAL3™. After data reduction,
participants provided on average 11 hours 27 minutes of data per day (SD=2 hours 34
minutes) equating to 82% of the waking day between 08:00 and 22:00.
Of the data that were removed, the majority of minutes were as a result of information in the
activity diaries (main reasons were cycling, showering/bathing and swimming); after these
data were removed, only two participants had further data removed after identifying periods
of 60 minutes or greater of zero counts (allowing for up to two minutes of non-zero counts).
In total 137,515 trimmed minutes of accelerometer data were available. The majority of these
minutes (82,020; 59.64%) were classified as sedentary only from the activPAL3™ (equal to
all 60 seconds of the minute being sedentary); 30.82% (42,380) were upright only minutes
and the remainder 9.54% (13,115) were mixed minutes, containing both sedentary and
upright activity.
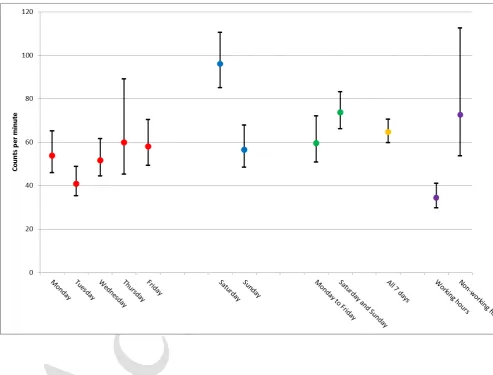
The derived cut-points for all days of the week were less than 100 cpm, with the exception of
Saturday; cut-points for Monday to Friday ranged from 41-60 cpm and were similar to
Sunday (57) (Figure 1); the cut-point for Saturday was significantly higher compared to other
days, 97 cpm. The overall derived cut-point for the week was 65 cpm; the derived sedentary
behaviour threshold for working days (Monday to Friday) was lower than that derived for
working hours and non-working hours were significantly different (35 vs. 73 cpm
[image:14.595.72.566.170.545.2]respectively).
Figure 1. ActiGraph GT3X+ accelerometer derived cut-points (95% CI) for sedentary behaviour from GEE regression models
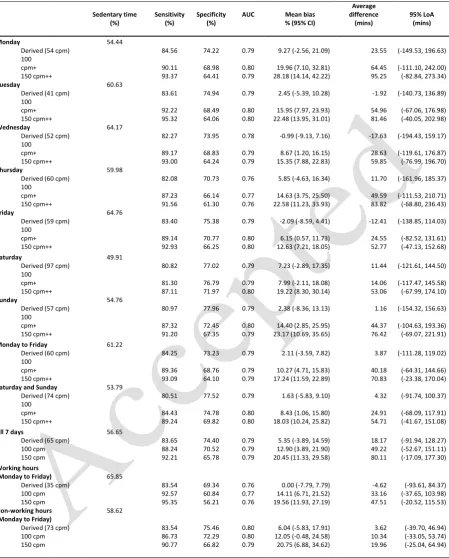
There were no significant differences between the derived cut-points and the previously
proposed cut-points (100cpm and 150cpm) in terms of ROC-AUC analysis, for days of the
week or working and non-working times (Table 1). As expected, the higher thresholds of
100 and 150cpm resulted in higher sensitivity values. The lowest mean bias and smallest
average differences in sedentary time occurred for the derived points. The derived
cut-points, the 100 and the 150 cut-points all overestimated sedentary time (with the exception of
Friday); this is most likely due to misclassification of non-sedentary activities that result in
higher on working days compared to weekend days (61.22 % vs. 53.79 % respectively), and
also during working hours compared to non-working hours (65.85% vs. 58.62%
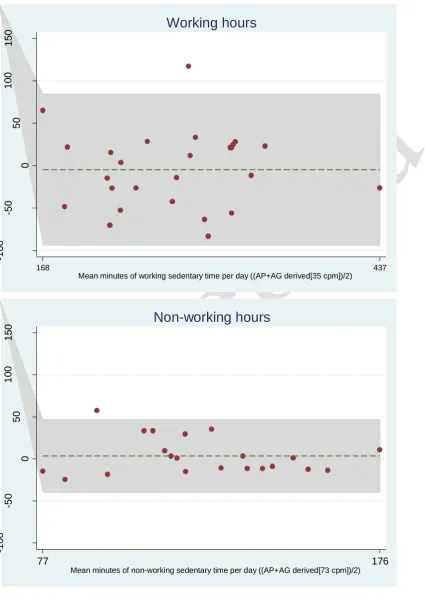
respectively). Figure 2 shows the Bland-Altman plots for the mean differences and limits of
agreement for sedentary time determined from the activPAL3™ and the derived ActiGraph
GT3X+ cut points, for both working and non-working hours. The limits of agreement were
narrower for non-working sedentary time compared to working hours; this may be due to the
there being less non-working hours compared to working hours each day. However, the
mean bias percentage was smaller for working hours when compared to non-working hours
Table 1. Accuracy of the derived cut-points compared to cut-points of 100 cpm and 150 cpm
Sedentary time Sensitivity Specificity AUC Mean bias
Average
difference 95% LoA (%) (%) (%) % (95% CI) (mins) (mins)
Monday 54.44
Derived (54 cpm) 84.56 74.22 0.79 9.27 (-2.56, 21.09) 23.55 (-149.53, 196.63) 100
cpm+ 90.11 68.98 0.80 19.96 (7.10, 32.81) 64.45 (-111.10, 242.00)
150 cpm++ 93.37 64.41 0.79 28.18 (14.14, 42.22) 95.25 (-82.84, 273.34)
Tuesday 60.63
Derived (41 cpm) 83.61 74.94 0.79 2.45 (-5.39, 10.28) -1.92 (-140.73, 136.89) 100
cpm+ 92.22 68.49 0.80 15.95 (7.97, 23.93) 54.96 (-67.06, 176.98)
150 cpm++ 95.32 64.06 0.80 22.48 (13.95, 31.01) 81.46 (-40.05, 202.98)
Wednesday 64.17
Derived (52 cpm) 82.27 73.95 0.78 -0.99 (-9.13, 7.16) -17.63 (-194.43, 159.17) 100
cpm+ 89.17 68.83 0.79 8.67 (1.20, 16.15) 28.63 (-119.61, 176.87)
150 cpm++ 93.00 64.24 0.79 15.35 (7.88, 22.83) 59.85 (-76.99, 196.70)
Thursday 59.98
Derived (60 cpm) 82.08 70.73 0.76 5.85 (-4.63, 16.34) 11.70 (-161.96, 185.37) 100
cpm+ 87.23 66.14 0.77 14.63 (3.75, 25.50) 49.59 (-111.53, 210.71)
150 cpm++ 91.56 61.30 0.76 22.58 (11.23, 33.93) 83.82 (-68.80, 236.43)
Friday 64.76
Derived (59 cpm) 83.40 75.38 0.79 -2.09 (-8.59, 4.41) -12.41 (-138.85, 114.03) 100
cpm+ 89.14 70.77 0.80 6.15 (0.57, 11.73) 24.55 (-82.52, 131.61)
150 cpm++ 92.93 66.25 0.80 12.63 (7.21, 18.05) 52.77 (-47.13, 152.68)
Saturday 49.91
Derived (97 cpm) 80.82 77.02 0.79 7.23 (-2.89, 17.35) 11.44 (-121.61, 144.50) 100
cpm+ 81.30 76.79 0.79 7.99 (-2.11, 18.08) 14.06 (-117.47, 145.58)
150 cpm++ 87.11 71.97 0.80 19.22 (8.30, 30.14) 53.06 (-67.99, 174.10)
Sunday 54.76
Derived (57 cpm) 80.97 77.96 0.79 2.38 (-8.36, 13.13) 1.16 (-154.32, 156.63) 100
cpm+ 87.32 72.45 0.80 14.40 (2.85, 25.95) 44.37 (-104.63, 193.36)
150 cpm++ 91.20 67.35 0.79 23.17 (10.69, 35.65) 76.42 (-69.07, 221.91)
Monday to Friday 61.22
Derived (60 cpm) 84.25 73.23 0.79 2.11 (-3.59, 7.82) 3.87 (-111.28, 119.02) 100
cpm+ 89.36 68.76 0.79 10.27 (4.71, 15.83) 40.18 (-64.31, 144.66)
150 cpm++ 93.09 64.10 0.79 17.24 (11.59, 22.89) 70.83 (-23.38, 170.04)
Saturday and Sunday 53.79
Derived (74 cpm) 80.51 77.52 0.79 1.63 (-5.83, 9.10) 4.32 (-91.74, 100.37) 100
cpm+ 84.43 74.78 0.80 8.43 (1.06, 15.80) 24.91 (-68.09, 117.91)
150 cpm++ 89.24 69.82 0.80 18.03 (10.24, 25.82) 54.71 (-41.67, 151.08)
All 7 days 56.65
Derived (65 cpm) 83.65 74.40 0.79 5.35 (-3.89, 14.59) 18.17 (-91.94, 128.27)
100 cpm 88.24 70.52 0.79 12.90 (3.89, 21.90) 49.22 (-52.67, 151.11)
150 cpm 92.21 65.78 0.79 20.45 (11.33, 29.58) 80.11 (-17.09, 177.30)
Working hours
(Monday to Friday) 65.85
Derived (35 cpm) 83.54 69.34 0.76 0.00 (-7.79, 7.79) -4.62 (-93.61, 84.37)
100 cpm 92.57 60.84 0.77 14.11 (6.71, 21.52) 33.16 (-37.65, 103.98)
150 cpm 95.35 56.21 0.76 19.56 (11.93, 27.19) 47.51 (-20.52, 115.53)
Non-working hours 58.62
(Monday to Friday)
Derived (73 cpm) 83.54 75.46 0.80 6.04 (-5.83, 17.91) 3.62 (-39.70, 46.94)
100 cpm 86.73 72.29 0.80 12.05 (-0.48, 24.58) 10.34 (-33.05, 53.74)
150 cpm 90.77 66.82 0.79 20.75 (6.88, 34.62) 19.96 (-25.04, 64.94)
Figure 2. Bland-Altman plots of the relationship between activPAL3™ and derived ActiGraph GT3X+
sedentary time, for working and non-working hours
-1
0
0
-5
0
0
50
1
0
0
1
5
0
168 437
Mean minutes of working sedentary time per day ((AP+AG derived[35 cpm])/2)
Working hours
-5
0
0
50
1
0
0
1
5
0
-1
0
0
77 176
Mean minutes of non-working sedentary time per day ((AP+AG derived[73 cpm])/2)
Discussion
This current study is the first to empirically derive sedentary behaviour thresholds in adults in
the free-living environment. Most existing studies that have used an ActiGraph accelerometer
to describe time spent in sedentary behaviours have used an arbitrary threshold of 100 cpm to
define sedentary behaviour; however, this cut-point had not been empirically derived in
adults. We found that the empirically derived cut-point across all days of the week was 65
cpm; the cut-points for individual days of the week were significantly different, ranging from
41-60 cpm with the exception of Saturday, which was substantially higher (97 cpm).
Importantly, cut-points for working hours were substantially lower compared to non-working
times (35 cpm vs. 73 cpm).
The derived cut-points performed better in terms of mean bias and average difference in
sedentary time, compared to the 100 and 150cpm threshold. Specifically, the 100 cpm
cut-point over-estimated worktime sedentary behaviour by 14.11% compared to an
overestimation of <0.01% for the derived cut-point of 35 cpm. The use of a new sedentary
behaviour cut-point in a specific setting, for example 35 cpm in office workers, would reduce
misclassification of non-sedentary activities such as filing, which have previously been found
to have an average cpm of 60 (Crouter et al 2006).
Validation studies of the 100 cpm cut-point for ActiGraph accelerometers have found
conflicting findings in working age adults. Kozey-Keadle et al (2011) found that the
ActiGraph GT3X underestimated sedentary time by 4.9% using the 100 cpm threshold,
compared to direct observation, in a small cohort of overweight university workers (n=20;
mean BMI 33.7±5.7 kg/m2). The same study suggested that 150 cpm may be the most
Crouter et al (2013) found that the 100 cpm threshold from the ActiGraph GT1M,
overestimated sedentary time in working-age adults by 9.9%, compared to indirect
calorimetry in a free-living environment over six hours (n=29; mean BMI 25.0 ±4.6 kg/m2).
This is similar to our current study, where we found the 100 cut-point overestimated
sedentary time by 12.9% (across all seven days) compared to the sedentary classification of
the activPAL3™ accelerometer. The lower empirically derived cut-point of 65 cpm, across
the whole week, also overestimated sedentary time, but with a lower mean bias of 5.35%.
This overestimation in sedentary time may be explained by misclassification of some
non-ambulatory standing activities that can produce low counts per minute (Crouter et al 2006,
Matthews et al 2008). A study by Hart et al (2011) examined the convergent validity of the
activPAL™, the ActiGraph GT1M and an activity record (the Bouchard Activity Record), in
healthy adults (n=32; mean BMI 23.0kg/m2). They found moderate agreement between
sedentary time for the ActiGraph GT1M compared to the activPAL™ ( =0.47); sedentary
time was also found to be 25% higher using a 100 cpm threshold from the ActiGraph GT1M
compared to the sedentary classification of the activPAL3™. Differences in the
methodologies between these studies included: different criterion measures (direct
observation (Kozey-Keadle et al 2011); indirect calorimetry (Crouter et al 2013); sedentary
classification of activPAL, this study and Hart et al (2011)); and time of studies (direct
observation and indirect calorimetry was six hours (Kozey-Keadle et al 2011, Crouter et al
2013); waking hours over one day (Hart et al 2011); seven days, this study). Another
difference was the ActiGraph model and use (or not) of the low-frequency extension during
data processing, which impacts on comparability between studies (Cain et al 2013). Cain et al
(2013) found that data from different generations of ActiGraph devices are comparable for
moderate to vigorous physical activity, but not at the lower end of the movement continuum;
accelerations to record non-zero counts. Applying the low-frequency extension enables
greater comparability with studies that have used older model ActiGraph devices when
comparing sedentary time. Studies by Kozey-Keadle et al (2011) and Aguilar-Farías et al
(2013) used the low-frequency extension during data processing; studies by Crouter et al
(2013) and Hart et al (2011) used the ActiGraph GT1M device and were carried out before
the low-frequency recommendation by Cain et al (2013). Finally, the three studies that were
carried out in healthy adults of normal weight all found an overestimate of sedentary time
compared to the 100 cpm threshold: the exception was the study by Kozey-Keadle et al
(2011), which was in 20 overweight university workers where the 100 cpm underestimated
sedentary time. It is not clear why overweight individuals might have different cut-points.
There has been some conflicting reports of the effect of waist adiposity on the tilt angle of the
monitor, and consequently on the output of some activity devices (Swartz et al 2009).
However, the accuracy of the output from ActiGraph devices has been shown not to be
affected by the differences in tilt angle that occur in individuals with different BMI (Feito et
al 2011). For older adults (mean age 73.5 years) a threshold of <25 cpm may be more
appropriate to define sedentary behaviour (Aguilar-Farías et al 2013). For children and
adolescents, the 100 cpm threshold seems to hold true (Treuth et al 2004b, Ridgers et al
2012). There seems to be no consensus for accelerometer cut-points for sedentary behaviour,
and those proposed vary widely. Combined, these findings suggest that there should be
different cut points for different populations.
Not only have we demonstrated the derivation of empirical accelerometer cut-points for
sedentary behaviour, our study adds to this growing field by identifying a lower threshold of
35 cpm for sedentary time during working time for office workers. These proposed lower
whilst sitting. Because these studies all used waist worn ActiGraph accelerometers, the
differences in stillness whilst sitting must originate from limited hip movement. Taken
together, these studies suggest that people sit differently depending on the population
characteristics (age, body composition) and the environment where sedentary time is accrued.
In studies of largely office-based workers, sitting time on workdays is known to be much
higher compared to non-work days (Clemes et al 2014, Thorp et al 2012). Clemes et al
(2014) showed that greater than 60% of daily sitting time was accrued at work (subjectively
measured using the Domain Specific Questionnaire). Another study found that over 80% of
work hours were spent in sedentary behaviours compared to 69% in non-work time
(objectively measured using an Actical accelerometer) (Parry and Straker 2013). While our
study was not designed to measure total sedentary time we also found higher percentages of
sitting time on working days compared to the weekend (61.22% vs. 53.79%); and working
hours versus non-working hours, using the activPAL3™ sedentary classification (65.85% vs.
58.62%). The workplace is a key setting for prolonged bouts of sedentary time (Ryan et al
2011). Although we found this was also true for our study, since 70.15% of sedentary time
during working hours was spent in prolonged bouts, this was not statistically significant to
non-working hours, (66.65%: data not shown). It is important to further investigate sedentary
time accrued during working hours, not only as a risk in itself, but also because it is known
that those who sit a long time at work also tend to be sedentary for longer periods in their
leisure time (Jans et al 2007).
Our study derived sedentary cut-points for both the working and non-working domains;
however, another domain in which people may accrue significant sedentary time is travel. We
commuting time on weekdays by limiting working and non-working hours used in the
regression models. Our derived cut-points for working and non-working hours implied that
we sit differently at work compared to our leisure time; it is not known what extent this is
true for travel time.
This is the first time that a threshold for cpm for sedentary behaviour has been empirically
derived from an observational study in a free-living environment, using the activPAL™
sedentary behaviour classification as the criterion measure. The activPAL™ has been shown
to provide valid and precise measure of sedentary time (Grant et al 2006, Kozey-Keadle et al
2011). However, there are some limitations to our study. Although the accelerometer
manufacturers employ proprietary algorithms to reduce the raw acceleration data to cpm or
sitting/standing behaviour, there are still a large amount of data cleaning and data reduction
decisions to be made. Since the aim of the study was to derive cut-points, it was the quality of
the data that was deemed to be important and not the quantity of minutes included. Therefore,
aggressive data reduction rules were applied that used a combination of times from an
activity diary and a non-wear algorithm. A strength of our study is the large amount of data
(11 hours 27 minutes: 82% of waking time), despite the data reduction.
Generalised estimating equations can be used to account for autocorrelation; however, these
models assume linearity of the outcome variable over time (Liang and Zeger 1986). The
outcome variable (cpm) for this study has a polynomial distribution with time, and therefore
the assumption of linearity is not valid. The models in this study were run with and without
the assumption of linearity, using the mfp command in Stata that takes into account the
methods were compared, there was no impact on the precision of estimates of the derived
cut-points.
The accelerometer cut-points derived in this study were in university workers, who spent
most of their day sitting in front of a computer. Our cut-point for sedentary behaviour across
the whole week (65 cpm) may be limited to working adults, and the lower cut-point of 35
cpm may only be generalisable to other office based workers. Barnett and Cerin (2006) found
considerable individual variability in calibration regression lines for accelerometer counts
versus walking speed, and wide between-subject differences in mean bias are often reported
for sedentary behaviour cut-points as evidenced in our study and also in Crouter et al (2013).
Cut-points based on energy expenditure from calibration studies can vary in estimates of time
spent in different activity categories (Crouter et al 2006, 2013). The definition of sedentary
behaviour from the SBRN classifies both posture and energy expenditure; however, there is
currently no instrument that can measure free-living sedentary behaviour accurately using
this definition (Granat 2012). Whilst the 100 cpm threshold from the ActiGraph provides a
useful measure of sedentary behaviour, it generally overestimates time spent in these
behaviours (Crouter et al 2013, Hart et al 2011). Taking into account the context and
population in which sedentary time is accrued may have implications on how we measure
sedentary time in a working population, and consequently in studies looking at correlates and
determinants of sedentary behaviour. For example, a study that examined associations
between sedentary time and cardio-metabolic risk factors, found more consistent associations
for leisure time sedentary behaviour compared to occupational sedentary behaviour (Pinto
Pereira et al 2012). We suggest that a applying a lower threshold to a homogenous population
compared to the 100cpm threshold, and reduce misclassification of non-sedentary activities in
this population.
Conclusion
Since sedentary behaviour is independently linked to several health-related outcomes, it is
imperative to have accurate and reliable measures of sedentary time when using objective
measures. It is not known if different types of sedentary behaviour have different impacts on
health, and therefore a more precise definition of accelerometer thresholds of sedentary
behaviour are needed.
Acknowledgements
The authors thank the participants for taking part in the study. The authors would also like to
acknowledge the contribution of Professor Lindsey Dugdill, who sadly passed away in
December 2014. Lindsey was integral to the design, application and initial analyses of this
study; she is greatly missed by her colleagues at the University of Salford.
Conflict of Interest
One of the authors is a co-inventor of the activPAL3™ physical activity monitor and a
director of PAL Technologies Ltd. The remaining authors declare no competing interests.
References
Aguilar-Farías N, Brown W J and Peeters G M 2013 ActiGraph GT3X+ cut-points for
identifying sedentary behaviour in older adults in free-living environments. J. Sci. Med.
Sport 17 293–9
Atkin A J, Gorely T, Clemes S A, Yates T, Edwardson C, Brage S, Salmon J, Marshall S J
Int. J. Epidemiol. 41 1460–71
Barnett A and Cerin E 2006 Individual calibration for estimating free-living walking speed
using the MTI monitor. Med. Sci. Sports Exerc. 38 761–7
Baumgartner T A, Mahar M T, Jackson A S and Rowe D A 2015 Measurement for
Evaluation in Kinesiology (Jones & Bartlett Publishers)
Cain K L, Conway T L, Adams M A, Husak L E and Sallis J F 2013 Comparison of older and
newer generations of ActiGraph accelerometers with the normal filter and the low
frequency extension. Int. J. Behav. Nutr. Phys. Act. 10 51
Chastin S F M, Palarea-Albaladejo J, Dontje M L and Skelton D A 2015 Combined Effects of
Time Spent in Physical Activity, Sedentary Behaviors and Sleep on Obesity and
Cardio-Metabolic Health Markers: A Novel Compositional Data Analysis Approach. PLoS One
10 e0139984
Chen S-M, Liu M-F, Cook J, Bass S and Lo S K 2009 Sedentary lifestyle as a risk factor for
low back pain: a systematic review. Int. Arch. Occup. Environ. Health 82 797–806
Clemes S A, David B M, Zhao Y, Han X and Brown W 2012 Validity of two self-report
measures of sitting time. J. Phys. Act. Health 9 533–9
Clemes S A, O’Connell S E and Edwardson C L 2014 Office workers’ objectively measured
sedentary behavior and physical activity during and outside working hours. J. Occup.
Environ. Med. 56 298–303
Crouter S E, Clowers K G and Bassett D R 2006 A novel method for using accelerometer
data to predict energy expenditure. J. Appl. Physiol. 100 1324–31
Crouter S E, DellaValle D M, Haas J D, Frongillo E A and Bassett D R 2013 Validity of
ActiGraph 2-regression model, Matthews cut-points, and NHANES cut-points for
Dunstan D W, Kingwell B A, Larsen R, Healy G N, Cerin E, Hamilton M T, Shaw J E,
Bertovic D A, Zimmet P Z, Salmon J and Owen N 2012 Breaking up prolonged sitting
reduces postprandial glucose and insulin responses. Diabetes Care 35 976–83
Edwardson C L, Winkler E A H, Bodicoat D H, Yates T, Davies M J, Dunstan D W and
Healy G N 2016 Considerations when using the activPAL monitor in field based
research with adult populations J. Sport Heal. Sci.
Esliger D W, Copeland J L, Barnes J D and Tremblay M S 2005 Standardizing and
Optimizing the Use of Accelerometer Data for Free-Living Physical Activity Monitoring
3 366–83
Feito Y, Bassett D R, Tyo B and Thompson D L 2011 Effects of body mass index and tilt
angle on output of two wearable activity monitors. Med. Sci. Sports Exerc. 43 861–6
Granat M H 2012 Event-based analysis of free-living behaviour Physiol. Meas. 33 1785–800
Grant P M, Dall P M, Mitchell S L and Granat M H 2008 Activity-monitor accuracy in
measuring step number and cadence in community-dwelling older adults. J. Aging Phys.
Act. 16 201–14
Grant P M, Ryan C G, Tigbe W W and Granat M H 2006 The validation of a novel activity
monitor in the measurement of posture and motion during everyday activities. Br. J.
Sports Med. 40 992–7
Hamilton M T, Hamilton D G and Zderic T W 2007 Role of low energy expenditure and
sitting in obesity, metabolic syndrome, type 2 diabetes, and cardiovascular disease
Diabetes 56 2655–67
Hart T L, Ainsworth B E and Tudor-Locke C 2011 Objective and subjective measures of
sedentary behavior and physical activity. Med. Sci. Sports Exerc. 43 449–56
Wiesner G, Willenberg L and Dunstan D W 2016 A Cluster RCT to Reduce Office
Workers’ Sitting Time: Impact on Activity Outcomes. Med. Sci. Sports Exerc.
Hu F B, Li T Y, Colditz G A, Willett W C and Manson J E 2003 Television watching and
other sedentary behaviors in relation to risk of obesity and type 2 diabetes mellitus in
women. JAMA 289 1785–91
Jans M P, Proper K I and Hildebrandt V H 2007 Sedentary Behavior in Dutch workers
differences between occupations and business sectors Am. J. Prev. Med. 33 450–4
Katzmarzyk P T, Church T S, Craig C L and Bouchard C 2009 Sitting time and mortality
from all causes, cardiovascular disease, and cancer. Med. Sci. Sport. Exerc. 41 998–1005
Kozey-Keadle S, Libertine A, Lyden K, Staudenmayer J and Freedson P S 2011 Validation
of wearable monitors for assessing sedentary behavior Med. Sci. Sports Exerc. 43 1561–
7
Liang K-Y and Zeger S L 1986 Longitudinal data analysis using generalized linear models
Biometrika 73 13–22
Lopes V P, Magalhães P, Bragada J and Vasques C 2009 Actigraph calibration in
obese/overweight and type 2 diabetes mellitus middle-aged to old adult patients. J. Phys.
Act. Health 6 Suppl 1 S133–40
Maher C, Olds T, Mire E and Katzmarzyk P T 2014 Reconsidering the sedentary behaviour
paradigm. PLoS One 9 e86403
Matthews C E, Chen K Y, Freedson P S, Buchowski M S, Beech B M, Pate R R and Troiano
R P 2008 Amount of time spent in sedentary behaviors in the United States, 2003-2004.
Am. J. Epidemiol. 167 875–81
Owen N, Healy G N, Matthews C E and Dunstan D W 2010 Too much sitting: the population
Parry S and Straker L 2013 The contribution of office work to sedentary behaviour associated
risk BMC Public Health 13 10
Pinto Pereira S M, Ki M and Power C 2012 Sedentary behaviour and biomarkers for
cardiovascular disease and diabetes in mid-life: the role of television-viewing and sitting
at work. PLoS One 7 e31132
Proper K I, Cerin E, Brown W J and Owen N 2007 Sitting time and socio-economic
differences in overweight and obesity. Int. J. Obes. (Lond). 31 169–76
Ridgers N D, Salmon J, Ridley K, O’Connell E, Arundell L and Timperio A 2012 Agreement
between activPAL and ActiGraph for assessing children’s sedentary time. Int. J. Behav.
Nutr. Phys. Act. 9 15
Rosenberg D, Norman G, Wagner J, Patrick K, Calfas K and Sallis J 2010 Reliability and
Validity of the Sedentary Behavior Questionnaire (SBQ) for Adults. J. Phys. Act. Health
7 697–705
Ryan C G, Dall P M, Granat M H and Grant P M 2011 Sitting patterns at work: objective
measurement of adherence to current recommendations Ergonomics 54 531–8
Sedentary Behaviour Research Network 2012 Standardized use of the terms “sedentary” and
“sedentarybehaviours”. Appl. Physiol. Nutr. Metab. 37 540–2
Stamatakis E, Hamer M, Tilling K and Lawlor D A 2012 Sedentary time in relation to
cardio-metabolic risk factors: differential associations for self-report vs accelerometry in
working age adults. Int. J. Epidemiol. 41 1328–37
Swartz A M, Strath S J, Miller N E, Grimm E K, Ewalt L A, Loy M S and Gennuso K P 2009
Validity of Physical Activity Monitors in Assessing Energy Expenditure in Normal,
Overweight, and Obese Adults Open Sports Sci. J. 2 58–64
2010 Deleterious Associations of Sitting Time and Television Viewing Time With
Cardiometabolic Risk Biomarkers: Australian Diabetes, Obesity and Lifestyle
(AusDiab) study 2004-2005 Diabetes Care 33 327–34
Thorp A A, Healy G N, Winkler E, Clark B K, Gardiner P A, Owen N, Dunstan D W, Thorp
A A, Healy G N, Winkler E, Clark B K, Gardiner P A, Owen N and Dunstan D W 2012
Prolonged sedentary time and physical activity in workplace and non-work contexts: a
cross-sectional study of office, customer service and call centre employees Int. J. Behav.
Nutr. Phys. Act. 9 128
Treuth M S, Schmitz K, Catellier D J, McMurray R G, Murray D M, Almeida M J, Going S,
Norman J E and Pate R 2004a Defining accelerometer thresholds for activity intensities
in adolescent girls. Med. Sci. Sports Exerc. 36 1259–66
Treuth M S, Sherwood N E, Baranowski T, Butte N F, Jacobs D R, McClanahan B, Gao S,
Rochon J, Zhou A, Robinson T N, Pruitt L, Haskell W and Obarzanek E 2004b Physical
activity self-report and accelerometry measures from the Girls health Enrichment
Multi-site Studies. Prev. Med. (Baltim). 38 Suppl S43–9
Troiano R P, Berrigan D, Dodd K W, Masse L C, Tilert T and McDowell M 2008 Physical
activity in the United States measured by accelerometer Med. Sci. Sports Exerc. 40 181–
8
Tryon W W 2011 Actigraphy: The Ambulatory Measurement of Physical Activity
Behavioral Sport Psychology: Evidence-Based Approaches to Performance
Enhancement ed J K Luiselli and D D Reed (New York, New York: Springer Science &
Business Media)
van-der-Ploeg H P, Chey T, Korda R J, Banks E and Bauman A 2012 Sitting time and
Welk G J, Corbin C B and Dale D 2000 Measurement issues in the assessment of physical