Theme 2
Economy and finance
Series Β
Shortterm trends
ISSN 10110844
ECU-EMS information
The ecu bond market: historical background
Eurostat has for several years been managing a database on bonds denominated in ecus. This base now contains approximately 1 200 issues, already amortized or still in circulation, and about 20 fields are filled in for each issue. The purpose of the following study is to present some of the observations which this database makes possible.
If we look at the gross nominal value of ecu bonds issued since 1981, the year this market came into being, we can distinguish three periods. First of all, a phase of exponential growth from 1981 to 1985: from ECU 232 million in 1991, the volume of issues rose to ECU 13 261 million four years later. Growth of the market slowed down in 1986 and 1987, with approximately ECU 9 100 million each year. From 1987 to 1991 the volume of issues increased fourfold, making the ecu the fifth most widely used world currency for bonds..
aoooo
'm
17« B ! 0 p|
m
,
m
,
m
It must be added that the market is stimulated by any prospects of progress in the institutional field. Since 1991 there has been a drop in the volume issued as a result of political events, particularly the Danish "no" in the May 1992 referendum and the closerun "yes" in the French referendum, or of monetary events such as the withdrawal of the pound sterling from the exchange rate mechanism and the devaluations of the peseta and the escudo, or again the widening of the bands in the system last August.
The size of the issues has changed over the years, reflecting the phases of maturity of the market and the identity of borrowers. Until 1987, for example, there were at most six issues a year worth 200 million or more. In 1990, by which time the market had increased its depth and attracted the interest of many sovereign borrowers, there were no fewer than 18 issues worth 500 million or more. Since 1991 proved to be a very active year, the following year saw the arrival on the market of many "small" private borrowers: in 1992 there were 106 loans under 200 million. This was in contrast to 1993, which was a difficult year: there were only 45 small issues, since private companies only rarely thought it worthwhile to venture into this market. This leaves the traditional pillars, mainly sovereign and supranational borrowers, who needed to borrow large amounts to meet considerable financing requirements. Thus, from 1988 on, the volume accounted for by major issues (500 or more) has exceeded that of small issues (from 0 to 100). In 1990 large issues exceeded small ones by a ratio of three to one.
This increase in the average size of bond issues should be seen in the context of the expected redemption flows. For 1994, 1995 and 1996 expected redemptions are of the order of 20 000 million per year.
30001000 0
-—
—
1=M
eurostat
- ι I
9» I 9»
IV 94
I ■
85 96 Quarter·
rv 95
I 9»
I 96
■
96 IV 96
Ξ ^
eurosta
OFICINA ESTADÍSTICA DE LAS COMUNIDADES EUROPEAS DE EUROPÆISKE FÆLLESSKABERS STATISTISKE KONTOR STATISTISCHES AMT DER EUROPÄISCHEN GEMEINSCHAFTEN ΣΤΑΤΙΣΤΙΚΗ ΥΠΗΡΕΣΙΑ ΤΩΝ ΕΥΡΩΠΑΪΚΩΝ ΚΟΙΝΟΤΗΤΩΝ STATISTICAL OFFICE OF THE EUROPEAN COMMUNITIES
OFFICE STATISTIQUE DES COMMUNAUTÉS EUROPÉENNES
ISTITUTO STATISTICO DELLE COMUNITÀ EUROPEE
BUREAU VOOR DE STATISTIEK DER EUROPESE GEMEENSCHAPPEN SERVIÇO DE ESTATÍSTICA DAS COMUNIDADES EUROPEIAS
L-2920 Luxembourg - Tél. 43 01-1 - Télex COMEUR LU 3423 B-1049 Bruxelles, rue de la Loi 200 - Tél. 299 11 11
Note
For any
TEL:
FAX:
information
+ 352
on the statistics in this bulletin contact Luxembourg:
4301-34674 33288
32929
F. GARCIA - VALERO G. THOUVENIN
Eurostat
Monetary and Financial Statistics, Jean Monnet Building
APC C4/04
L-2920 Luxembourg
Contents
I. II. III. IV. V. VI. VII.
A graph of the bilateral fluctuations of the ERM currencies. Yearly and monthly issues of ecu bonds.
EMCF rate, interest rates on ecu deposits and yields on ecu bonds. Last month's ecu bond issues.
Consumer price indices in national currencies. Consumer price indices in ecus.
Yearly, monthly and daily ecu exchange rates.
ECSC-EC-EAEC, Brussels · Luxembourg, 1994
Reproduction is authorized, except for commercial purposes, provided the source is acknowledged.
TABLE I
BILATERAL FLUCTUATIONS OF THE ERM CURRENCIES
ΓΞΡΑ
2.25
1.25
τ ΐ
0.25
-0.75
■1.75
2.75
1
η
ι I I I I I I I I I I I
8
15
22
ι ι ι ι ι ι ι ι ι I I I I I I I I I I I I I I
28
6
13
20
27
April May
CENTRAL RATES AND INTERVENTION LIMIT RATES, IN FORCE SINCE 2 AUGUST 1993 FOR THE CURRENCIES OF COUNTRIES PARTICIPATING IN THE EMS EXCHANGE MECHANISM.
.
Ï=VA.
eurostat
BLF
DKR
D M
PTA
FF
IRL
HFL
ESC
1 e c u =
40.2123
7.43679
1.94964
154.250
6.53883
0.808628
2.19672
192.854 S
C
B
S
C
B
S
C
B
S
C
B
' S
C
B
S
C
B
S
C
B
S
C
B
100 BLF =
-21.4747
18.4938
15.9266
5.63000
4.84837
4.17500
445.418
383.589
330.342
18.8800
16.2608
14.0050
2.33503
2.01090
1.73176
6.34340
5.46286
4.70454
556.890
479.590
413.020
100 D K R =
627.880
540.723
465.665
-30.4450
26.2162
22.5750
2408.50
2074.15
1786.20
102.100
87.9257
75.7200
12.6261
10.8734
9.36403
34.3002
29.5389
25.4385
3011.20
2593.24
2233.30
100 D M =
2395.20
2062.55
1776.20
442.968
381.443
328.461
-9191.20
7911.72
6812.00
389.480
335.386
288.810
48.1696
41.4757
35.7143
(130.834)(1
112.673
(97.0325)(1
11481.1
9891.77
8517.90
100 P T A =
30.2715
26.0696
22.4510
5.59850
4.82126
4.15190
1.46800
1.26395
1.08800
-4.92260
4.23911
3.65050
0.608731
0.524232
0.451462
1.65368
1.42413
1.22644
145.180
125.027
107.670
100 FF =
714.030
614.977
529.660
132.066
113.732
97.9430
34.6250
29.8164
25.6750
2739.30
2358.98
2031.50
14.3599
12.3666
10.6500
39.0091
33.5953
28.9381
3424.80
2949.37
2540.00
1 IRL =
57.7445
49.7289
42.8260
10.67920
9.19676
7.92014
2.80000
2.41105
2.07600
221.503
190.755
164.276
9.38950
8.08631
6.96400
3.15450
2.71662
2.33952
276.938
238.495
205.389
100 H F L =
2125.60
1830.54
1576.45
393.105
338.537
291.544
(103.058)0
88.7526
(76.4326)0
8153.70
7021.83
6047.10
345.650
297.661
256.350
42.7439
36.8105
31.7007
-10194.30
8779.18
7560.50
100 E S C =
24.2120
20.8512
17.9570
4.47770
3.85618
3.32090
1.17400
1.01094
0.87100
92.8760
79.9828
68.8800
3.93700
3.39056
2.91990
0.486881
0.419295
0.361092
1.32266
1.13906
0.98094
(1) These buying and selling rales will not be operational. Reflecting a bilateral agreement between the German and the authorities, the following rates will continue to apply : selling rate Fl. 100 in Frankfurt: DM 90.7700; buying rate Fl. 100 86.7800; selling rate DM 100 in Amsterdam; Fl. 115.235; buying rate DM 100 in Amsterdam Fl. 110.1675.
The Greek drachma, the Pound Sterling and the Italian Lira do not participate in the exchange mechanism.
TABLE II
ECU BOND ISSUES (Mio ECU)
144
eurosi
1988 1989 1990 1991 1992 1993
1993
1994 March April May
i
il
II III IV
I
II
III
IV
I
TOTAL
9 248 11 127 15 040 27 163 19 242 6 870 7 585 1 375
80 1 980 1 130 1 070 2 690 2 4 1 0
360 350 350
Total
5 335 6 461 10 525 19 266 11 675
5 020 4 663 880
80 1 480
630 770 2 140 2 285 360 250 250
European
Business sector
3 390 4 400 3 990 6 581 4 870 1 565 1 388 280
80 300 130 720 415 910 360 250 250
Community
Govern-ments 100 500 5 000 7 900 2 475 250 2 075 0 0 0 250 0 0 1 150
0 0 0
Insti-tutions
1 845 1 561 1 535 4 785 4 330 3 205 1 200
600 0 1 180
250 50 1 725
225 0 0 0
Total
3 9 1 3 4 666 4 5 1 5 7 897 7 567 1 850 2 922
495 0 500 500 300 550 125 0 100 100
Non-Europea
Business sector
3 138 4 141 3 565 3 932 3 902 250 1 572
480 0 0 0 200 50 125 0 100 100
n Community
Govern-ments 575 425 550 3 790 2 850 1 600
750 0 0 500 500 100 500 0 0 0 0
Insti-tutions
200 100 400 175 815 0 600 15 0 0 0 0 0 0 0 0 0 (') Recording based on the payment date
TABLE
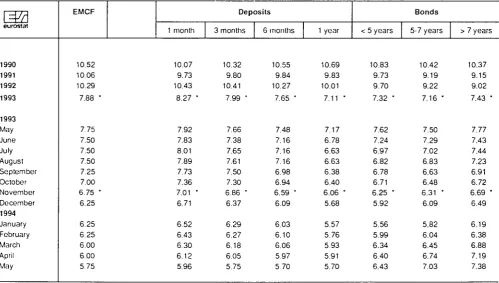
OPERATIONS RATES OF THE EMCF (CALCULATION MONTH, APPLICABLE THE FOLLOWING MONTH) AND INTEREST RATES AND YIELDS OF ECU INVESTMENTS (%)
I4/H
eurostat
1990 1991 1992 1993 1993 May June July August September October November December
1994
January February March April May
EMCF Deposits
1 month
10.52 10.07 10.06 9.73 10.29 10.43
7.88 · 8.27 ·
7.75 7.92 7.50 7.83 7.50 8.01 7.50 7.89 7.25 7.73 7.00 7.36 6.75 * 7.01 '
6.25 6.71 6.25 6.52 6.25 6.43 6.00 6.30 6.00 6.12 5.75 5.96
3 months
10.32 9.80 10.41
7.99 ·
7.66 7.38 7.65 7.61 7.50 7.30 6.86 · 6.37 6.29 6.27 6.18 6.05 5.75
6 months
10.55 9.84 10.27
7.65 ·
7.48 7.16 7.16 7.16 6.98 6.94 6.59 ' 6.09 6.03 6.10 6.06 5.97 5.70
1 year
10.69 9.83 10.01
7.11 ·
7.17 6.78 6.63 6.63 6.38 6.40 6.06 ' 5.68 5.57 5.76 5.93 5.91 5.70
< 5 years
10.83 9.73 9.70 7.32 ·
7.62 7.24 6.97 6.82 6.78 6.71 6.25 · 5.92 5.56 5.99 6.34 6.40 6.43
Bonds 5-7 years
10.42 9.19 9.22 7.16 ·
7.50 7.29 7.02 6.83 6.63 6.48 6.31 '
6.09 5.82 6.04 6.45 6.74 7.03
> 7 years
10.37 9.15 9.02 7.43 *
TABLE IV
LAST MONTH'S ECU BOND ISSUES
Issue Payment
Date
Borrower (country)
Issued (Mio Ecu)
Issue Price
Coupon Term (years)
Maturity Yields
%
Lead Manager
Listing Notice
17/05/1994 17/06/1994
17/05/1994 28/06/1994
sa
eurostatG.E.C.C. (U.S.A.)
Crédit Local de FRANCE
100 97.900 61/8
65 98.230
Listing:
13/04/1999 6.63
41/4 28/09/1998 6.49
C.CF.
S.B.C.
LX
LX
T A B L E V
CONSUMER PRICE INDICES IN NATIONAL CURRENCY
1985=100
l=W
eurostat Β DK D ELL E F IRL I L NL Ρ UK EUR 12 ERM 1980 71.2 68.3 82.6 39.1 56.2 63.3 56.1 52.5 70.3 81.8 35.2 70.7 65.3 66.71990 1988
111.0 104.1 121.2 112.7 107.0 101.4 222.6 162.5 136.8 120.0 116.3 108.7 117.6 109.4 131.8 116.5 109.0 101.7 104.3 100.6 170.9 133.9 133.3 113.0 123.0 110.7 116.9 107.6 1989 107.3 118.1 104.2 184.9 128.2 112.7 113.9 123.7 105.1 101.7 150.8 121.8 116.4 111.9 1990 111.0 121.2 107.0 222.6 136.8 116.3 117.6 131.8 109.0 104.3 170.9 133.3 123.0 116.9 1991 114.6 124.1 110.7 264.7 145.0 120.0 121.3 140.2 112.4 108.4 189.5 141.1 129.1 122.4 1992 117.3 126.7 115.1 308.1 153.5 123.0 125.1 147.4 115.9 112.5 206.7 146.4 134.6 127.2
1993 1993 10 120.6 121.4 128.3 129.2 119.8 120.6 352.6 365.4 160.6 163.0 125.6 126.4 126.9 127.7 153.9 155.8 120.1 121.1 114.9 116.0 220.0 223.5 148.7 149.9 139.1 140.4 131.6 133.4 11 121.5 129.4 120.9 368.3 163.3 126.5 127.7 156.3 121.5 116.0 225.0 149.7 140.6 133.6 12 121.7 129.1 121.1 371.9 164.0 126.4 127.7 156.4 121.6 115.5 225.6 150.0 140.8 133.6 01 122.2 129.2 122.2 369.3 165.6 126.6 128.5 157.4 121.6 115.9 227.4 149.4 141.3 134.1 1994 02 122.6 129.6 122.6 370.1 165.7 126.9 128.5 158.0 122.0 116.5 228.8 150.3 141.8 134.3 03 122.6 129.8 122.8 381.0 166.2 127.2 128.5 158.3 121.9 117.3 229.3 150.7 142.2 134.4 04 122.8 130.3 123.1 386.8 166.9 127.5 129.5 158.7 122.0 117.5 230.6 152.5 142.9 134.6
Annual rate of increase (%)
\Ψή
eurostat Β DK D ELL E F IRL I L NL Ρ UK EUR 12 ERM EUR 12 ERMEUR 12
ERM 71-80 7.4 9.8 5.1 14.5 15.4 9.7 13.7 14.1 6.7 7.4 18.7 13.8 9.9 8.4 3.5 3.0 4.8 3.3
81-90 1988
4.6 1.2 5.9 4.6 2.6 1.2 19.0 13.5
9.3 4.8 6.3 2.7 7.8 2.1 9.7 5.1 4.5 1.4 2.5 0.9 17.3 9.6 6.6 4.9 6.6 3.6 5.4 2.7 2.4 1.8 2.5 1.4 4.1 2.8 2.9 1.9 1989 3 1 4.8 2.8 13.8 6.8 3.7 4.1 6.2 3.3 1.1 12.6 7 8 5.1 4.0 2.2 1.4 4.1 2.9 1990 3.4 2.6 2.7 20.4 6.7 3.2 3.2 6.5 3.7 2.5 13.3 9.4 5 7 4.5 2.7 1 8 Disp 3.5 2.3 1991 3.2 2.4 3.5 18.9 6.0 3.2 3.1 6.4 3.1 3 9 10.9 5 9 5.0 4.7 Avéra
1 8 1.4 arity be 2.7 2.3 1992 2.4 2.1 4.0 16.4 5.9 2.5 3.1 5.1 3.1 3.8 9.1 3.8 4 3 4.1
ge devi;
1.2 0.9
ween th
2.3 2.0
1993 1993 10
2.8 2.7 1.3 1.5 4.1 3.9 14.5 12.3 4.6 4.6 2.1 2.2 1.4 1.5 4.5 4.6 3.6 3.5 2.1 2.8 6.5 6.3 1.6 1.4
3.4 3.3 3.3 3.2
ition around the moa
1.4 1.4 1.0 1.0
e average and the π
2.2 2.0 2.1 2.0
[image:6.595.55.537.410.768.2]TABLE VI
CONSUMER PRICE INDICES IN ECU
1985=100 eurostat Β DK D ELL E F IRL I L NL Ρ UK EUR 12 ERM ECU 1980 78.7 70.0 72.9 68.6 72.7 73.1 58.5 63.8 77.7 74.4 65.8 69.7 70.9 71.3 71.7
1990 1988
117.5 107.6 123.7 113.7 116.1 108.8 114.9 100.9 136.4 112.5 114.3 105.0 109.3 100.6 125.2 109.6 115.4 105.2 113.2 108.2 122.6 102.3 110.0 100.2 117.8 106.8 119.0 108.0 117.0 106.9 1989 111.1 117.7 112.1 107.5 126.8 108.9 104.4 118.5 108.8 109.4 112.9 106.6 112.5 112.9 111.3 1990 117.5 123.7 116.1 114.9 136.4 114.3 109.3 125.2 115.4 113.2 122.6 110.0 117.8 119.0 117.0 1991 121.9 125.8 120.2 122.2 145.5 116.9 112.7 132.2 119.6 117.8 138.4 118.5 123.3 123.2 122.0 1992 126.7 130.1 126.9 129.8 149.6 122.3 117.4 133.9 125.2 124.2 153.8 117.3 127.2 127.0 126.8
1993 1993
10 133.8 131.4 135.5 134.3 137.8 140.8 136.6 137.6 139.3 136.7 128.7 128.3 113.4 112.2 120.9 121.0 133.3 131.1 132.6 136.2 152.1 147.2 112.2 114.0 127.9 128.7 134.0 126.9 131.0 132.1 11 133.5 135.8 140.2 139.4 135.9 128.8 113.5 120.4 133.5 135.3 148.9 115.6 128.9 127.4 132.3 12 135.6 136.8 139.6 139.7 133.5 130.1 114.8 118.7 135.5 134.3 148.7 116.6 128.8 127.0 132.4 01 136.0 137.4 140.8 137.8 133.9 130.4 117.4 120.1 135.4 133.9 150.6 117.8 129.7 127.8 133.2 1994 02 137.7 137.3 140.6 137.5 135.4 130.7 116.5 121.2 136.9 134.5 151.7 117.0 129.9 126.9 133.5 03 138.3 137.5 141.6 140.7 135.2 131.3 115.5 120.1 137.6 135.7 149.9 115.8 129.9 127.2 133.8 04 138.5 137.8 141.7 141.9 136.8 130.7 116.2 123.9 137.6 135.8 151.6 116.8 130.9 128.3 134.3
Annual rate ot increase (%)
Γ371
eurostat Β DK D ELL E F IRL I L NL Ρ UK EUR 12 ERM ECU 71-80 9.9 9.8 9.4 7.4 11.8 9.3 8.6 7.2 9.2 10.7 9.2 10.3 9.3 9.0 9.281-90 1988
4.1 0.2 5.9 3.6 4.8 1.1 5.5 5.8 6.6 8.3 4.6 1.1 6.6 2.1 7.0 2.2 4.1 0.5 4.3 0.9 6.6 4.7 4.9 11.2 5.2 3.6 5.3 1.4
5.0 2.5
1989 3.2 3.5 3.0 6.5 12.7 3.7 3.8 8.1 3.5 1.1 10.4 6.6 5.3 4.5 4.1 1990 5.8 5.1 3.6 6.9 7.6 5.1 4.7 5.7 6.1 3.5 8.6 3.2 4.7 5.4 5.1 1991 3.7 1.7 3.5 6.4 6.7 2.3 3.1 5.6 3.6 4.1 12.9 7.7 4.7 3.5 4.3 1992 4.0 3.4 5.6 5.7 2.8 4.7 4.2 1.3 4.7 5.4 11.5 -1.1 3.2 3.1 3.9
1993 1993
10 5.6 0.1 4.2 -0.2 8.6 7.0 5.2 3.5 -6.9 -4.8 5.4 1.7 -3.4 -6.8 -9.6 -2.7 6.5 0.9 6.8 5.0 -1.1 -5.8 -4.3 4.8 0.6 2.2 4.4 2.4 4.1 3.2
T A B L E VII
ECU EXCHANGE RATES
1 =d/H
1 ï f 1
eurostat 1985 1986 1987 1988 1989 1990 1991 1992 1993 93/05 93/06 93/07 93/08 93/09 93/10 93/11 93/12 94/01 94/02 94/03 94/04 94/05 05/02 05/03 05/04 05/05 05/06 05/09 05/10 05/11 05/12 05/13 05/16 05/17 05/18 05/19 05/20 05/23 05/24 05/25 05/26 05/27 05/30 05/31 B/LFR 44.9137 43.7979 43.0410 43.4285 43.3806 42.4257 42.2233 41.5932 40.4713 40.1919 40.2060 40.2940 40.7313 41.0548 41.4857 40.8884 40.3146 40.3580 40.0000 39.7980 39.8323 39.7402 39.8012 39.7244 39.7159 39.7236 39.7519 39.7206 39.7638 39.7584 39.7632 39.7652 39.7687 39.7734 39.7349 39.7540 39.7038 39.7295 39.6904 39.7287 39.7247 39.7069 DKR 8.01877 7.93565 7.88472 7.95152 8.04929 7.85652 7.90859 7.80925 7.59359 7.51093 7.49122 7.55659 7.83353 7.83300 7.71285 7.63939 7.56812 7.54171 7.56953 7.56754 7.58603 7.55863 7.57006 7.56435 7.54964 7.55625 7.55538 7.55262 7.55921 7.55800 7.55700 7.55764 7.56646 7.56638 7.56399 7.55293 7.55209 7.55763 7.55432 7.55501 7.55962 7.56405 DM 2.22632 2.12819 2.07153 2.07440 2.07015 2.05209 2.05076 2.02031 1.93639 1.95497 1.95633 1.95094 1.92126 1.91165 1.90647 1.91956 1.93091 1.94163 1.94082 1.93113 1.93467 1.93076 1.93364 1.92964 1.92966 1.92927 1.93106 1.92960 1.93191 1.93160 1.93199 1.93198 1.93190 1.93281 1.93186 1.93138 1.92929 1.93086 1.92819 1.93020 1.93008 1.92833 DRA 105.739 137.425 156.268 167.576 178.840 201.412 225.216 247.026 268.568 265.225 266.402 266.971 269.231 273.811 276.322 274.968 276996 278.817 280.085 281.644 283.714 285.832 283.585 284.163 284.163 283.964 284.287 284.362 284.670 284.906 285.357 285.935 286.497 286.729 287.555 291.059 286.115 285.478 289.228 287.602 285.588 285.389 ESC 130.252 147.088 162.616 170.059 173.413 181.109 178.614 174.714 188.370 184.557 186.246 190.384 196.343 196.052 197.089 196.356 197.082 196.212 195.976 198.705 197.568 199.416 198.854 198.862 198.872 197.717 198.867 199.115 199.407 199.482 198.998 199.167 199.179 199.329 199.352 199.750 199.379 199.824 200.283 200.658 200.714 200.521
FF HFL IRL
Yearly averages 6.79503 6.79976 6.92910 7.03644 7.02387 6.91412 6.97332 6.84839 6.63368 2.51101 2.40090 2.33418 2.33479 2.33526 2.31212 2.31098 2.27482 2.17521 0.715168 0.733526 0.775448 0.775672 0.776818 0.767768 0.767809 0.760718 0.799952 Monthly averages 6.59068 6.58549 6.64476 6.72284 6.68994 6.69015 6.66990 6.60200 6.59620 6.59455 6.58226 6.62762 6.61117 2.19301 2.19419 2.19395 2.16155 2.14690 2.14278 2.15423 2.16293 2.17397 2.17642 2.17017 2.17251 2.16677 0.802074 0.801888 0.806562 0.814538 0.821195 0.811468 0.803976 0.795770 0.778069 0.787265 0.795832 0.792764 0.791644
Daily rates: May
EXPLANATORY NOTES
Bilateral currency deviation (graph on page 3).
The various curves should be compared in pairs. To find the differential between two currencies, subtract the (positive or negative) values along the y-axis corresponding to each currency.
The graph is drawn with the curve of the strongest currency above that of the weakest. It shows therefore the relative position of each currency vis-à-vis the other currencies.
When two curves intersect or merge over a period of time there is no differential between the two currencies and their market exchange rate equals their bilateral central rate.
The graph is drawn within a horizontal band corresponding to the maximum 15% margin of fluctuation applying at any given moment to market exchange rates and the bilateral central rates of the ERM currencies. This band is divided symmetrically by a horizontal axis along which the points would be plotted if all currencies were at their bilateral central rate and there were therefore no fluctuations.
The daily market exchange rates of all currencies are compared with the relevant bilateral central rates and the differentials between the two calculated.
The maximum fluctuation between two currencies is shown within the band, symmetrical with the horizontal axis. The fluctuations of the other currencies in relation to either of the two currencies in question are shown within the maximum permissible fluctuation.
The curves are drawn by linking the daily points showing the relative positions of each currency.
Exchange rate grid (Table I).
The intervention limit rates fixed in the official grid do not always correspond exactly to + or -15 % of the central rates, since for each currency pair (whose exchange rates are inversely proportional to one another) the lower limit of the one corresponds to the upper limit of the other.
Ecu bond issues (Table II & IV).
In table II, issues are recorded as at the payment date. This bulletin only covers international and foreign issues in ecus, including ecu issues offering the option of conversion into other currencies. Main source: International Financing Review
Table II shows, under the headings:
-Business sector and Governments: national issuers, both private and public.
-Institutions: the European Investment Bank and the Commission of the European Communities (EEC, ECSC, Euratom).
-Organizations: the specialist institutions of the United Nations, the World Bank, the Council of Europe, etc
Table IV shows detailled information of the latest known issues, whatever the payment date.
Interest rates and yields on ecu investments (Table III).
The interest rates for 1, 3, 6, months and 1 year deposits are calculated on the basis of the London market rates LIBID as follows:
- until October 1993 : (source: Financial Times, Friday rate). - from November 1993 : (source : Bank of England, British Banker's Association, daily rates).
The bonds are classified according to three types of maturities: under 5 years, from 5 to 7 years and more than 7 years. The redemption yields of ecu bonds are calculated each Wednesday from a sample of fixed interest bonds, denominated in ecus and listed on the Luxembourg Stock Exchange. These yields are weighted by the amounts in circulation, (source: Luxembourg Stock Exchange).
The monthly and yearly averages are the arithmetic means of these weekly interest rates and bond yields.
Operations rates of the EMCF (Table III).
The interest rate for transactions in EMCF (European Monetary Cooperation Fund) ecus, is the weighted average of the most representative rates on the domestic money market of the countries whose currencies make up the ecu basket. It is based on the weighting of the currencies in the ecu basket as derived from the ecu central rates in force. The rate thus calculated for a given month applies to EMCF transactions for the following month. In table 3, this rate relates to the month upon which the calculations are based and not to the (following) month during which it is used by the EMCF.
Consumer price indices in national currency (Table V).
The consumer price indices in the national currency of each country measure changes in the purchasing power of one unit of national currency spent in the country concerned.
Two composite indices are calculated, covering all the Member States of the Community (EUR 12) and the nine Member States with currencies participating in the European Monetary System exchange rate mechanism (ERM). (Although the peseta has been participating in the exchange rate mechanism since 19/06/89 and has been included in the calculation of the ecu since 21/09/89, it is only taken into account in the indices relating to the ERM which are included in this bulletin for data after 30/09/89.)
These indices are calculated as weighted arithmetic means (chain indices) of the national indices, the weighting for each Member State being its relative share in the final consumption of households of the group of countries in question (EUR 12, ERM), expressed in purchasing power standards, at current prices and purchasing power parities.
Consumer price indices in ecus (Table VI).
For each country the index of consumer prices in ecus is calculated by dividing the national consumer price index by the average movement of the national currency in relation to the ecu during the month. It measures the change in the purchasing power of one ecu in the country concerned.
Three composite indices are calculated, covering all the Member States of the Community (EUR 12 and ECU), the 9 Member States participating in the European Monetary System exchange rate mechanism (ERM). (Although the peseta has been participating in the exchange rate mechanism since 19/06/89 and has been included in the calculation of the ecu since 21/09/89, it is only taken into account in the indices relating to the ERM which are included in this bulletin for data after 30/09/89.)
These three indices are calculated as weighted arithmetic means (chain-indices). The weightings are defined as follows: for the EUR 12 and ERM indices, the relative share of each Member State in the final consumption of households for the group of countries in question (EUR 12 or ERM), expressed in ecus at current prices and exchange rates (annual weighting). For the ECU index, the relative share of each Member State's currency in the calculation of the ecu (monthly weighting).
Ecu exchange rates (Table VII).
The exchange rates for the ecu against the national currencies of the Member States of the Community, the USD and yen are shown as annual averages, monthly averages (for the current year), and daily rates (for the latest available month).
L ^
1ecu =
100 =
BFR
3.301
40.2123
8.21
DKR
DM
DRA* ESCFF
HFL IRL LFR LIT* PTAFrom 21/09/89 the ecu basket has been made up as follows :
0.1976 0.6242 1.44 1.393 1.332 0.2198 0.008552 0.13 151.8 6.885
Ecu central rates from 14/05/93
7.43679 1.94964 264.513 192.854 6.53883 2.19672 0.808628 40.2123 1793.19 154.250
Weights of currencies on 14/05/93, calculated on the basis of current central rates, expressed in % :
2.66 32.02 0.54 0.72 20.37 10.01 1.06 0.32 8.47 4.46 UKL*
0.08784
0.786749
11.16
* does not participate in the exchange rate mechanism.
Venta y suscripciones · Salg og abonnement · Verkauf und Abonnement · Πωλήσεις και συνδρομές
Saies and subscriptions · Vente et abonnements · Vendita e abbonamenti
Verkoop en abonnementen · Venda e assinaturas
BELGIQUE/BELGIË IRELAND ICELAND TURKIYE
Moniteur belge / Belgisch staatsblad
Rue de Louvain 42 / Leuvenseweg 42 1000 Bruxelles / 1 0 0 0 Brussel Tél. (02) 512 00 26 Fax (02) 511 01 84
Jean De Lannoy
Avenue du Roi 202 / Koningslaan 202 1060 Bruxelles / 1 0 6 0 Brussel Tél. (02)538 51 69 Télex 63220 UNBOOK Β Fax (02) 538 08 41 Autres distributeurs/ Ovenge verkooppunten:
Librairie européenne/ Europese boekhandel
Rue de la Loi 244/Wetstraat 244 1040 Bruxelles / 1 0 4 0 Brussel Tél. (02) 231 04 35 Fax(02)735 08 60 Document delivery:
Credoc
Rue de la Montagne 34 / Bergstraat 34 Bte 11 / Bus 11
1000 Bruxelles / 1 0 0 0 Brussel Tél. (02)511 69 41 Fax (02) 513 31 95 DANMARK
J. H. Schultz Information A/S
Herstedvang 1012 2620 Albertslund Tlf. 43 63 23 00 Fax (Sales) 43 63 19 69 Fax (Management) 43 63 19 49 DEUTSCHLAND
Bundesanzeiger Verlag
Breite Straße 7880 Postfach 10 05 34 50445 Köln Tel.(02 2 1 ) 2 0 290
Telex ANZEIGER BONN 8 882 595 Fax 202 92 78
GREECE/ΕΛΛΑΔΑ
G.C. Eleftheroudakis SA
International Bookstore Nikis Street 4 10563 Athens Tel. (01)322 63 23 Telex 219410 ELEF Fax 323 98 21 ESPANA
Boletín Oficial del Estado
Trafalgar, 2729 28071 Madrid Tel. (91)538 22 95 Fax(91)538 23 49
Mundi-Prensa Libros, SA
Castello. 37 28001 Madrid
Tel. (91)431 33 99 (Libros) 431 32 22 (Suscripciones) 435 36 37 (Dirección) Télex 49370MPLIE Fax (91) 575 39 98 Sucursal:
Librería Internacional AEDOS
Consejo de Ciento, 391 08009 Barcelona Tel. (93) 488 34 92 Fax (93) 487 76 59
Llibreria de la Generalität de Catalunya
Rambla dels Estudis, 118 (Palau Moja) 08002 Barcelona
Tel. (93) 302 68 35 Tel. (93) 302 64 62 Fax (93) 302 12 99 FRANCE
Journal officiel Service des publications des Communautés européennes
26, rue Desaix 75727 Paris Cedex 15 Tél. ( 1 ) 4 0 58 77 01/31 Fax ( 1 ) 4 0 58 77 00
Government Supplies Agency
45 Harcourt Road Dublin 2 Tel. (1)66 13 111 Fax (1)47 80 645 ITALIA
Licosa SpA
Via Duca di Calabria 1/1 Casella postale 552 50125 Firenze Tel. (055) 64 54 15 Fax 64 12 57 Telex 570466 LICOSA I
Messageries du livre
5, rue Raiffeisen 2411 Luxembourg Tél. 40 10 20 Fax 49 06 61 NEDERLAND
SDU Overheidsinformatie
Externe Fondsen Postbus 20014 2500 EA 'sGravenhage Tel. (070) 37 89 880 Fax (070) 37 89 783 PORTUGAL
BOKABUD LARUSAR BLÖNDAL
Skólavórdustíg, 2 101 Reykjavik Tel. 11 56 50 Fax 12 55 60
SCHWEIZ / SUISSE / SVIZZERA
OSEC
Stampfenbachstraße 85 8035 Zürich
Tel. (01)365 54 49 Fax (01 ) 365 54 11 GRANDDUCHE DE LUXEMBOURG
Imprensa Nacional
Casa da Moeda, EP
Rua D. Francisco Manuel de Melo. 5 1092 Lisboa Codex
Tel. (01)69 34 14 Fax (01) 69 31 66
Distribuidora de Livros Bertrand, Ld.' Grupo Bertrand, SA
Rua das Terras dos Vales, 4A Apartado 37
2700 Amadora Codex Tel. (01)49 59 050 Telex 15798 BERDIS Fax 49 60 255 UNITED KINGDOM
HMSO Books (Agency section)
HMSO Publications Centre 51 Nine Elms Lane London SW8 5DR Tel.(071)873 9090 Fax 873 8463 Telex 29 71 138 ÖSTERREICH
Manz'sche Verlags
und Universitätsbuchhandlung
Kohlmarkt 16 1014 Wien Tel. (1)531 610 Telex 112 500 BOX A Fax (1)531 61181 SUOMI/FINLAND
Akateeminen Kirjakauppa
Keskuskatu 1 PO Box 218 00381 Helsinki Tel. (0) 121 41 Fax(O) 121 44 41 NORGE
Narvesen Info Center
Bertrand Narvesens vei 2 PO Box 6125 Etterstad 0602 Oslo 6 Tel. (22) 57 33 00 Telex 79668 NIC N Fax (22) 68 19 01 SVERIGE
BTJAB
Traktorvgen 13 22100 Lund Tel. (046) 18 00 00 Fax (046) 18 01 25 30 79 47
BALGARIJA
Europress Klassica BK Ltd
66. bd Vitosha 1463 Sofia Tel./Fax 2 52 74 75 CESKA REPUBLIKA
NIS CR
Havelkova 22
130 00 Praha 3
Tel. (2) 24 22 94 33 Fax (2) 24 22 14 84
MAGYARORSZAG
Euro-Info-Service
Honvéd Europa Haz Margitsziget 1138 Budapest Tel./Fax 1 111 60 61 1 111 62 16
POLSKA
Business Foundation
ul. Krucza 38/42 00512 Warszawa Tel. (2) 621 99 93. 628-28-82 International Fax&Phone (039) 120077
ROMANIA
Euromedia
65, Strada Dionisie Lupu 70184 Bucuresti Tel/Fax 0 12 96 46 RUSSIA
CCEC
9,60letiya Oktyabrya Avenue 117312 Moscow
Tel./Fax (095) 135 52 27 SLOVAKIA
Slovak Technical Library
Nm, slobody 19 812 23 Bratislava 1 Tel. (7)220 452 Fax : (7) 295 785
CYPRUS
Cyprus Chamber of Commerce and Industry
Chamber Building 38 Grivas Dhigenis Ave 3 Deligiorgis Street PO Box 1455 Nicosia
Tel. (2)449500/462312 Fax(2)458630 MALTA
Miller distributors Ltd
PO Box 25
Matta International Airport LOA 05 Malta Tel. 66 44 88 Fax 67 67 99
Pres Gazete Kitap Dergi
Pazarlama Dagitim Ticaret ve sanayi AS
Narllbaçhe Sokak N. 15 IstanbulCagaloglu Tel. (1)520 92 96-528 55 66 Fax 520 64 57
Telex 23822 DSVOTR ISRAEL
ROY International
PO Box 13056
41 Mishmar Hayarden Street Tel Aviv 61130
Tel. 3 496 108 Fax 3 648 60 39 EGYPT/ MIDDLE EAST
Middle East Observer
41 Sherif St. Cairo
Tel/Fax 39 39 732
UNITED STATES OF AMERICA / CANADA
UNIPUB
4611F Assembly Drive Lanham. MD 207064391 Tel. Toll Free (800) 274 4888 Fax (301) 459 0056 CANADA Subscriptions only Uniquement abonnements
Renouf Publishing Co. Ltd
1294 Algoma Road Ottawa, Ontano K1B 3W8 Tel. (613)741 43 33 Fax (613) 741 54 39 Telex 0534783 AUSTRALIA
Hunter Publications
58A Gipps Street Collingwood Victoria 3066 Tel. (3)417 5361 Fax (3) 419 7154 JAPAN
Kinokuniya Company Ltd
177 Shlnjuku 3Chome Shinjukuku
Tokyo 16091 Tel. (03) 34390121
Journal Department
PO Box 55 Chitóse Tokyo 156 Tel. (03)34390124 SOUTHEAST ASIA
Legal Library Services Ltd
Orchard PO Box 0523 Singapore 9123 Tel. 73 04 24 1 Fax 24 32 47 9 SOUTH AFRICA
Safto
5th Floor, Export House Cnr Maude & West Streets Sandton 2146
Tel.(011)8833737 Fax (011)8836569
A U T R E S PAYS O T H E R COUNTRIES A N D E R E LÄNDER
Office des publications officielles des Communautés européennes
2, rue Mercier 2985 Luxembourg Tél. 499 281
Télex PU BOF LU 1324 b
The bonds thus amortised were often issued several years ago and represent relatively modest unit amounts. Since redemptions in ecus received by bondholders are for the most part reinvested in ecus and supply the primary market, it Is probable that we shall witness a transformation of the amount outstanding, since the small lines will be recycled into deeper lines. Furthermore, it can be seen that the cycle favours the first harf of the year as regards both issues and redemptions
Looking at the identity of borrowers, we see the following main features: they are mainly European, although this varies from year to year. In 1982, when the first Italian ecu Treasury bonds were issued, 93% of the volume was taken up by Europeans. 1985, 1986, and 1987 saw the highest level of international participation, with 31%, 28% and 33% of the respective volumes taken up by nonEuropeans. 1993 saw a certain return to the borrowers' traditional base, with an increased proportion of domestic loans.
Institutional borrowers, i.e. governments and international institutions, form the main group with on average 56% of the volumes issued since 1981. In the private sector, since 1992 banks have accounted for an average of almost 20% of ecu bond issues compared with 14% for industrial companies, which corroborates the view that the ecu was seen more as a financial instrument than as a unit for settling commercial transactions, especially since numerous loans raised by industrial companies have been swapped for other currencies. There is a greater proportion of private borrowers when the market outlook is clear: in 1985, a particularly promising year, they were responsible for 55% of the volumes issued, while in 1993, which was perceived as sluggish, they accounted for only 5%
The lead banks for ecu Euroissues have not always been the same. In the first few years it was Belgian banks that led the field. Then the market was chiefly in the hands of French banks. In 1986, for example, all four frontrunners were French.
^
1986■υ »ι iro#uit
I C O i l f CCNEQAU HCNflANCAOIOl PAO. C
Τ
1 263b
-
■,,,,,.:,,,,,,,,,,| 6ÜU-
• V Ï ; ; Ï:Ï : Ï | 4/6--
■!!!!!!!!!!!!| 4SO ■:ν·χ·:·χ:| 300 ?x?x1 266 ivi v i l 214
r m »so
!!!!!!!!!!!H 16/6
Between 1985 and 1993 Paribas obtained the most mandates in terms of volume. Behind Paribas, however, the French banks were rapidly ousted from their leading position by the major international banks active on the Euromarket for other currencies. These banks included UPS, Morgan Stanley, Goldmann Sachs, Deutsche Bank and SBC.
r ^
1993CCL O M A N Í A C M I
MOD C A N IT A
XWI11 BANK CORP C R A t I O N
catoir Aceiocu
τ-Ι I C O
.
'Λ1·1·1·! M·!·1·1·!·1·!.'.!.!.! I . ' A J ^
·\·,..:,\.·,·:,Α<.::-Λ 7 8 /
■,,:-,:<«-A 'J/ti
■
M.!.!.!·!-!·!·!·!·!-!·!·!·!·!·!·^ 7ÌAJ
::·:::! ?£0 ■
"3 £00
■:■:■:■:■:■:■:■:! 8 t O
IDO
1
Some banks tried out the market and then withdrew. After a phase in which there were a large number of lead banks in 1985 the share of "other" banks, i.e. those not among the first ten, was larger than that of the three leaders together the market once again became more concentrated, which indicated its maturity. There were thus a number of fairly large lead banks and a smaller volume of issues was handled by banks not specialising in the ecu market.
Price (excl. VAT) in Luxembourg: Single copy ECU 11 · Subscription: ECU 79
0 0
OFICINA DE PUBLICACIONES OFICIALES DE LAS COMUNIDADES EUROPEAS KONTORET FOR DE EUROPÆISKE FÆLLESSKABERS OFFICIELLE PUBLIKATIONER AMT FUR AMTLICHE VERÖFFENTLICHUNGEN DER EUROPAISCHEN GEMEINSCHAFTEN ΥΠΗΡΕΣΙΑ ΕΠΙΣΗΜΩΝ ΕΚΔΟΣΕΩΝ ΤΩΝ ΕΥΡΩΠΑΪΚΩΝ ΚΟΙΝΟΤΗΤΩΝ
OFFICE FOR OFFICIAL PUBLICATIONS OF THE EUROPEAN COMMUNITIES
OFFICE DES PUBLICATIONS OFFICIELLES DES COMMUNAUTÉS EUROPÉENNES
UFFICIO DELLE PUBBLICAZIONI UFFICIALI DELLE COMUNITÀ EUROPEE BUREAU VOOR OFFICIËLE PUBLIKATIES DER EUROPESE GEMEENSCHAPPEN SERVIÇO DAS PUBLICAÇÕES OFICIAIS DAS COMUNIDADES EUROPEIAS