by
ROBERT DENISON DINEEN
submitted in partial fulfilment of the requirements for the degree of
Master of Science
CONTENTS
I Acknowledgements (i)
II Statement (ii)
UI
Abstract (iii)IV Abbreviations (v)
V List of Tables (vi)
VI List of Figures (ix)
Pace Mo.
CHAPTER 1
1 General Introduction 1
CHAPTER 2
2 Literature Review 3
2.1 Gas Chromatographic Identification Techniques 3 2.1.1 Retention Measurement Systems for Compound
Identification 3
2.1.2 Analytical Considerations for Retention Measurements 6 2.2 Ancillary Identification Techniques 9 2.2.1 Gas Chromatography - Mass Spectrometry 9.
2.2.2 Chemical Reaction Techniques 18
2.2.3 Gas Chromatography - Infrared Spectroscopy 27
2.2.4 Raman Spectroscopy 31
2.2.5 Nuclear Magnetic Resonance Spectroscopy (NMR) 32
CHAPTER 3
3 Experimental 34
3.1 Isolation of Essential Oils from
Atherosperma
3.2.2 Experimental 35
3.2.3 Results and Discussion 43
3.2.4 Conclusions 44
3.3 Isothermal Kovats Indices 45
3.3.1 Introduction 45
3.3.2 Experimental 45
3.3.3 Results and Discussion 52
3.3.4 Conclusions 53
3.4 Identification by Temperature Programmed Kovats Indices on Dual Columns using Polygonal and Spline
Function Approximations 53
3.4.1 Introduction 53
3.4.2 Experimental 54
3.4.3 Results and Discussion 55
3.4.4 Conclusions from Sections 3.2, 3.3, 3.4 62
CHAPTER 4
4 Gas-chromatography - Mass Spectrometry for the Identification of Components in Oil of L. lanicierum
and A. moschatum 67
4.1 Introduction 67
4.2 Experimental 67
4.3 Results and Discussion 68
4.3.1 Atherosperma moschatum oil 68
4.3.2 Leptospermum lanigerum oil 75
CHAPTER 5
5 Raman Spectroscopic Identification of Gas Chromatographic Fractions Isolated from Oil of
Atherosperma moschatum
845.1 Introduction 84
5.2 Experimental 85
5.3 Results and Discussion 92
5.4 Conclusions 97
CHAPTER 6
6 Chemical Reaction GC-MS for the Identification of
Compounds in Essential Oils 98
6.1 On-line pre-column hydrogenation GC-MS 98
6.1.1 Introduction 98
6.1.2 Experimental 99
6.1.2.1 Verfication of the Technique 99
6.1.3 Results and Discussion 100
6.1.4 Conclusions 106
6.2 Carbon Skeleton Chromatography - Mass Spectrometry
of Sesquiterpene Compounds in the Oil of
L. lanigerum
1066.2.1 Introduction 106
6.2.2 Experimental 107
6.2.3 Results and Discussion 108
6.2.4 Conclusions 108
6.3 Chemical Subtraction GC for Functional Group
Characterisation in High Boiling Point Sesquiterpene
Compounds of
L. lanigerum
1086.3.1 Introduction 108
6.3.2 Experimental 110
6.3.3 Results and Discussion 110
7.1 Introduction 114
7.2 Experimental 114
7.2.1 Raman Spectroscopy 115
7.2.2 .Infra-red Spectroscopy 120
7.2.3 NMR Spectroscopy 120
7.2.4 Isolation and Separation of Sesquiterpene Alcohols
by TLC and HPLC 123
7.3 Conclusions 129
CHAPTER 8
8 Summary 130
References 134
Appendix 1 144
2 149
3 156
4 164
5 173
my supervisors, Professor H. Bloom and Dr. J.B. Bremner.
The help of the staff of the Central Science Laboratory of the University of Tasmania is appreciated, especially Mr. J.C. Bignall, Mr. N. Davis and Mr. M. Power. Without their help with instrumental techniques some of the investigational work would not have been possible.
I am also indebted to Mrs. H. Hen and the secretarial staff of the Chemistry Department for their reproduction of diagrams and figures, and to Mrs. M. Stafford for typing this thesis.
which has been accepted for the award of any other degree or diploma in any university, and that, to the best of my knowledge and belief, this thesis contains no copy or paraphrase of material previously published or written by another person, except when due reference is made in the text of the thesis.
Methods for the identification of gas chromatographic separated components of essential oils have been investigated.
The use of relative retention data was found to be of value for identification only when known standards are available for comparison. Tabulated Kovats indices, available from references, were found to be unreliable for the identification of unknown compounds. These techniques may be of value for preliminary identification of some compounds, however it was found that spectroscopic and chemical reaction data were necessary in order to postively identify unknown compounds.
Combined gas chromatography - mass spectrometry computer techniques enabled the rapid identification of the majority of compounds present in these complex mixtures. Compounds identified by this technique were found to be in agreement with many previously identified by retention data. There were limitations in the
identification of compounds with similar spectra and the spectra of unknown compounds not being included in the data base.
Where other spectroscopic data was necessary for identification purposes, an off-line gas chromatographic sampling device was
constructed which enabled the collection of nanogram amounts of compounds eluting from a gas chromatographic column. Compounds collected this way were able to have their Raman spectra recorded without any further sample manipulation. The technique was also
used for the recording of infrared, and nuclear magnetic resonance spectra enabling positive identification of some compounds.
Subtraction gas chromatography enabled the tentative identification of the alcohol functional group in some compounds.
GC Gas Chromatography
FID Flame Ionization Detector MS Mass Spectrometer
TIC - Total Ion Current
HPLC - High Performance Liquid Chromatography CW 20m - Carbowax 20m Stationary Phase
OV-101 - OV Silicone Stationary Phase
SCOT Support Coated Open Tubular (column) WCOT Wall Coated Open Tubular (column)
FTIR Fourier Transform Infra Red (spectrophotometry) RRT Relative Retention Time
KI Kovats Indices
LR Laser Raman (spectroscopy)
NMR Nuclear Magnetic Resonance (spectroscopy) El Electron Impact
CI Chemical Ionization Fl Field Ionization FD Field Desorption tr trace
Kovats Indices
TPKI Temperature Programmed Kovats Indices TLC Thin Layer Chromatography
80°C 37 2. Relative Retention times (mins) of terpenes injected as
liquids on two dissimilar columns, reference camphene
130°C 38
3. Tentative identification of components in whole oil of
A. moschatum
CW-20 M from Fig.1 40 4. Tentative identification of components in whole oil ofA. moschatum
OV-17 from Fig.2 415. Identification of components in whole oil of
A. moschatum
by RRT on two dissimilar columns 42
6. Isothermal Kovats Indices (I) of components of whole oil of
A. moschatum
calculated from Fig.3 50 7. Isothermal Kovats Indices (I) of components of whole oilof
A. moschatum
calculated from Fig.4 51 8. Temperature programmed Kovats Indices calculated fromFig.5 for whole oil of
A. moschatum,
calculated by method of polygonal approximations and spline functionsCW-20M SCOT column 58
9. Temperature programmed Kovats Indices calculated from Fig.5 for whole oil of
A. moschatum,
calculated by method of polygonal approximationsand
spline functions0V-101 SCOT column 59
10. Compounds identified in whole oil of
A. moschatum
column by methoa of polygonal approximations and spline
functions 63
lz. Temperature programmed Kovats Indices calculated from Fig.8 for oil of L. lanigerum, uV-I01 SCUT column by
polygonal method and cubic spline functions 64 13. Compounds identified in wnole oil of Leptospermum
lanigerum by temperature programmed Kovats Indices 65 14. Comparison of compounds isolated by GC and identified
by Techniques of MS. RRT and TPKI for CW-2uM phase for
Atherosperma moschatum 71
15. Comparison of compounds isolated by GC from whole oil of
A.
moschatum and identified by techniques of MS, RRTand TPKI, OV-10i phase 73
16. Compounds present in whole oil of Atherosperma
moschatum by GC-MS on dual columns 74 17. Comparison of identification technique of compounds
isolated by GC from oil of Leptospermum lanigerum on
CW-20m phase 78
18. comparison of identification technique of compounds isolated by GC from oil of Leptospermum lanigerum on OV-101
phase 80
19. Compounds found present in whole oil of Leptospermum
Ianigerum by dual column GC-MS 81
20. Results of subtraction experiments with an injector
system packed with variour reagents 112 21. Iaentification of components in the essential oil of
1. Temperature programmed chromatogram of whole oil •of
Atherosperma moschatum
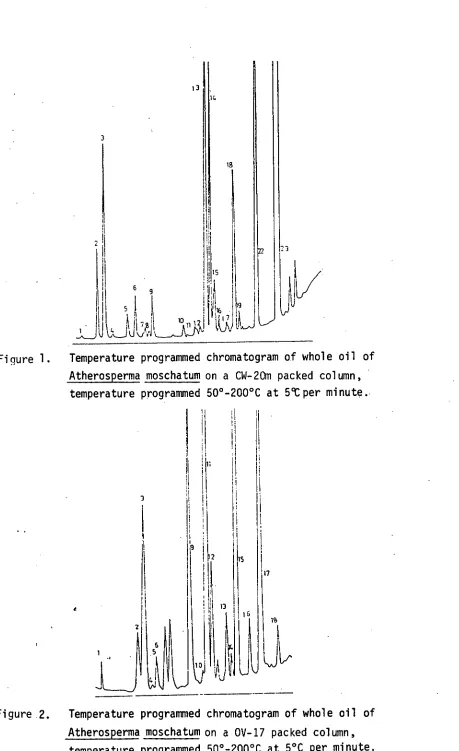
on a CW-20M column, 50-200°Cat 5°C per minute 39
2. Temperature programmed chromatogram of whole oil of
Athermsperma moschatum
on a OV-17 packed column 50-200°Cat 5°C per minute 39
3. Isothermal chromatogram of whole oil of
Atherosperma
moschatum
CW-20M SCOT column, 70°C, coinjected with nC10-C14 alkanes 49
4. Isothermal chromatogram of whole oil of
Atherosperma
moschatum
CW-20M SCOT column 150°C coinjected withn
C13-C20 alkanes 49
5. Chromatogram of whole oil of
Atherosperma moschatum,
CW-20M SCOT column temperature programmed 50°-200°Cat 5°C per minute 56
6. Chromatogram of whole oil of
Atherosperma moschatum,
OV-101 SCOT column, temperature programmed 50°-200°Cat 5°C per minute 56
7. Chromatogram of whole oil of
Leptospermum lanigerum,
CW-20M SCOT column, 50°-200°C at 5°C per minute 57 8. Chromatogram of whole oil of
Leptospermum lanigerum
OV-101 SCOT column, 50°-200°C at 5°C per minute 57 9. Total ion current trace of whole oil of
Atherosperma
moschatum,
CW-20M silica column, temperature programmed50°-220°C at 4°C per minute 70
10. Total ion current trace of whole oil of
Atherosperma
moschatum,
OV-101 silica column temperature programmed12. Total ion current trace of whole oil of L. lanigerum OV-101 silica column, temperature programmed 50°-220°C
at 4°C per minute 79
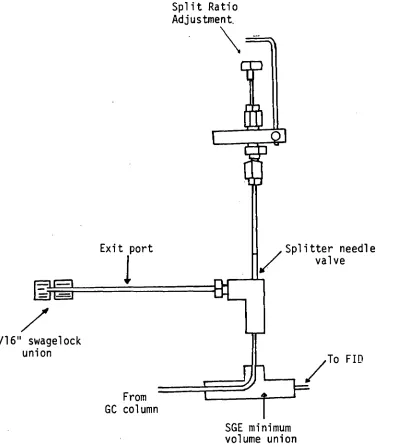
13. Conversion of SGE Inlet Splitter for use as an effluent
splitter 87
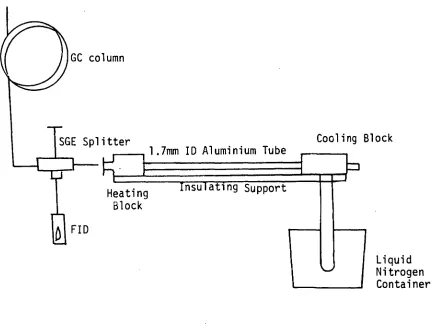
14. Temperature gradient capillary cold trap 89 15. Temperature programmed chromatogram of whole oil of
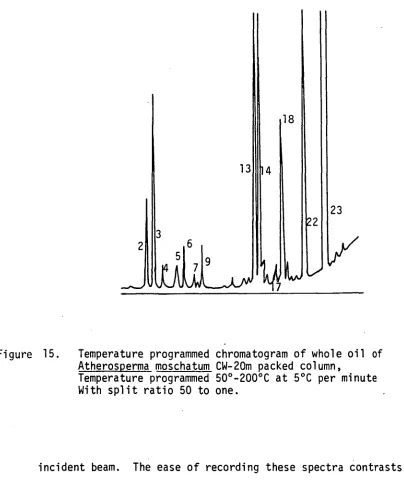
Atherosperma moschatum CW-20M packed column,
temperature programmed 50°-200°C at 5°C per minute
with split ratio 50 to one 91
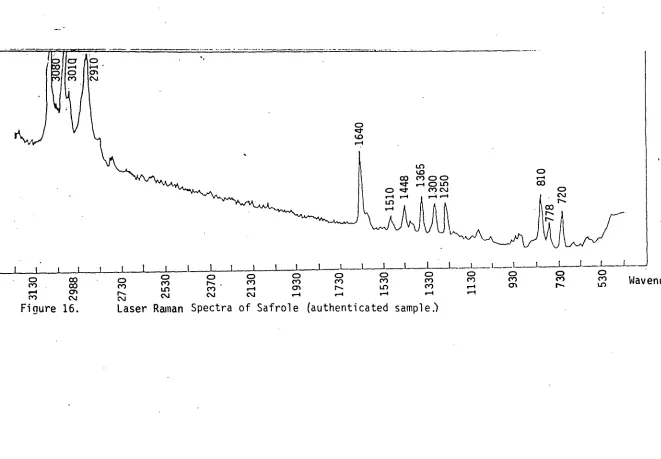
16. Laser Raman spectra of Safrole, authenticated sample 93 17. Laser Raman spectra of trapped component No.22 from
A. moschatum Identified as Safrole 94 18. Laser Raman Spectrum of Trapped Component No. 6 from
Atherosperma moschatum Identified as (-)-Limonene 95
19. Laser Raman Spectrum of GC purified (-)-Limonene 96
20. On-column Hydrogenator 99
21. Total ion current trace of pre column hydrogenator GC-MS of whole oil of A. moschatum CW-20M SCOT column H2 carrier gas, Temperature programmed 60-180° at 4°C
per minute 101
22. Mass spectra of original andhydrogenated compounds
from TIC trace 102
23. Total ion current trace of crystalline fraction of L. lanigerum, OV-1 phase, 210°C isothermal
Hydrogen carrier gas 103
isothermal, hydrogen carrier gas 104 25. Mass spectra of hydrogenated and non-hydrogenated
compounds from Fig.23 and Fig.24 105 26. Mass spectrum of carbon skeleton of both compounds
present in crystalline fraction of L. lanigerum 109 27. GC trace of crystalline sesquiterpene fraction from
L. lanigerum before and after subtraction with boric
acid 113
28. Laser Raman Spectra of Trapped Component No. 1
from Leptospermum lanigerum 116
29. Laser Raman Spectra of Trapped Component No. 2
from Leptospermum lanigerum 117
30. Laser Raman Spectra of Trapped Component No. 3
ex Leptospermum lanigerum 118
31. Laser Raman Spectra of an authenticated sample of
a-eudesmol 119
32. FTIR spectra of isolate No.1 121
33. FTIR spectra of isolate No.2 121
34. FTIR spectra of isolate No.3 identified as
a-eudesmol 122
35. FTIR spectra of authenticated sample of a-eudesmol 122 36. 'Hnmr of Isolate 1 from L. lanigerum and impurities 124 37. 'Hnmr of Isolate 2 from L. lanigerum 125 38. 'H,nmr of Isolate 3 identified as a-eudesmol and
CHAPTER 1
1.
General Introduction
The identification of components separated by gas chromatography (GC) is an important technique for structural assignment in organic analytical chemistry.
Since GC was first introduced as an analytical technique (1) many different identification systems based on a compound's retention
characteristic have been proposed with varying degrees of success. The most widely used at present is the Kovats system (2) where a compound's elution is compared with an homologous series of n-alkanes.
Increased credence can be given to identification assigned on
retention data by two dimensional chromatography, i.e. separation on one coloumn followed by separation on another column with a different phase. The resolving power of this GC system is thus increased and the possibility of compounds co-chromatographing is less. By utilization of a high
resolution dual phase chromatographic system a considerable percentage of routine identifications may often be established with reasonable certainty. Retention criteria are also of importance where structurally related compounds yield similar spectra.
Chemical reaction techniques to separate or modify components prior to GC analysis may be carried out in an isolated system, e.g. a syringe or by a reaction chamber incorporated into the GC system. Information as to the functional group, position and number of double bonds and the carbon skeleton of the compound may be obtained.
In this research project it was proposed to investigate the use of GC retention measurements for the identification of components present in complex mixtures. Where these techniques were inadequate it was also intended to examine both on-line and off-line spectroscopic methods such as laser-Raman, IR, GC-mass spectrometry (GC-MS) and NMR, that may-be necessary for correct structural identification.
It was also planned to study the usefulness of pre-column derivatization coupled with GC and GC-MS to enable the positive
identification of closely related structures that may exhibit similar retention characteristics and spectroscopic properties.
The group of compounds chosen for this study was the terpene
components of the leaf oils of Atherosperma moschatum (Sassafras, family Monimiaceae) and Leptospenmum lanigerum (Woolly Tea-tree, family Myrtaceae). Sassafras is widespread in rain forests in Tasmania, Victoria, New South Wales and Queensland, and is used for flavouring beverages, timber and craftwork. Woolly Tea-tree occurs in damp places, river banks, montane grasslands and rainforests in Tasmania, Victoria, New South Wales, Queensland and South Australia.
As the essential oil industry is one of increasing significance in Tasmania, the refinement and development of these organic analytical methods should be of value for further investigation of similar essential oils.
2. Literature Review
2.1 Gas Chromatographic Identification Techniques:
The measurements of a compound's retention in a GC column may yield information sufficient for the characterization of a compound or
information complementary to other identification techniques.
Of the various retention data measurements, those compared relative to a single arbitrary standard are widely used for data presentation (1). The system introduced by Kovats (2) where a compound's retention is
compared relative to a series of homologous compounds has gained
acceptance because of its better reproducibility compared to other forms of retention data.
As the retention time or volume of a compound in a GC system is dependent on many factors it is important to consider those chemical and physical processes which may contribute to GC separation, compound retention, and accuracy and precision of measurement.
Unfortunately, some factors affecting the degree of accuracy and precision of inter- and intra-laboratory reproducibility (3,4) can not be controlled by the laboratory worker. These factors affecting
measurement of retention data have been reviewed, e.g. Pacakova et al (5), Ettre (6) and Haken (7).
2.1.1 Retention Measurements Systems for Compound Identification The direct comparison of retention times of eluting components for identification is dependent on the reproducibility of both column and analytical conditions. As these parameters are always changing,
retention times or adjusted retention times are seldom used for identifi-cation.
standard may eliminate some of the variables associated with retention time and volume measurements. However, for reproducible results, identical conditions of column temperature, gas flow rate and accurate calculation of dead volume are necessary (7). Relative retention data for peak identification on a single column axe limited and data calculated on two columns, of different polarity often provide for a more certain identification (7).
With certain homologous series, retention values can be related to either physical or structural properties of a compound in order to give additional identification criteria. James (1) found that data from each homologous series of compounds when compared with retention characteristics resulted in straight line relationships. The use of retention increment for sample characterization was proposed.
Differentiation between two isomeric compounds has been demonstrated by Tourres (8). It was found that retention data on liquid phases of two different polarities or at two different temperatures produce plots in which isomers give lines of parallel slope. Yabamuto et al (9) have recently used these techniques to identify many components in essential oils. They also demonstrated that these techniques eliminated the possibility of two or more components exhibiting the same retention behaviour in a GC column. This possibility is most likely to occur in low resolution packed columns and has been largely overcome by the use of high resolution capillary columns.
Increment values, calculated using the relationships existing between temperature, retention index and molecular structure have been used for solute identification (10). These measurements can not usually be applied by themselves but have found use in conjunction with spectro-scopic techniques.
Isothermal indices (2) are widely used as an identification technique and data for many classes of compounds have been published. Reproducibility and precision of measurement are higher for retention indices than for
previously described methods, as standard compounds may be selected in such a way that their retention characteristics are similar to that of the measured compounds.
The disadvantage of using n-alkane standards with highly polar stationary phases has been investigated (17). Due to their complete non polarity causing low solubility in these phases, homologous series of compounds with polar functional groups have been proposed as standards for polar stationary phases.
Temperature programmed calculation of Indices has been reported (18). Van den Dool and Kratz replaced the logarithmic relationship that exists for isothermal conditions with an approximate linear relationship in
order to utilize the advantages of temperature programmed GC. Giddings (19) showed that this approximation held true for higher members of a
homologous series but departures from linearity were found for lower members of the series. The linearity of the relationship was found to be dependent on both temperature and the rate of temperature programming. Deviations from linearity in temperature programming in commercial instrumentation have been investigated. They were found to be more pronounced at either end of the program range and contributed to the non-linearity of the relationship (20).
a cubic spline function has been shown to have advantages over polygonal approximation due to smoothness of fit, and ease of calculation (21).
Interlaboratory reproducibility of retention Indices has been surveyed, however the results were found to be unsatisfactory (22). Schomburg and Dielman (23) have calculated that reproducibility should, under ideal conditions, be within one unit. Ettre (24) has proposed that the reliability of published data is sometimes much poorer than the possible reproductibility of such measurements.
2.1.2 Analytical Considerations for Retention Measurements
Where tabulated data are used for idEntification purposes, the precision with which these values can be determined and whether or not the measured values unambiguously characterize the given substance are the most important criteria.. These factors affecting measurement of data have been reviewed (5, 22) and have been found to be dependent on instrumentation, the partition process, adsorption effects, the
stationary phase, column efficiency and the calculation of gas hold up times.
Effects of the column on measuremeni of retention data have been investigated (24, 25, 26). The ideal column was considered to be one with high separation efficiency, high temperature stability,minimum
tailing characteristics, and for components of low volatility, the column should contain small amounts of stationary phase with even film homogeneity.
Pacakova (5) calculated retention indices on packed and open tubular columns and concluded that the precision of measurement is substantially higher with open tubular columns and they should therefore be preferred for precise measurements of retention data.
interchangeable for either type of column.
The use of capillary columns for retention measurements requires special sampling techniques in order to obtain reproducible results. Early methods of sample introduction (27) used a simple carrier gas inlet splitter which did not show discrimination with regard to concentration and volatility of smaple. These variations may result from incorrect gas flow geometry and temperature gradient effects. Novotny (28) found that although splitting injectors are adequate for the analysis of concentrated samples, problems can be encountered in trace analysis, particularly when the total amount of sample is limited.
Grob and Grob,(27, 29, 30) examined the direct injection of samples onto capillary columns. They demonstrated that with this technique, dilute solutions of less volatile trace components can be condensed at the column inlet with minimum band spreading whilst the more volatile solvent passes through the column without affecting the retention
characteristics of the components. Direct injection techniques may also be used to concentrate trace sample components behind the condensed solvent band (30). This sample introduction technique ensures minimum peak broadening, and maintains column efficiency and accuracy of
retention parameters.
Stationary phase composition and chemical inertness of the support and column material is of importance for precision in retention
measurements. McReynolds (31) found that batch differences in stationary phases resulted in non reproducible data. Chemical reactions such as polymerization and catalytic decomposition (32) of the stationary phase may change its chemical nature and therefore its retention characteristics.
non polar compounds the retention index was found to increase with
coating thickness due to increased solubility. A uniform film thickness must be considered necessary if reproducible retention measurements are to be made.
Effects of column materials on solute retention with identical stationary phases have been described (33). The degree of deactivation of the stationary phase support material was shown to have a marked effect on retention measurements, especially when using thin films of stationary phases. Grob and Grob (27) demonstrated that the active surface of the support material may protrude through the thin film
layer and interact with polar compounds resulting in increased retention. Accurate measurement of retention data requires that the column dead volume is well characterized. Methods utilized for calculation of this parameter are based on the linear relationship existing between
the logarithm of the retention volume of an homologous series of n-alkahes and the carbon number (35, 36). Schomburg et al (26) noted that the use of lower members of homologous series should be avoided for this
calculation as they may not show a linear relationship.
Retention parameters have been calculated without calculation of dead volume (37). Techniques are based on the third order relationship existing between the logarithm of differences of unadjusted retention times and carbon number. The major advantage of this method is that it offers the possibility of automated on-line calculation of retention indices by computer using unadjusted retention times.
Computer techniques (37, 38) for calculation of dead volume also have the advantage that retention information for a series of homologous compounds can provide a rapid statistical assessment of the operating parameters of a particular column.
discussed (22). It was found that they may be absorbed by the
stationary support resulting in considerable errors in calculation of both relative retention and Kovats Indices. In practice it is
advantageous to use a method based on carbon number calculations. Huber and Gerritze (22) have reviewed the errors resulting from the physical measurement of retention time. Errors of measurement of
starting point were found to be due to the use of the time of injection instead of the time of entry of the sample into the column. Errors in the end point determination were due to the difference between elution time of the peak maxima, as indicated by the detector, and the true value. These differences can be minimized by increased resolution of successive peaks, faster detector response and improved sampling. 2.2 Ancillary Identification Techniques
2.2.1 Gas Chromatography - Mass Spectrometry
Of the spectroscopic techniques available, GC-MS is the most widely used for the analysis of complex mixtures. With the aid of computer techniques, identification of picogram amounts of gas chromatographic effluents by mass spectrometry is now an established method. The combination of these two techniques allows for the mass spectral analysis of a highly purified sample by either on-line or off-line techniques.
In the analysis of essential oils, GC-MS has advantages over other techniques in that reliable identification of individual components in complex mixtures may be undertaken in a short period of time. Some difficulties do exist (39) in that the spectra of similar compounds may not be readily distinguished, the •direct comparison with literature spectra is not often applicable due to different ionization conditions, and the reference spectra of unknown samples may not be available.
conjunction with other techniques such as GC retention measurements and chemical derivatization may help in solving these problems. Coupling Gas Chromatography with Mass Spectrometry
Early studies of gas chromatography and mass spectrometry utilized the trapping of each component as it emerged from a GC column and the manual transfer to the batch inlet system of a mass spectrometer. Trapping and transfer of many components is, however, time consuming, and it is only applicable to low resolution packed columns. Compounds may also be chemically altered or contaminated during this process.
Direct interfacing (40) of GC and MS has overcome these problems and is accomplished by either effluent splitting or open split coupling.
Coupling by way of an effluent splitter allows only a few percent of the GC effluent into the MS (41). The efficiency of this system is low and no enrichment of the compounds in the carrier gas occurs. Gas chromatographic conditions and retention parameters are not affected and it is suitable for all types of columns.
Open split coupling may be accomplished by selecting columns for minimal carrier gas flow and connecting them directly to the ion source (42,43). Total efficiency is obtained in this technique by passing the total effluent into the MS. This is the most recommended technique (42,43,44), but is, however, restricted to small bore
capillary columns of flow rates 1 - 5 mls/minute of helium. Resolution of the column and retention indices may also be affected by the vacuum at the column exit.
50. No adsorption effects have been noted and no influence on GC separation and retention properties occur.
The separator of Watson and Bieman (47) utilizes effusion through the pores of a sintered glass fritt for enrichment. A disadvantage of this system is that it is non adjustable and optimizes only within a certain flow range with yields of only 50 percent. GC separation properties have been investigated with this separator (48) and peak broadening, especially with capillary columns, has been noted.
Llewellyn and Littlejohn (49) have developed a separator using a dimethylsilicone membrane. Enrichment values of 10 to 20 with yields of 30 to 90 percent were obtained due to the permeability of the organic sample being many times that of the carrier gas. GC retention times were not found to be distorted since the system operates at atmospheric pressure and variable flow rates can be used. The major disadvantage of this enrichment process is that its operational temperature precludes some GC-MS determinations.
Mass Spectral Identification Techniques
Determination of the parent or molecular ion peak often provides sufficient information to establish the molecular formulae for molecules of low molecular weight.
maximum peak intensities are produced by slow scanning over a limited mass range.
The reduction of the potential of the ionizing beam to near the appearance potential of the molecular ion reduces the intensity of the fragment peaks and increases the intensity of the molecular ion peak. By the selection of critical ionization voltages, molecular ionpeaks may be produced that aid in the identification of particular groups of compounds in complex mixtures (51).
Peaks which are confused with the molecular ion peak may be often excluded on the basis of normal valency structure requirements. Selection of the molecular ion may be assisted by a structural
requirement such as the "nitrogen rule" relating the number of atoms to the molecular weight of the molecules. A corollary of this (52) relates the presence of nitrogen atoms to the molecular weights of
both the molecular ion and its fragments and thus aids in identification. Fragmentation mechanism proposals may be used for identification if incomplete mass spectra are obtained from unstable and minor
components eluted in a GC-MS system. With a recognizable molecular ion peak in an incomplete fragment ion pattern, the possible fragment- ation mechanism may give information sufficient to determine functional groups and sometimes the carbon skeleton. Where conflicting data cr
e.
found, especially with terpene spectra (53), it has been suggested that fragmentation mechanisms are
Inve‘K5ar.od
by isotope labellingtechniques (54).
of both peak comparison and fragment mechanism from metastable transition methods in identification of terpenes have been noted (55).
The identification of a particular compound may be greatly assisted by the construction of the extracted ion current profile (61) of an intense ion from the spectrum of the compound. A peak will be observed in this profile at the position where the compound elutes from the gas chromatograph. If the ion is an anomalous fragment ion, the extracted ion current profile may contain almost as many peaks as the total ion current profile. The intense fragmentation observed in the El spectra of terpenoids together with the similarity of many of their El spectra renders this technique mostly unsuitable for fragment ions and
insensitive for molecular ions. Chemical ionization spectra are better suited for the generation of extracted ion current profiles due to their simplicity.
Mass Spectral Ionization Techniques
Different ionization techniques have been developed for the production of ions in mass spectral identification including chemical ionization (CI), electron impact (El), field ionization (Fl) and field desorption (FD).
Electron impact techniques are the most widely used where a reasonable assumption can often be made as to the identity of the compound. Where difficulty in establishing the molecular weight of the parent ions occurs, other less energetic techniques may be required.
Chemical ionization - MS (CIMS) provides simpler fragmentation and is a complementary technique for the identification of complex structures. With CIMS, sample molecules are ionized by reaction with ionized or excited gas molecules, resulting in fragmentation that is relatively gentle and producing an abundance of high molecular weight particles.
Under negative chemical ionization conditions, molecules exhibit less fragmentation than in positive ion CIMS. The sensitivity of the ionization process is high for compounds containing electronegative elements and with the use of selective ion monitoring techniques, subpicogram detection limits are obtainable.
With hydroxyl ion-induced CIMS, Hendrick and Bruins (59) were able to produce abundant (M-H)- ions of most oxygenated mono and
sesqui-terpenes. They were able to characterize the compounds of interest in different essential oils of the same species by combined GC-OH- negative
ion CIMS. The extracted ion current profiles of the (M-H)- and RC00-
ions gave clear identification.
Adams et al (39) have suggested that CI techniques do not solve the problem of interpretation of similar spectra, as difficulties in obtain-ing reproducible mass ion intensities for a given compound exist. Other GC spectroscopic techniques are needed to solve this problem.
Computer Techniques
The improvement of combined GC-MS instrumentation has resulted in the routine generation of large amounts of data. This has necessitated a rapid development of computer-based methods for the interpretation of spectra, instrument control and special manipulative procedures.
Interpretation of mass spectral data is well suited to computer techniques due to the fact that except for a small percentage of peaks, e.g. metastable and multiply charged species, peaks occur at integral mass units. Basic computer techniques commonly used include library search, pattern recognition and interpretative techniques. All these methods are dependent on mass spectra data bases and libraries tabulated from collected data. An attempt has been made to identify all the
An important consideration is the quality of the spectral data these libraries contain. Due to the fact that spectra are sensitive to various instrument parameters, a library may contain low quality spectra or spectra that are completely incorrect. Speck et al (63) have
developed an algorithm to give a quality rating to mass spectra based on several parameters such as election voltage, peaks at M/z values above the molecular ion, isotopic abundance ratios, illogical neutral losses, total number of peaks related to the number of atoms, and the lowest M/z reported.
In using a similar algorithm it has been shown (64) that approximately 4% of the spectra in the NIH(EPA)MSDC data base received a quality index of zero. It was emphasised that the quality index is a good indicator that the spectrum is incorrect, however it is not as good an indicator that the spectrum is of high quality.
Several workers have investigated improving the quality of mass spectral libraries. Criteria for tuning a mass spectrometer using a standard compound with well defined peaks over a wide mass range have been investigated (65). Dillard et al (66) have published a set of
standards for defining the class of a spectrum. The highest classification being for those spectra obtained under strict instrumental conditions and matching within specificed limits a spectrum of the same compound on a second instrument.
similarity index.
The probability based matching (PBM) technique has been developed by McLafferty (68, 69). This is the most widely used reverse search technique and is based on a statistical analysis of a large library to determine the probability of any given peak in a spectrum chosen at random. This program has been tested with over 800 unknown mass spectra (70) and, for spectra of pure compounds, its performance was shown to be superior to the Biemann search.
Henneberg and co-workers (71, 72) have reported the development of a system differing from the Biemann and PBM method in the choice of peaks used in the search. The SICOM search selects certain characteristic ions which may be observed in the proximity of more intense but less character-istic fragments. It is applicable to the identification of components in mixtures and compounds of similar structure if the unknown compound in not in the library. It was considered superior to the PBM search for the retrieval of certain classes of compounds (72).
The self training interpretative and retrieval system (STIRS) of McLafferty and co-workers is the most extensive of the pattern recognition
techniques (73). It consists of a number of nearest neighbour analyses based on characteristic ions, ion series and primary and secondary neutral losses in various mass ranges. Dayringer et al (74) have shown the
ability of STIRS to detect a substructure and it has also been compared with other pattern recognition techniques and found to be superior (75). Dayringer and McLafferty (76) have used STIRS for the prediction of the number of rings plus double bonds in a compound, whilst Mun et al (77) have described the application of STIRS to predict the molecular weight of a compound. With the combination of these predictions they proposed predicting elemental compositions using STIRS.
artificial intelligence methods to recognise mass spectral behaviour of particular classes of compounds. A program to generate all possible structures has been used by Masinter et al (80) where spectra are predicted from empirical mass spectrometry rules. Algorithms for calculation of predicted MS fragmentation from empirical data of known compounds have also been used (81). It is important to note that these interpretative methods are designed as an aid to, and not as a replacement for, human interpretation.
Identification by both GC and mass spectral data has been described by Blaisdell and Sweeley (82). By using a least squares method the best fit between the library spectrum in the retention index window and the chosen GC-MS scan is calculated. As retention indices are naturally ordered they give a further subsetting of the library for each unknown spectrum enabling a matching procedure with only a few of the spectra in the library. It has been found to be a faster, more definitive process as it refers only to a small set of definitive ions (83).
Previous attempts to identify terpenes by computer techniques have not been entirely satisfactory (39). By recording the spectra using on-line GC-MS the relative retention times of eluted peaks have been shown to give correct identification if used in conjunction with all detected peaks between masses 41 and 300.
Methods have been developed to interpret the spectra of incompletely resolved GC fractions (84, 85, 86) by looking at all mass spectral peaks which maximize at the same time. Where coincidence in the elution of
compounds occurs, a reverse search technique must be used (87) where the library spectrum is allowed to be embedded in the unknown spectrum.
Additional peaks in the unknown, therefore, do not detract from the calculated similarity index.
developed. Meile et al (88) have described a temperature programmed GC high resolution mass spectrometer where despite large differences in chromatographic peak width and MS cycle time, a compromise of operating parameters was established and performance was minimally affected.
Multiple-ion monitoring techniques have also been used for real time identification (89). These systems are now being used for a large number of reference compounds with automatic utilization of GC retention data.
Extraction of mass spectra free of background and neighbouring component contributions from GC-MS data has been accomplished. It is an important computer-aided technique for identification. Dromeg et al (85) have produced spectra that can be corrected for interference from
neighbouring eluants, peak saturation and column and septum bleed. It was shown that these computer manipulations allow the collection of representative mass spectra from GC-MS data of complex mixtures on a routine basis.
2.2.2 Chemical Reaction Techniques
The capability of GC and GC-MS can be exploited more fully if additional chemical information about a separated component is obtained. A number of functional group reactions based on chemical qualitative analysis such as hydrogenation, hydrogenolysis, ozonolysis, dehydrogenation and chemical subtraction may be used. With the small amounts of materials recoverable from single peaks on capillary columns, identification by other micro spectroscopic techniques is only sometimes possible and therefore the use of these ancillary chemical reactions is of importance for the identification of components resolved by gas chromatography.
these reaction techniques. The use of controls that duplicate closely the qualitative and quantitative nature of the sample can give a greater level of confidence in results from these techniques.
Hydrogenation
By utilizing hydrogen as the carrier gas, or as a component of the . carrier gas, with a nickel or palladium catalyst in an offline or on-line
reactor, the existence of carbon-carbon double bonds and other structural features of unsaturated components may be determined.
Hydrogenation has been described as a pre-column technique for pure samples
or
simple mixtures (90) or as a post column technique inconjunction with MS for the analysis of complex mixtures (91).
The principle advantage of the technique is the availability of supplementary information for many unsaturated compounds that may contain cis or trans double bonds, branched or cyclic structures and conjugated structures that would otherwise be difficult to detect by GC retention data alone (92).
Franc and Kolovskova (93) have demonstrated the technique of pre-column hydrogenation as a method for the determination of the degree of saturation of a compound. Retention volume data were used for the characterization of each peak before and after hydrogenation. Other pre-column methods have been developed by Beroza and Sarmienta (90) who used hydrogenation as an analytical technique for a wide range of
compounds such as alcohols, amides, amines, esters, and halides. They developed a device which could be used as either a post oven or injector hydrogenator to provide comparative data before and after hydrogenation. On-line pre-column hydrogenation coupled to MS has been successfully used as a derivatization technique by Henneberg et al (42). The
index increments.
Hydrogenation of components after GC separation but before entry into a Mass Spectrometer was first proposed by Lindeman (94) and has application in the analysis of complex mixtures. If the compound separated is passed into the mass spectrometer with or without hydrogen-ation, the number of double bonds can be determined from the difference in molecular weights of the parent ions. This allows hydrogenation to be used for the analysis of mixtures that may exhibit hydrogenated peaks at the same retention times as the original compound. A limiting factor is, if hydrogenation is incomplete, then interpretation of the superimposed spectra of reaction products and unchanged material creates difficulties. Another disadvantage is due to the range of reactivity of unsaturated compounds, for which a single set of conditions to fully hydrogenate a group of compounds separated by GC is impracticable.
Other applications of on-line hydrogenation have been demonstrated by Kuzmencio (95) who identified fatty acid methyl esters using
capillary GC. Complicated hydrocarbon mixtures have been analysed by Reaction GC-hydrogenation (96). Mounts and Dutton (97) have reported vapour phase hydrogenation for the analysis of fatty acid esters.
Off-line hydrogenation has been proposed by Murray et al. (98) who collected separated components from the stream splitter at the GC-MS interface concurrent with the recording of their mass spectra. A similar technique has been used by Cronin et al (99) who collected compounds on palladium coated traps allowing the sample to be hydrogenation without further handling, and the reaction products to be analysed by MS. Ozonolysis
applicable for the determination of alkylidine groups in alcohols, esters, amides, halogenated compounds, aliphatic, aromatic and heterocyclic
compounds (100). The methodology uses ozonolysis of the compound, cleaving of the resulting ozonide by reduction, oxidation, or pyrolysis, and identification of the resulting products by GC or GC-MS.
Cronin and Gilbert (99) have used ozonolysis as a technique comple-mentary to hydrogenation, characteristic colour reactions and MS, for structural identification. They have also outlined problems associated with on-line ozonolysis in a GC-MS system, and proposed an off-line
system where nanogram amounts of compounds eluted as single peaks from capillary columns were trapped on columns containing an inert support. Trapped compounds were then ozonized, cleaved by heating, and the resulting carbonyl compounds then identified by GC-MS. Other
invetigators in the field of natural products (101, 102) have been able to distinguish between acidic and aldehydic products resulting from ozonolysis by the addition of a short pre-column of zinc oxide for the selective removal of acids.
Carbon Skeleton Chromatography
This on line technique catalytically removes from each compound in the injected mixture all functional groups containing oxygen, nitrogen, sulfur and halogens to give the equivalent hydrocarbon skeleton and/or its next lower homologue. This basic skeleton is considered (92) to be a simple and logical starting point for the structural determination of a compound. The method has found use as an identification technique used in conjunction with GC for nanogram amounts of compounds and degradation products of naturally occurring materials (103-106).
When carbon skeleton chromatography is used in conjunction with Kovats Indices a more positive system of identification may be
especially terpenes, the complex mixture of reaction products may necessitate the use of MS data in addition to retention indicies so that carbon skeleton chromatography may be used to advantage.
Beroza and Inscoe have reviewed the application of carbon
skeleton chromatography for the identification of trace compounds in natural products (92). They also undertook a systematic study for the structural determination of the carbon skeleton products that result from a wide range of organic compounds (105).
Carbon skeleton chromatography has also been applied extensively to the analysis of hydrocarbons. Kulemans and Vogue (108) have
catalytically dehydrogenated C5-C8 hydrocarbons to yield the carbon skeleton. It was, however, found by Rowan, that with hydrocarbons the dehydrogenation process is complicated by the simultaneous production of many side products. These difficulties have been overcome by Klesment (110) who proposed using a carrier gas containing only 5 to 30% hydrogen which still enabled alkenes to be quantitatively saturated. Subtractive Reactions
Chemical and physical subtraction techniques may be used for the removal of specific functional groups of compounds in complex mixtures. Comparison of chromatograms before and after reaction yields additional information on reacted compounds. Subtraction may be carried out by pre-injection techniques or by on-line methods.
sample injected.
With on-line subtraction a reactor may be used either before or after the analytical GC column. Pre column techniques have been shown to have advantages (113) if the extracted components can be regenerated and rechromatographed enabling a comparison of the two chromatograms. Regeneration may be difficult and it is often necessary to inject two samples, i.e. with and without subtraction (115). An alternative technique when subtraction is irreversible is to use two detectors rather than two samples and use subtraction in a post column mode. This technique is considered the superior method as any irreproducibil-ities of injection are avoided (113).
Physical subtraction techniques for the identification of hydro-carbons using molecular sieves has been widely used and the adsorption characteristics of a wide range of compounds on these materials are known (115-120). It has only found application for the subtraction of straight chain n-alkanes and olefins from hydrocarbon mixtures.
Molecular sieves do, however, remove other low molecular weight compounds and this lack of specificity limits their use.
Saturated primary and secondary alcohols may be quantitiatively subtracted using 5% boric acid coated column packing. Tertiary alcohols are not subtracted as they do not form trialkyl borates nor are alcohols subtracted that have a double bond in a position
a
to a secondaryFree fatty acid phase (FFAP) has been investigated for the subtraction of aldehydes (126). However, with aldehydes that are branched at the a carbon atom as much as 20% may elute unchanged (122). Some epoxides were also found to be subtracted. Withers (100) has examined its use as an aldehyde subtractor and found it unsatisfactory because of its low capacity, deterioration on keeping, and resultant large variations in retention times of non aldehydic groups.
Bierl (122) found that by the formation of a Schiff base with an amine, aldehydes were able to be subtracted from complex mixtures. The most suitable reagent tested was O-dianisidine and with the exception of cyclohexanone, ketons were not affected. A disadvantage is that with
1-dianisidine, bleed was excessive over 175°C.
For the determination of epoxides Bierl (122) used a short post column reactor containing 5% phosphoric acid on chromosorb W. and found it removed up to 95% of the compound. It was concluded that subtraction by it does not necessarily mean that an epoxide is present but should be considered as a confirmatory test. Sodium metabisulphite has been found to be an acceptable subtractor for both aldehydes and ketones (111), although it does cause some retardation of compounds of boiling point in excess of 150°C due to physical adsorption effects. Most carboxylic acids may be subtracted on a pre column if 10% zinc oxide of a GC support (92). An exception was a substituted acids which were only partially subtracted. It was also demonstrated that some alcohols and phenols were removed.
On-Column Derivative Formation
Peak shifting techniques involving the formation of derivatives on a GC column, where volatile pure isolated compounds are converted to volatile derivatives have been described by Langer and Pantages (126).
eluted from a GC column and which may react to form a volatile derivative. The retention data of the derivative increases the certainty of
identification and it may be regarded as a technique analogous to dual column chromatography.
Typical applications of this methodology have been in the
determination of alkaloids and steroids (127) by acylation, alcohols by conversion to acetates,(128) and on column esterification of sesqui-terpenoids (129).
Vessel and Syringe Reactions
If a reaction proceeds too slowly in a GC system it may often be carried out in a reaction vessel prior to injection. The volatile reaction products may then be chromatographed by diversion of the carrier gas through the vessel.
The technique has been successfully used for the quantitative measurement of some functional group classes, including active hydrogen (130, 131) and primary amino group (132). These and other vessel reactions have been reviewed (92).
Hoff and Feit (133) have classified compounds according to reactions in a GC syringe. The vapours of the compounds were reacted to produce derivatives which were injected directly into a GC. These workers found that carbonyl compounds could be detected and ethers, olefins and
aromatic hydrocarbons could be differentiated. Other applications of this technique have been reviewed (113, 132).
Pyrolysis
Pyrolytic degradation techniques coupled with GC have been used extensively for the examination of sub-microgram quantities of materials of relatively low volatility that do not chromatograph easily. An
conjunction with the pyrolysis-GC system (72).
Several techniques for pyrolytic degradation have been developed, including filament, boat, quartz tube, Curie point, photochemical and laser techniques, and the methodology and applications have been reviewed biennially (20, 134-136).
Spot Tests
Conventional methods of qualitative analysis relying on specific functional groups to form colour reactions, may be adapted for use with GC enabling peaks to be characterized into particular classes of
compounds (137-140).
Walsh and Merritt (137) used a stream splitter to facilitate the classification of peaks containing any one of eleven functional groups. The simplicity of the technique enables it to be used as a method for peak identification, and the use of recently introduced trapping pro-cedures (141) may permit its extension to small bore glass capillary eluents.
Casu and Cavollotti (138) have developed a method where a thin layer strip is impregnated with reagent, then passed over the column effluent at the same rate as the detector recorder. It was found that some peaks could be attributed to overlap of a minor component containing the functional group of a major component. Except for GC-MS-computer methods, there are few other techniques that may be used to differentiate overlapped peaks so readily.
Column Chromatography, HPLC, and TLC in Combination with GC
Simple pre-fractionation techniques have been used for the separation of complex mixtures before Gas Chromatography. The fractionation of
Unfortunately acid catalysed isomerization of terpenes on some chromato-graphic adsorbents occurs and most workers have been deterrred •by this procedure.
Von Rudloff (142) has demonstrated the applicability of column chromatographic pre-fractionation to terpene analysis and has concluded, after studies with several oils, that isomerization may be largely
prevented by the use of deactivated silicic acid.
Alumina adsorbent has similarly been shown to catalyse terpenoid isomerization (143) and isomerization of epoxides to alcohols together with some side reactions.
The combination of TLC and GC may be utilized to produce a more complete separation of all components with a particular functional group within a complex mixture. By the use of silver nitrate/silica gel TLC, cis- and
trans-
unsaturated isomers may be differentiated before GC separation.Coupled GC/TLC has been used by Nigam et al (145) for the
simultaneous determination of terpenes in mint oil. Combined GC/TLC has also been described by Kaiser (146) and Janak (147), however several of the separations obtained by this technique can also be achieved by GC using the appropriate liquid phase.
Whilst HPLC is usually the method of choice for the separation of non volatile compounds, it may also be used to advantage as a pre-fractionation technique. Fractions of interest must be eluted from the column and extracted with a solvent compatible with the gas
chromatographic separation conditions. This technique is beginning to have application in studies of flavour components and commerical units coupling HPLC and GC have been described (144).
2.2.3
Gas Chromatography - Infrared Spectroscopy
is widely applicable to most compounds, it does not record the full vibrational contributions from bonds such as C-C, C=C, CEC and C-H. To adequately measure vibrational contributions from these bonds, the Raman scattering spectrum must also be recorded over the same energy range.
The IR spectrum may be used as a fingerprint method of identification, based upon a file of reference spectra, and also as a means of functional group determination. Even though group frequency data interpretation may lead to partial structural characterization, the data may confirm or be supplementary to that obtained from MS and other spectroscopic studies. In this respect IR can give structural information that may not be obtained by other techniques, such as the specific environment of the carbonyl group, the stereochemistry of the hydroxyl moiety, the presence of a gem-dimethyl system, or the type of aromatic substitution.
Recent discussion on structural identification by IR spectroscopy have been included in recent texts (148) and comprehensive reviews of on line GC-FTIR (149) and non dispersive IR sampling techniques have been published (150).
Off-line Collection of GC Fractions for IR Identification
The collection of fractions for IR analysis requires efficient sample manipulation techniques in order to provide microgram amounts of pure fractions. Many different collecting devices have been described, however few are effective for compounds of differing volatilities and for collection in the sub-microgram range. These inherent problems of isolation and collection have been well reviewed (142, 151, 152).
quantities to record an IR spectrum when sophisticated on-line GC-IR and GC-FTIR instruments are not available.
The collection of fractions for the measurement of solution spectra is preferred as the problems associated with sample transfer are reduced (153, 154). Simple condensation traps have been developed (155) which have demonstrated the efficiency of thin walled glass capillaries for collection of microgram amounts of eluents. In order to reduce fogging of the sample to a minimum, Schlenk and Sand (156) heated a section of the capillary.
Techniques have been reported for trapping fractions on potassium bromide which is then pressed into a pellet (157). It was shown that spectra could be routinely obtained on 20 pg of sample (154). If the sample was first isolated in a glass capillary and solvent washed onto a potassium bromide disc, a sensitivity increase of an order of magni-tude was obtained (158).
Collection of high boiling components directly onto a membrane filter has been investigated. An advantage of this method is that it requires no sample transfer step as the filter may be placed directly in the beam of the spectrophotometer. This technique has, however, been found to have low trapping efficiency (150).
Bierl and Beroza (151) have developed a sampling device which is effective for components in the low nanogram range that also provides for the efficient transfer of trapped compounds without a solvent. Fractions are collected on a short column of gas chromatographic packing and transferred to an IR cell. Good recoveries are obtained at the 10 ng level.
while good spectra have been recorded from microgram quantities in gas cell traps of volumes down to 45
0,
(161).As these sampling techniques only allow for the collection of microgram amounts, off-line IR identification of GC fractions has limited applicability when compared with on-line GC-FTIR and GC-MS techniques.
On-line GC-IR Techniques
The combination of GC with dispersive IR instruments has been used for many years for the direct recording of spectra. Various systems have been developed (162-164), however, they suffer from loss in quality of the spectra due to slow scan speeds of approximately 30 seconds. This combination can only be considered adequate where only a few chromatographic peaks are of interest.
These instrumentation problems have been overcome by the introduction of Fourier-transform spectrometers giving a high throughput and allowing a spectruilto be recorded in 0.25 seconds. This advantage allows a
chromatographic peak to be scanned several times and multicomponent peaks to be deconvoluted.
With this technique the GC is interfaced by a heated light path optimized to the anticipated average GC peak volume (149) resulting in the recording of a vapour phase spectrum (165). While relationships between structure and IR absorption wavelengths are well documented for solution spectra, significant differences may exist in the vapour phase (163). Although spectral shifts for some bands of up to 20 cm-1 (164) have been noted, Welti (163) has demonstrated the advantages of direct collection and examination in the vapour phase.
that an ultimate limit of 1 ng may be attained, thus sensitivity may remain a disadvantage in comparison to GC-MS.
2.2.4 Raman Spectroscopy
Raman spectroscopy complements and extends structural information available from IR spectroscopy, resulting in a more complete view of the vibrational behaviour of the molecule (166). The technique is of
particular value where the symmetry of the dipole moment restrictions of the molecule do not permit the infra-red spectrum to represent the full vibrational spectrum.
Raman spectroscopy has several advantages over IR (154) in that simpler instrumentation allows continuous measurement from 0 - 4000 cm-1 enabling location of torsional oscillations around 50 cm
distinguish conformers. In addition the Raman spectrum of water does not interfere with most measurements, whilst the intensity of the Raman bands varies linearly with concentration. As a result more distinctive fingerprint spectra are often obtained (166).
The introduction of laser excitation has enabled many fluorescent problems to be overcome, and also allows multiple passing techniques permitting an increase in the signal to noise ratio for liquids of weak scattering power (154). The collimated nature of laser energy allows focussing for excitation on small sample volumes enabling simpler
handling techniques and often smaller sample size requirements than with IR analysis.
For off-line GC-Raman spectroscopic techniques, the co-axial
viewing method enables radiation to be more efficiently collected from small bore capillary tubes using the principle of total internal
reflection. As the same glass capillary tubes may also be used to
developed that give spectra with similar detection limits to that of IR. A disposable glass capillary cell (168) made by blowing a sphere on a capillary tube and silvering one side gave good spectra on a 0.04 pi sample. Microsampling systems (154) using 0.5 mm ID capillaries for fraction collection, which were then sealed and centrifuged, gave interpretable spectra on 0.1 Ilk of sample.
On-line identification of GC fractions has been described using a Raman multichannel spectrometer (169) focussed on the exit slit of a
capillary column. Detection limits similar to FTIR have been accomplished, however little interest has been shown in the development of this
complementary on-line GC technique.
2.2.5 Nuclear Magnetic Resonance Spectroscopy (NMR)
NMR may be used to give structural information regarding the presence of particular atomic groupings, relative numbers of NMR-active nuclei in different environments, the structural relationship of the different atomic groupings and the stereochemistry and conformation of the molecule. In comparison to the previously mentioned spectroscopic techniques, the principle use for NMR is in structural elucidation of new compounds or for identification where no recorded spectra are available.
The combination of recent computer techniques with high magnetic field and pulsed Fourier transform instrumentation has enabled NMR to have the same capability with microquantities as IR spectroscopy.
Off-line collection of GC fractions for NMR analysis may be
technique which trapped fractions in a packed tube followed by vacuum-line
transfer directly into a spherical microcell.
The minimum amount of sample required to produce an . NMR spectrum
depends largely on the magnetic properties of the element of interest,
the limitations of the instrument and the sensitivity enhancement
technique used for investigation of microquantities.
Pulse methods allow a large decrease in experimental time and a
reduction in minimum sample size requirement. Fourier-transform techniques,
especially when used with multiphase instrumentation, provide a sensitivity
factor increase of one hundred or more and a considerable time saving.
This combination of advantages has allowed coupling of GC directly to an
NMR spectromer (171) where spectra were obtained on fractions flowing
through a magnetic field; the beginning and termination of the pulse
CHAPTER 3
3. Experimental
3.1 Isolation of Essential Oils from Atherosperma moschatum and Leptospermum lanigerum
Fresh foliage was collected from the Tasmanian Botanical Gardens during January 1980 and steam distilled to yield the essential oil components of both oils. The distillate was extracted with ether and the extracts were evaporated under a stream of nitrogen to give a yield of 3.4% for A. moschatum and 4.2% for L. lanigerum.
This extraction procedure is in contrast to that used by some workers (172, 173) in which the water soluble extracts were not extracted, therefore not providing a true composition of the oil. 3.2 Dual Packed Column Identification of Components in Oil of
A. moschatum by Relative Retention Data 3.2.1 Introduction
Relative retention data haveoften been investigated for the
In the choice of liquid phases, carbowax 20M has been widely used in both analytical and preparative applications due to its polar nature. Although it is less polar than PEG polymers of lower molecular weight, it exhibits better temperature stability and may be used to 220°C without excessive bleeding; OV-17 phase was selected
from the literature as a non-polar phase for the separation of terpenes according to their boiling points.
A dual-packed column low resolution GC system CW-20M, OV-17 was established in order to undertake preliminary investigations of the oil of A. moschatum.
3.2.2 Experimental (i) Preparation of columns
From the literature it was determined that the most common loadings used were 3 to 5% of liquid phase on Gas Chrom Q support 100-120 mesh.
Empty 2m x 4mm ID glass columns were washed with chromic acid, distilled water, ethanol and ether then dried under a stream of nitrogen. The columns were then silanized to block active sites by rinsing with a 5% solution of dimethyl dichlorosilane (DMCS) in toluene, rinsing with toluene and ethanol then drying under a stream of nitrogen.
Coated solid supports were prepared by mixing a slurry of the support with the appropriate solvent containing the liquid phase. The solvent was then evaporated off in a stream of nitrogen while the
Columns were packed with the aid of vacuum (approximately 250 Torr mercury) and conditioned in the GC oven by temperature programming at 0.5°C per minute over the full operating range of the particular phase. During conditioning,columns were tested for reproducibility by injection of various terpene standards until a reproducible chromatogram was
obtained.
(ii) Preparation of terpene standards
Pure terpenoids were isolated by preparative GC and their structures verified by micro IR spectrometry. These compounds were then co-injected with reference standards a-pinene at 80°C and camphene at 130°C onto both analytical columns. The relative retention times (RRT) of these
terpenoids are shown in Tables 1 and 2. (iii) Analytical GC operation
Chromatograms for calculation of RRT data were obtained using a Varian 3700 GC with dual flame ionization detectors. The following conditions were used:
Column temperature : 80°C and 130°C isothermal
Carrier gas : high purity nitrogen 30 ml/min. FID gas : hydrogen 15 psi 40 ml/min.
air 50 psi 30 ml/min. Inlet temperature : 205°C
Detector temperature : 220°C Attenuation : 32 x 10-8 Chart speed : 1 cm/min. Injection : 0.2112
(iv) Determination of RRT data for
Atherosperma moschatum
Relative retention data wmcalculated for each component of the oil using the same conditions and techniques as previously described. Iso-thermal chromatograms were run on both phases at both temperatures by co-injecting the RRT standard (a-pinene or camphene) with 0.2 pz of the oil.
A temperature programmed run of the whole oil was then undertaken on each phase, Figure 1 and Figure 2, and the tentative identification corresponding to each chromatogram is listed in Tables 3 and 4.
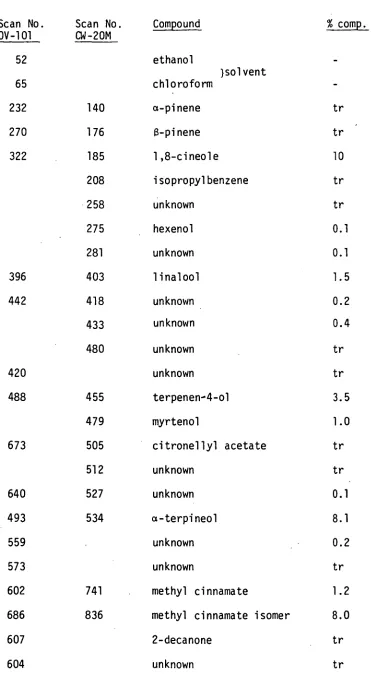
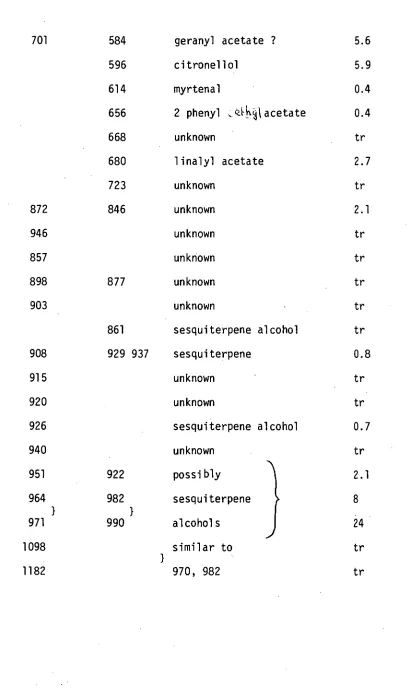
The possible identification of components present was calculated from Tables 3 and 4 and is listed in Table 5 together with percentage composition.
Table 1
Relative retention times (mins) of terpenes injected as liquids on two dissimilar columns, reference ct-pinene,80°C
5% Carbowax 20 M 5% OV-17
Terpenoid RRT RRT
camphene 1.17 1.17
S-pinene 1.37 1.48
A-3-carene 1.65 1.78
a-phellandrene 1.67 1.75
a-myrcene 1.71 1.56
(-)-limonene 2.05 2.10
(+)-limonene 2.10 2.10
cineole 2.36 2.41
0-phe11andrene 2.68 2.34
p-cymene 2.81 2.39