COMPARATIVES STUDIES OF LOAD FREQUENCY CONTROL
(LFC) USING PROPORTIONAL INTEGRAL (PI) CONTROLLER
AND FUZZY LOGIC (FL) CONTROLLER FOR TWO AREA POWER
SYSTEM
MURNI BINTI CHE SHAARI
A report submitted in accordance of the requirement for the Bachelor Degree of Control, Instrumentation and Automation (BEKC) (Hons.)
FACULTY OF ELECTRICAL ENGINEERING
UNIVERSITI TEKNIKAL MALAYSIA MELAKA
i
DEDICATION
To my beloved father, Che Shaari Bin Ab Rahim
To my beloved mother, Samsiah Binti Mat Aros
Siblings and relatives,
ii ABSTRACT
iii
ABSTRAK
iv
ACKNOWLEDGMENT
Alhamdulillah, I am thankful to the Almighty for His grace for me to successfully complete the project report. Hopefully, the efforts are blessed by Him. Appreciation and gratitude addressed to Dr Muhammad Nizam Bin Kamarudin, as the supervisor of this project has been a lot of help and guidance, attention, encouragement and advices in implementing this project. His enthusiasm and inspiration lightened the road of completing this thesis.
I give my sincere appreciation to both beloved person my father Che Shaari Bin Ab Rahim and my mother Samsiah Binti Mat Aros who is always faithful and give moral support and sacrifice a lot of time and energy including for supporting my finance during the period of study and preparing the thesis. Special thanks to my siblings and relatives who are never disappointed me give their best moral support and always be beside me whenever I need them. Thanks to project counterparts and other partners for their cooperation partners to give ideas and help a bit in the project and generating reports.
v
TABLE OF CONTENTS
DEDICATION i
ABSTRACT ii
ABSTRAK iii
ACKNOWLEDGEMENT iv
TABLE OF CONTENTS
LIST OF FIGURE 1
LIST OF TABLE 3
CHAPTER 1 4
INTRODUCTION 4
1.1 Motivation 4
1.2 Problem Statement 4
1.3 Objective 5
1.4 Scope 5
CHAPTER 2 6
LITERATURE REVIEW 6
2.1 Introduction 6
2.2 System Dynamics and Models 6
2.2.1 Power System 6
2.2.1.1 Governing System Model 8
2.2.1.2 Turbine Model 10
2.2.1.3 Generator and Load Model 11
2.2.2 Load Frequency Control 13
2.2.2.1 Frequency constant 14
2.3 Controllers 14
2.3.1 Proportional Integral (PI) Controller 14
2.3.2 Proportional Integral Derivatives (PID) Controller 15
2.3.3 Fuzzy Logic (FL) Controller 16
2.4 Conclusion 18
vi
PROPOSED RESEARCH METHODOLOGY 19
3.1 Introduction 19
3.2 System Modelling 19
3.3 Controller Design 21
3.3.1 Proportional Integral (PI) Controller 21
3.3.2 Fuzzy Logic (FL) Controller 21
3.3.3 Load Frequency Control Design 24
3.3.3.1 Simulink block diagram of single area power system
24
3.3.3.2 Simulink block diagram of two area power system
26
3.3.3.3 Simulink block diagram of power system with Fuzzy Logic controller
27
3.3.3.4 Fuzzy Logic membership function 28
3.3.3.5 Fuzzy Logic rule base 32
3.4 Flowchart 33
3.5 Result Evaluation 37
CHAPTER 4 38
RESULT AND ANALYSIS 38
4.1 Introduction 38
4.2 Result and Analysis 38
4.3 Single Area Power System 38
4.3.1 Power System without Controller 38
4.3.2 Power System with Auto tuning method PI controller Block
40
4.3.3 Power System with trials and error method PI controller
42
4.4 Two Area Power System 43
4.4.1 Area 1 Power System 43
4.4.2 Area 1 Control Error (ACE 1) of Power System 44
4.4.3 Area 2 Power System 45
vii
4.5 Fuzzy Logic Controller 48
4.5.1 Single Area Power System 48
4.5.2 Area 1 Power System 49
4.5.3 Area 1 Control Error (ACE 1) 50
4.5.4 Area 2 Power System 51
4.5.5 Area 2 Control Error (ACE 2) 52
4.5.6 Tie Line Connection between Area 1 and Area 2 53
4.6 Conclusion 54
CHAPTER 5 56
Conclusion 56
5.1 Conclusion 56
5.2 Discussion on Future Work 57
5.3 Project Milestone 57
5.4 Project Planning 57
REFERENCES 58
1
LIST OF FIGURE
FIGURE TITLE PAGE
2.1 Block diagram of Single area power system 6 2.2 Block diagram of multi area power system 7 2.3 Simplified diagram of a multi area interconnected power system 7 2.4 Schematic Governor-Turbine-Generator system 8
2.5 Turbine Model with Reheat unit 10
2.6 Mathematical modelling Block Diagram of generator for power
system 12
2.7 Complete block diagram of single area power system 13
2.8 Fuzzy Knowledge Base System 17
3.1 Single Area Power System without controller 20 3.2 Single Area Power System with controller 20 3.3 Main component of Fuzzy Logic controller 22
3.4 FLC inference system 23
3.5 Simulink block diagram with 0.1% of load perturbation single area power system without controller
24
3.6 Simulink block diagram of single area power system with auto tuning PI block controller
25
3.7 Simulink block diagram of single area power system systematic trial and error with PI controller
25
3.8 Simulink block diagram of two areas power system without PI controller
26
3.9 Simulink block diagram of two areas power system with PI controller
26
3.10 Simulink block diagram of single area power system with FL controller
27
3.11 Simulink block diagram of two areas power system with FL controller
27
3.12 Input 1 (error) 3x3 for single area power system 28
2
3.14 Output 3x3 membership function for single area power system 29
3.15 Input 1 (error) 3x3 for area 1 power system 29
3.16 Input 2 (delta error) 3x3 for area 1 power system 30
3.17 Output 3x3 for area 1 power system 30
3.18 Input 1 (error) 3x3 for area 2 power system 31
3.19 Figure 3.19: Input 2 (delta error) 3x3 for area 2 power system 31
3.20 Output 3x3 for area 2 power system 32
3.21 Flow Chart Of Project Methodology 33
3.22 Flow Chart Of Fuzzy Logic Control Methodology 34
4.1 Step response frequency deviation of single area power system without controller
38
4.2 Step response frequency deviation of single area power system with PI controller
40
4.3 Step response frequency deviation of single area power system with with different value of integral
42
4.4 Step response frequency deviation of area 1 power system 43 4.5 Step response frequency deviation of area 1 control error (ACE 1) 44 4.6 Step response frequency deviation of area 2 power system 45 4.7 Step response frequency deviation of area 2 control error (ACE 2) 46 4.8 Step response frequency deviation of tie line interconnection
between two areas power system
47
4.9 Step response frequency deviation of single area power system with FL controller
48
4.10 Step response frequency deviation of area 1 power system with FL controller
49
4.11 Step response frequency deviation of area 1 control error (ACE 1) with FL
50
4.12 Step response frequency deviation of area 2 area power system with FL controller
51
4.13 Step response frequency deviation of area 2 control error (ACE 2) with FL
52
4.14 Step response frequency deviation of tie line interconnection between two areas power system with FL controller
3
LIST OF TABLE
TABLE TITLE PAGE
3.1 Fuzzy rule decision table 23
3.2 3x3 fuzzy rule decision table 32
4.1 Transient response characteristics with 0.1% of disturbance 39 4.2 Systematic trial and error method with difference percentage of
disturbance
39
4.3 Transient response characteristics of auto tuning method 40 4.4 Transient response characteristics of systematic trial and error
method
42
4.5 Transient response characteristics of area 1 43 4.6 Transient response characteristics of area 1 control error (ACE 1) 44 4.7 Transient response characteristics of area 2 powers system 45 4.8 Transient response characteristics of area 2 control error (ACE 2) 46 4.9 Transient response characteristics of tie line interconnection
between two areas power system
47
4.10 Transient response characteristics with 0.1% of disturbance with FL controller
4.9
4.11 Transient response characteristics for area 1 power system with FL controller
50
4.12 Transient response characteristics for area 1 control error (ACE 1) with FL controller
51
4.13 Transient response characteristics for area 2 power system with FL controller
52
4.14 Transient response characteristics for area 2 control error (ACE 2) with FL controller
53
4.15 Transient response characteristics of tie line interconnection between two areas power system with FL controller
54
4 CHAPTER 1
INTRODUCTION
1.1Motivation
The interconnected power system is generally involving of single or more power utility companies which separated into control areas. So, to maintain the power angles and frequency, the control area’s generator always have different speed whether it speeding up or slowing down.
On the other side, the quality of the power system are affected by frequency, voltage and level of capability. The transformation in speed of the power system creates the frequency fluctuations and instability which also known as frequency deviation and also tie line power deviation that will bring harm to electrical equipment. The bigger the frequency deviation, the higher the probability that leads damaging the equipment, downgrading load condition, overloading the transmission lines and also interfering with system security schemes. This problem ultimately lead to performances for not working smoothly. In addition, these large frequency deviation problem will slowly leads to a system collapse usually when it is involving multi area power system.
Due to that, it is vital to make sure the frequency keep constant at its nominal value and keep frequency in acceptable range by decreasing and minimizing the transient variations in these variables and the steady state errors also should be zero.
1.2Problem Statement
5 1.3Objective
This project embarks into following objectives:
1. To model a two area power system that consists of turbine speed governing system, turbine model with reheat unit and generator with load.
2. To design load frequency control (LFC) using Proportional-Integral (PI) controller and Fuzzy Logic (FL) controller for two area power.
3. To analyse and compare the system performance (transient and steady state) of PI controller and Fuzzy Logic (FL) controller.
1.4Scope
6
CHAPTER 2
LITERATURE REVIEW
2.1Introduction
This chapter discusses related work on the frequency domain of single area power system model including governor, turbine with reheat unit and generator load. This chapter consists of the introduction to power system dynamics, the load frequency control and development types of controllers.
2.2System dynamics and models
2.2.1 Power system
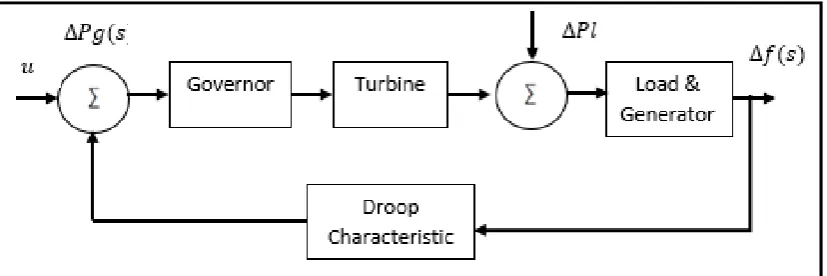
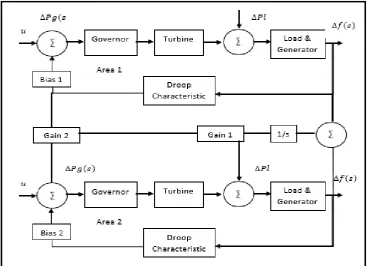
[image:14.595.100.514.498.636.2]Previous studies have reported that power system can be ultimately represented by the model shown in Figure 2.1 which is consists of governor, turbine, load (generator) and droop characteristic [12]. In real time power system, many located different subareas connecting with many loads are effect the frequency and create frequency deviation. The load frequency control problem for multi area power system connected by tie line is shown in Figure 2.3 and multi area that had been structured by combining the block diagram of single area power system is shown in Figure 2.2 [16].
7
[image:15.595.121.490.70.336.2]`Figure 2.2: Block diagram of multi area power system.
8
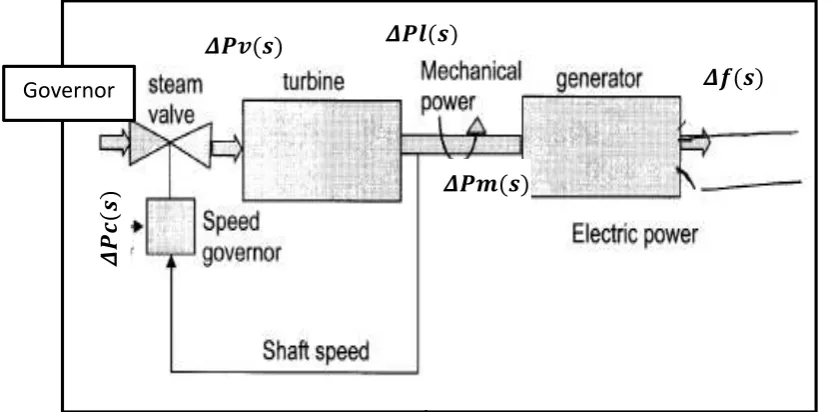
Figure 2.4 shows roughly schematic of governor, turbine and generator system in power system. [20]
[image:16.595.90.505.123.329.2]F
Figure 2.4: Schematic Governor-Turbine-Generator in power system
Where,
ΔPv = change in steam valve position
ΔPl = change in load
ΔPm = change in mechanical power
ΔPc = reference set point of steam input
Δf = small change in frequency
2.2.1.1 Governing system
In order to satisfy the load demand, the generated power increases which is beyond the mechanical power input when there is increasing generator electrical load [11]. Previous studies have reported that the purpose of the governor system is to control either the speed of the turbine or the output power which is rotational speed, ultimately referred as governor control mode and load limit control mode [19]. Figure 6 shows the block diagram of governing model including speed governor, shaft speed and steam valve position.
The main control functions of the governor system included: • Run-up control: For starting up of unsynchronized generator.
• Speed/load control: The process of generator’s fundamental, including governor control and load limit control.
Governor
𝜟𝑷𝒗(𝒔)
𝜟𝑷𝒎(𝒔) 𝜟𝑷𝒍(𝒔)
𝜟𝒇(𝒔)
𝜟
𝑷
𝒄
(𝒔
9
• Overspeed control: Provides fast-valving protection and limits the maximum speed during disturbances
• Tripping the overspeed : To stop of the turbine automatically.
On the other side, the speed governor controls the position of the valve to the shaft speed of the generator generally controls the amount of steam pass through the valve of the turbine, hence the output mechanical power of the turbine automatically controlled. Based on the previous studied, the electrical power will suddenly exceeds the input mechanical power whenever the electrical load is increased. The governor sending signal for supplying more volumes of gas, water or steam and energy that is stored in the machine is reduced to increase the speed of the prime mover and compensated deficiency in speed [3].
Recent evidence also suggested in order to make sure the generator rotate at synchronous speed, the mechanical power apply on the rotor should always parallel with the electric power output to the grid [20].
Noted that R is the speed of regulation of governor or known as ‘droop characteristic’ which governs mechanical ouput-generator speed relationship. ‘Droop’ means will increase mechanical power to regain the balance with lower frequency.
In s-domain,
𝛥𝑃𝑔 = 𝛥𝑃𝑟𝑒𝑓 − 1
𝑅 𝛥𝑓 (2.21)
The command ΔPg is changed to the steam valve position through amplifier command ΔPv. By considering simple time constant and a linear relationship and come out with this s-domain relation:
𝛥𝑃𝑣 = 1
1 + 𝑇𝑔 𝛥𝑃𝑔(𝑠) (2.22)
Thus, the governor dynamic characteristics for Thermal plant is given as below where typical value of Tg is 0.2 second. [11]
𝐺𝑔(𝑠) = ( 1
10 2.2.1.2 Turbine model
A turbine unit in power systems functioning to transform from mechanical power (ΔPm) to the natural energy, such as the energy from steam or water steam is supplied to the generator. According to the author [3], the model of turbine relates the changes in the steam valve position ΔPv and the changes in mechanical power output ΔPm.
Turbines are materially quite complex components and mechanically, which have to be manufactured and modelled wisely to overcome robust operation and safe. A number of researchers have reported, the turbines have to be well balanced and flexible enough in order handling the high speed and avoiding vibrations. Plus, the materials must the characteristic of robust against corrosion from chemicals in the steam and good temperature. Condensing turbine is one of the most common turbine type used nowadays [19].
Surveys such as that conducted by Yao Zhang [17] showed that in LFC model, there are three types of commonly used turbines which are reheat hydraulic and non-reheat, and reheat turbine.
The dynamic response of a steam turbine related in terms of transformation in power output to change in steam valve opening. The dynamic response is mainly depend on these factors:
1) Entrained steam between first stage of turbine and the inlet steam valve.
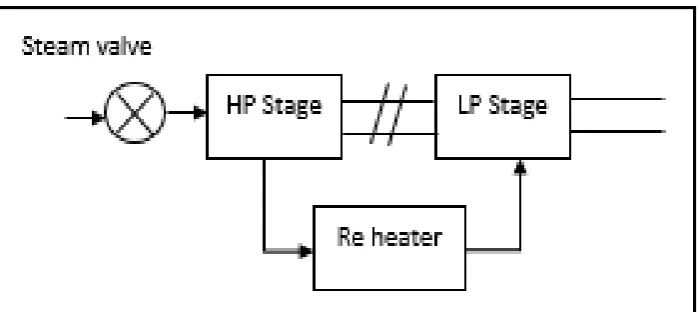
2) The output of low pressure stage lag behind the high pressure stage that causes by the storage in the reheater.
[image:18.595.133.483.561.717.2]Example of two stage steam turbine with a reheat unit that shown in Figure 2.5. For reheated turbine a second order is needed to represent reheat behaviour.
11
The first-order units referred to thermal turbines are. Between producing the turbine torque and switching the valve, a time delay occured. The thermal turbine transfer function can be represented as ;
𝐺𝑡(𝑠) = 𝛥𝑃𝑚(𝑠)
𝛥𝑃𝑣(𝑠) =
1
𝑇𝑡(𝑠) + 1 (2.24)
Where ΔPm is change in turbine power and ΔPV is the valve/gate position change of hydroelectric system, 𝛥𝑃𝑣 is change in the water valve position of hydroelectric system [11].
Second-order units referred to reheat turbines due to they have two different stages which are high and low steam pressure. The transfer function can be represented as :
𝐺𝑡(𝑠) = 𝛥𝑃𝑚(𝑠)
𝛥𝑃𝑣(𝑠) =
𝐹ℎ𝑝𝑇𝑟ℎ(𝑠) + 1
(𝑇𝑡(𝑠) + 1)(𝑇𝑟ℎ + 1) (2.25)
Where Trh is low pressure reheat time and Fhp is high pressure stage rating [17]. So the reheat unit was simplified and represented as ,
𝑟𝑒ℎ𝑒𝑎𝑡 𝑢𝑛𝑖𝑡 = ( 1 + 𝑇𝐻2(𝑠)
1 + 𝑇𝐻4(𝑠)) (2.26)
The turbine dynamics characteristics with reheat unit is given as below where Tt lies in the range 0.2-2.5s and typical value of Tt is 0.3 second.
2.2.1.3Generator load model
Previous studies have reported that the generator unit in power system changes mechanical power provided by the turbine to electrical power [9]. In load frequency control, instead of the energy transformation, frequency of the power system of the generator are highlighted.
From the swing equation of a synchronous machine due to small load perturbation [3],
2𝐻𝑑2𝛥𝛿
𝜔𝑠𝑑𝑡2 = 𝛥𝑃𝑚 − 𝛥𝑃𝑒 (2.28)
12
𝛥𝑃𝑚= the change in mechanical power 𝛥𝑃𝑒= the change in electrical power
By in terms of small change in speed,
𝑑𝛥𝜔𝑠𝜔
𝑑𝑡 =
𝐾𝑝
𝐻 (𝛥𝑃𝑚 − 𝛥𝑃𝑒) (2.29)
Laplace Transformation gives,
𝛥𝑓(𝑠) = 𝐾𝑝
𝐻𝑠 (𝛥𝑃𝑚(𝑠) − 𝛥𝑃𝑒)(𝑠) (2.30)
For load model, the load on a power system involves of differences of electrical drives. The characteristic of load speed is represented as:
𝛥𝑃𝑒 = 𝛥𝑃𝐿 + 𝐷𝛥𝜔 (2.31)
Where ; 𝛥𝑃𝐿 is the non-frequency sensitive change in load, 𝐷𝛥𝜔 is the load change that is frequency sensitive. Noted that D is load-damping constant.
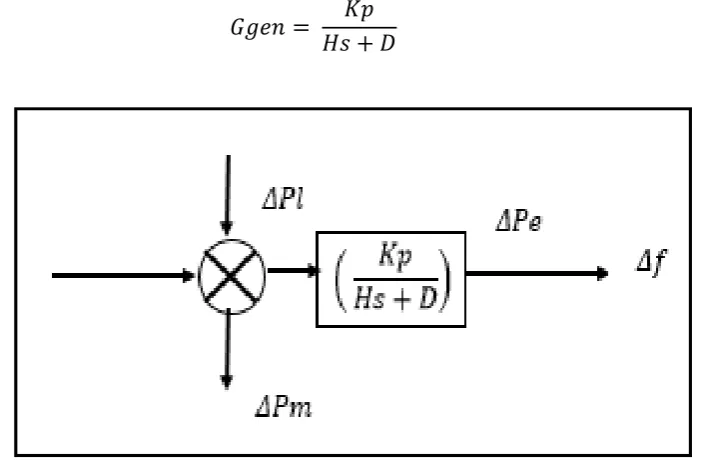
Thus, the mathematical modelling for generator was expressed as in Figure 2.6:
𝐺𝑔𝑒𝑛 = 𝐾𝑝
[image:20.595.128.480.488.718.2]𝐻𝑠 + 𝐷 (2.32)
13
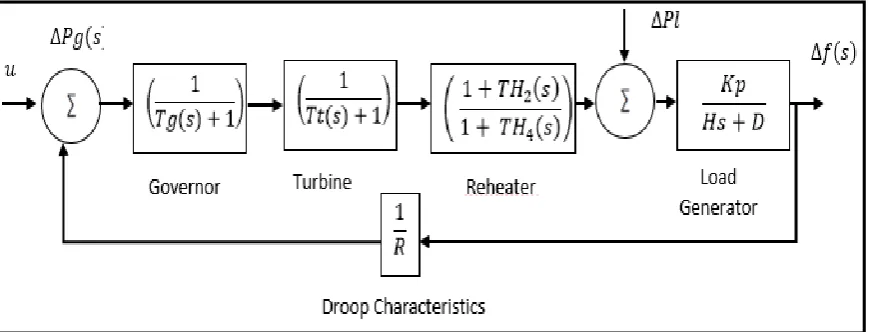
By combining all the above block diagrams of governor, turbine and generator load for single area system we get the following:
[image:21.595.94.529.120.286.2]
Figure 2.7: Complete block diagram of single area power system
2.2.2 Load Frequency Control
A number of researchers have reported that in an interconnected power system, a sudden changes in any control area leads to the frequency deviation problem and also in the tie-line powers of all the regions. This must be fixed up to make sure the distribution and generation of electric power running in highly performances. In addition, LFC is the main control problems in interconnected power system creation and is more important nowadays because of the complexity of power systems, changing structure, enhancing size, and also environmental constraints new uncertainties and emerging renewable energy sources [10]. Due to that, Automatic Generation Control (AGC) which is other name for LFC is the best way in order to hold the frequency constant [9].
Study of Amit excitation controller. As the complex implementation of the modern power system, the oscillation to any disturbance may lead to huge areas indirectly leads to system blackout. The turbine speed can be monitor by varying the governor characteristic when constant frequency is applied.
14 2.2.2.1Frequency constant
The frequency are directly related to the speed of Alternating Current motors. Plus, if the standard operating frequency is 50 Hz, but the turbines running at speeds exceed the desired point frequencies whether it less or more than 50Hz, the blades of the turbines will broke. On the other side, the operation of a transformer below the average frequency is undesirable. The flux in the core increases and then the transformer core goes into the saturation region when the frequency decrease less than rated frequency at constant system voltage
Several attempts have been made to fix this frequency deviation problem due to unbalanced frequency will end up causing trouble and bring harm to the plants. Frequency should be maintained at its normal value for power system satisfactory. According to the author [15], unscheduled frequency automatically will impact a power system efficiency capability and procedure. The bigger the frequency deviations will directly shut down the plant. Hence, this is very crucial to control the frequency in order to improve the transient performances and to ensure there are zero steady state errors.
2.3Controllers
2.3.1 PI Controller
The PI type controller is one of the command generally used controls with thermal and hydro power plants governing systems. The proportional-integral controller generates an output signal contain of two terms which this two terms will leads to zero steady state frequency deviation, but it leads to poor dynamic response. In addition, the PI controller is a lag compensator.
Previous studies have reported, due to the faster transient response proportional controller is used to achieve much quicker steady state condition where are Sanjiv Kumar Jain, Ashish Bhargava, and R. K. Pal investigated based Proportional Integral (PI) controller approaching Fuzzy Logic Controller (FLC) [8].
15
The steady-state frequency can be adjusted to the desired limit by modifying the governor speed changer setting. Proportional integral controller has been developed to enhance the dynamic response and to minimize the steady-state error. J. C. Basilio and S. R. Matos have studied about PI controller tuning with Ziegler-Nichols method such the response of the compensated power system have overshoot below a prescribed value [23].
Surveys such as that conducted by Ratnesh Chaturvedi and Bharti Dwivedi [24] showed the simulation by using Matlab/Simulink software on investigation revealed the system. The PI controller is easier for configuration but more in settling time, thus directly creates huge frequency deviation. This paper bring upt the performance of two area interconnected thermal hydro system issues with l PI and FL Controllers.
In addition, earlier stage of thesis work came out by Maksmilian Lukasz Klimontowicz and Jimmy Chih-Hsien Peng introduced decentralized Sliding Mode Control (SMC) for load frequency events in three area power system optimized conventional PI and PID controllers [4]. To propose optimal SMC parameters and conventional control gain, Genetic algorithm (GA) was effectively used.
2.3.2 PID Controller
To regulate the frequency of each area, a proportional-integral-derivation (PID) controller is used, divided among the LFC generator to develop effective control instructions for desired points of certain plants. Previous study have reported that the PID controllers are effective on easy functioned and capability where PID controllers as in the case of the lead compensator and widely used in industrial [5]. But sometime the P,I and D parameters are not always valid for specified process.
Recent evidence from Nour EL Yakine Kouba presented solving the optimal values for the PID controller for a load frequency control (LFC) of two-area interconnected power system referring to particle swarm optimization (PSO) optimization [5]. One of the goals is to prove the best method tuning for the unstable system frequency and tie line power flow. The traditional Ziegler-Nichols method was also compared to PSO. Plus, a new procedure to analyse the load frequency control with iterative Newton-Raphson method.
16
controllers are tuned using hybrid Differential Evolution-Particle Swarm Optimization (DEPSO) technique. At the Area 1, load perturbation about 1 % is injected in to investigate the representation of an importance of algorithm.
On the other side, studies of Mourad Hasni and Mohamed Boudour about LFC in many area power system based on Fuzzy Logic-PID controller show the importance in holding frequency and desired output to ensure the plant is effectively operated [9]. Based on their investigation, the deviations of the plant frequency and tie-line power flow are reduced and eliminated using this Fuzzy Logic-PID parameters. Nevertheless, the tuning method between PSO and the classical Ziegler-Nichols (Z-N) method was compared.
The author G.T.Chandra Sekhar on his initial stage of research work also introduced LFC with Fuzzy-PID controller for multi source restructured behaviourt [10]. Fuzzy PID with derivative filter controller are presented LFC which is at the initial stage, Generation Rate Constraint (GRC) and Time Delay (TD) are tested to the capability of the reasons to handle nonlinear in the system model. In addition, this novel shows positive feedback including the good results of dynamic response of the system are simulated under different transactions.
According to the previous studied from K. Saiteja and M.S. Krishnarayalu, PID controller is the most established controller in industry based on its characteristic of error activated and very easy in configuration [15]. Plus, it enhances both transient and steady state behaviours. Recent evidences of their study about LFC of two area smart grid with plug- in hybrid electric vehicle (PHEV) and wind generation presented PID different types of tuning method such as Ziegler-Nichols, PSO, MATLAB methods and ADRC controller are tested.
In addition, smart grids which need flexible controllers and ADRC enhancing the PID controller. The ADRC controller is also being used in variety areas such as aviation, aerospace, electricity and chemical plant.
2.3.3 Fuzzy Logic Controller