Development of a dynamic population model as a decision support
system for Codling Moth (Cydia pomonella L) management
M. Trapman1, H. Helsen2, M. Polfliet3
Abstract
In 2004 RIMpro-Cydia was developed as a dynamic population model that simulates the within-year biology of a local codling moth population. The model is meant to be used by growers and advisors to optimize the control of codling moth populations in organic and integrated managed orchards. The model is based on literature data and unpublished research data. Fractional boxcar trains are used to mimic the dispersion in the developmental processes. The model is run in real time on the data input of local weather stations, starting on 1 January. The output of the model was compared with the results of field observations in three years in an untreated orchard. In the years 2005 to 2007 the progress in egg deposition as predicted by the model was in general agreement with the field data. The start of the egg deposition period was predicted well. The end of the egg deposition period was predicted when in the field about 10% of the eggs was still to be laid. There was no consistency in the relation between cumulated pheromone trap catches and the cumulative egg deposition as calculated from the field data.
KeywordsCydia pomonella, codling moth, simulation model
Introduction
The biology of the codling moth (Cydia pomonella L) is strongly adapted to its primary hosts apple and pear. Codling moth is a key pest in almost all regions where apples are grown. Throughout Europe codling moth damage has increased over the last two decades. Effective codling moth control is essential for both integrated and organic fruit growers. Besides information on the mode of action and efficacy of the available insecticides, accurate data on critical time-points of codling moth development are essential to plan and implement a management strategy. For the timing of control treatments, most fruit growers and advisors in Europe rely on pheromone trap catches and temperature sums or models based on temperature sums, and evaluation of evening temperatures. More sophisticated simulation models like the Bugoff 2 model (Blago et al., 1990) are hardly used by practical advisory services, with the exception of the SOPRA model developed by Graf in Switzerland (Graf et al., 2003).
The aim in the development of RIMpro-Cydia was to create a decision support system for fruit growers and advisors, based on a dynamic simulation model for the codling moth population. Structuring detailed pieces of knowledge in a simulation model is an efficient and convenient way to combine available knowledge for practical decision making.
The outline of the model
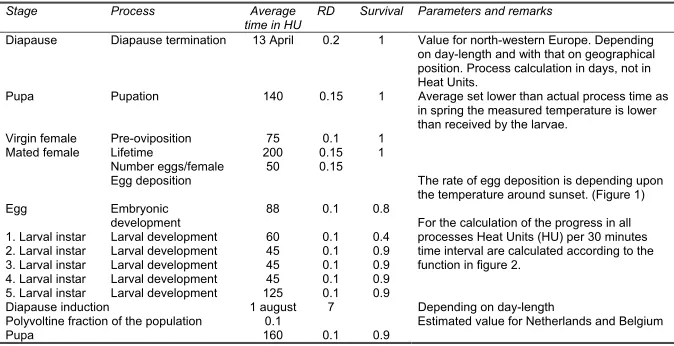
The biology of the codling moth was divided into life stages and developmental processes (Trapman, 2006) Details on life stages, average development time, relative dispersion in the process, and other parameters are given in Table 1. These data have been taken from literature, unpublished research work and practical experiences.
1 Marc Trapman, Bio Fruit Advies, Netherlands, [email protected]
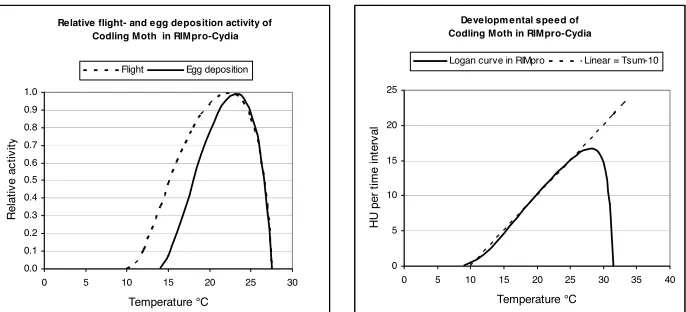
Developmental time is given in heat units (HU). Heat units are not calculated from a linear relation as temperature sums, but using a Logan curve with a lower developmental threshold of 10 °C, maximum development speed at 28 °C, and an upper threshold of 31 °C (Figs. 1 and 2). Effective HU are calculated from temperature readings at a 30 min interval. Fractional boxcar trains where used to mimic the dispersion in the processes (De Witet al., 1974). The model was coded in Visual Basic 6 as an extension to the apple scab program RIMpro. The output is presented in a self-explaining graphical format for direct use by advisors and fruit growers, as well as in a detailed tabular form for evaluation purposes.
Table 1. Details on stages, processes and parameters used in the RIMpro-Cydia program
Stage Process Average
time in HU RD Survival Parameters and remarks
Diapause Diapause termination 13 April 0.2 1 Value for north-western Europe. Depending on day-length and with that on geographical position. Process calculation in days, not in Heat Units.
Pupa Pupation 140 0.15 1 Average set lower than actual process time as in spring the measured temperature is lower than received by the larvae.
Virgin female Pre-oviposition 75 0.1 1 Lifetime 200 0.15 1 Number eggs/female 50 0.15 Mated female
Egg deposition The rate of egg deposition is depending upon the temperature around sunset. (Figure 1) Egg Embryonic
development 88 0.1 0.8 1. Larval instar Larval development 60 0.1 0.4 2. Larval instar Larval development 45 0.1 0.9 3. Larval instar Larval development 45 0.1 0.9 4. Larval instar Larval development 45 0.1 0.9 5. Larval instar Larval development 125 0.1 0.9
For the calculation of the progress in all processes Heat Units (HU) per 30 minutes time interval are calculated according to the function in figure 2.
Diapause induction 1 august 7 Depending on day-length
Polyvoltine fraction of the population 0.1 Estimated value for Netherlands and Belgium
Pupa 160 0.1 0.9
Evaluation
The output of the model was compared with field observations in three years in an untreated orchard at Vogelwaarde, Southwest Netherlands. At regular intervals all codling moth damaged fruits where collected from marked plots. The age of the individual larvae was determined from their length and the width of the head capsule. For the individual larvae their approximate date of egg deposition was back-calculated from temperature records. These data reflect only a sub-set of eggs, i.e. those eggs from which larvae have hatched and infected fruits. This effective egg deposition represents the population the grower and advisor have to deal with in practice (Helsen, Polfliet & Trapman, in preparation). Pheromone trap records for 2005 were taken form a regional registration system of 39 traps in 10 orchards. In 2006 and 2007 pheromone trap catches where recorded in the trial orchard.
The explanatory value of the model was assessed by comparing the cumulative number of eggs deposited in the field with the value calculated by the model. In the same way, the cumulative egg deposition in the field was compared with the cumulated pheromone trap catches.
Stage Process Average
time in HU RD Survival Parameters and remarks
Diapause Diapause termination 13 April 0.2 1 Value for north-western Europe. Depending
on day-length and with that on geographical position. Process calculation in days, not in Heat Units.
Pupa Pupation 140 0.15 1 Average set lower than actual process time as
in spring the measured temperature is lower than received by the larvae.
Virgin female Pre-oviposition 75 0.1 1
Lifetime 200 0.15 1
Number eggs/female 50 0.15
Mated female
Egg deposition The rate of egg deposition is depending upon
the temperature around sunset. (Figure 1)
Egg Embryonic
development 88 0.1 0.8
1. Larval instar Larval development 60 0.1 0.4
2. Larval instar Larval development 45 0.1 0.9
3. Larval instar Larval development 45 0.1 0.9
4. Larval instar Larval development 45 0.1 0.9
5. Larval instar Larval development 125 0.1 0.9
For the calculation of the progress in all processes Heat Units (HU) per 30 minutes time interval are calculated according to the function in figure 2.
Diapause induction 1 august 7 Depending on day-length
Polyvoltine fraction of the population 0.1 Estimated value for Netherlands and Belgium
Relative flight- and egg deposition activity of Codling Moth in RIMpro-Cydia
0.0 0.1 0.2 0.3 0.4 0.5 0.6 0.7 0.8 0.9 1.0
0 5 10 15 20 25 30
Temperature °C
Re
la
tiv
e
ac
tiv
ity
Flight Egg deposition
Developmental speed of Codling Moth in RIMpro-Cydia
0 5 10 15 20 25
0 5 10 15 20 25 30 35 40
Temperature °C
HU
p
er
ti
m
e
in
te
rv
al
[image:3.420.44.387.50.206.2]Logan curve in RIMpro Linear = Tsum-10
Figure 1 and 2. Relative flight activity, egg deposition and developmental speed of codling moth in Rimpro-Cydia.
Results and discussion
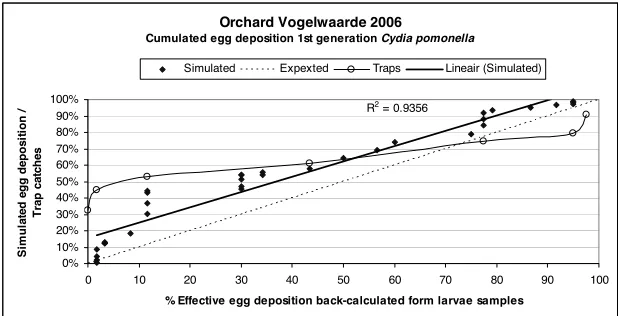
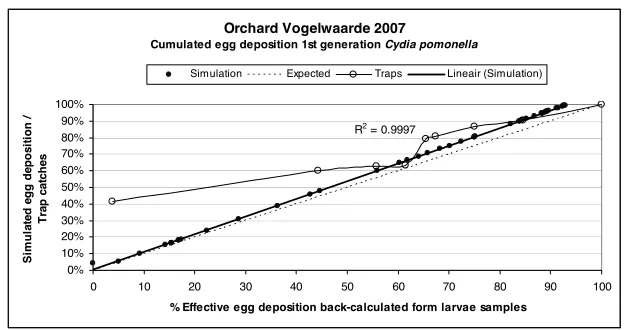
In Figs 3, 4 and 5 the simulated egg deposition is compared to the observed effective egg deposition. In these diagrams, the diagonal line y=x represents the perfect fit. Calculated egg deposition is well correlated to observed effective egg deposition in all three years, and the start of the effective egg deposition is predicted correctly by the model in each year. The termination of egg deposition, however, was predicted when in the field about 10% of the eggs still had to be laid. This was confirmed in other orchards in 2007 (data not shown). A closer analysis of the behaviour of the model is necessary to reveal the origin of these differences.
From 10 to 15 June 2006 the model predicted a massive egg deposition during a series of warm evenings at the beginning of the oviposition period (Fig. 4). Many male moths where captured during these evenings. Against all expectations, from this period only a limited number of larvae were found in the samples. This discrepancy between calculated and observed data caused the shift in the regression line in Fig. 4. A possible explanation for this case is that in our method the egg deposition data, calculated backwards from the recorded size of living larvae, only reflected the eggs of successful larvae, i.e. eggs of larvae that did not survive until sampling would have been absent from this method. As there is mortality, especially during the embryonic and first larval stage, and this mortality is probably not constant during the growing season, an absolute fit between simulation and field data is not to be expected.
Orchard Vogelwaarde 2005
Cumulated egg deposition 1st generation Cydia pomonella
R2 = 0.9889
0% 10% 20% 30% 40% 50% 60% 70% 80% 90% 100%
0 10 20 30 40 50 60 70 80 90 100
% Effective egg deposition back-calculated form larvae samples
/
noi
tis
op
ed
gg
e
det
al
u
mi
S
se
hct
ac
par
T
[image:4.420.54.364.62.223.2]Simulation Expected Trap Lineair (Simulation)
Figure 3. Simulated egg deposition and relative pheromone trap catches compared to the observed effective egg deposition (based on a sample of 163 larvae) in an untreated orchard in 2005.
Orchard Vogelwaarde 2006
Cumulated egg deposition 1st generation Cydia pomonella
R2 = 0.9356
0% 10% 20% 30% 40% 50% 60% 70% 80% 90% 100%
0 10 20 30 40 50 60 70 80 90 100
% Effective egg deposition back-calculated form larvae samples
/
noi
tis
op
ed
gg
e
det
al
u
mi
S
se
hct
ac
par
T
Simulated Expexted Traps Lineair (Simulated)
[image:4.420.55.364.273.431.2]Orchard Vogelwaarde 2007
Cumulated egg deposition 1st generation Cydia pomonella
R2 = 0.9997
0% 10% 20% 30% 40% 50% 60% 70% 80% 90% 100%
0 10 20 30 40 50 60 70 80 90 100
% Effective egg deposition back-calculated form larvae samples
/
noi
tis
op
ed
gg
e
det
al
u
mi
S
se
hct
ac
par
T
[image:5.420.53.366.48.213.2]Simulation Expected Traps Lineair (Simulation)
Figure 5. Simulated egg deposition and pheromone trap catches compared to the observed effective egg deposition (based on a sample of 98 larvae) in an untreated orchard in 2007. For the given years and location, the model outcomes provided a better description of the effective egg deposition than the cumulated pheromone trap catches.
Both at the beginning and in the second half of the flight period as registered with pheromone traps we frequently captured high numbers of moths during evenings with suitable temperatures for egg deposition that did not lead to effective egg deposition.
References
Beyers, T. (2007) Bestrijding van de fruitmot (Cydia pomonella L.) op appel (Malus x domestica Borkh.) in Roemenië. Thesis Katholieke Hogeschool Kempen, België.
Blago, N. & Dickler, E. (1990). Effectiveness of the Californian prognosis model BUGOFF 2 for Cydia Pomonella under central European conditions. Acta Hort. (ISHS) 276:53-62
Graf, B., Höpli, & Höhn, H. (2003). Optimizing insect pest management in apple orchards with SOPRA. Bulletin IOBC/SROP, Vol.26 No.11:43-48
Trapman,M. (2006) RIMpro-Cydia optimaliseert fruitmotbestrijding. Fruitteelt 22:12-13
Trapman, M., Helsen, H., & Polfliet, M. (2007) Beter bestrijdingsresultaat fruitmot door stapelen van technieken. Fruitteelt 8:12-13
Trapman,M. & Helsen, H., (2007) Nieuwe inzichten in de fruitmotbestrijding succes voor teler en milieu. Fruitteelt 47:12-13