Universities of Leeds, Sheffield and York
http://eprints.whiterose.ac.uk/
This is an author produced version of a paper published in Journal of Autism
and Developmental Disorders.
White Rose Research Online URL for this paper:
Published paper
Freeth, M., Chapman, P., Ropar, D., Mitchell, P. (2010) Do gaze cues in complex scenes capture and direct the attention of high functioning adolescents with ASD?
evidence from eye-tracking, Journal of Autism and Developmental Disorders (In
Press)
Do gaze cues in complex scenes capture and direct the attention of high functioning
adolescents with ASD? Evidence from eye-tracking.
M. Freeth1, 2, P. Chapman1, D. Ropar1, P. Mitchell1
1
University of Nottingham – School of Psychology University Park
Nottingham NG 7 2RD
2
University of Sheffield – Psychology Department Western Bank
Sheffield S10 2TP
Abstract
Visual fixation patterns whilst viewing complex photographic scenes containing one person were studied in 24 high-functioning adolescents with Autism Spectrum Disorders (ASD) and 24 matched typically developing adolescents. Over two different scene presentation durations both groups spent a large, strikingly similar proportion of their viewing time fixating the person’s face. However, time-course analyses revealed differences between groups in priorities of attention to the region of the face containing the eyes. It was also noted that although individuals with ASD were rapidly cued by the gaze direction of the person in the scene, this was not followed by an immediate increase in total fixation duration at the location of gaze, which was the case for typically
developing individuals.
Keywords
Do gaze cues in complex scenes capture and direct the attention of high functioning adolescents with ASD? Evidence from eye-tracking
The world around us is fundamentally social in nature. The aspects of the world to which we attend help us to make sense of different situations and enable us to function successfully in society. Prioritising attention towards people, especially their faces, is an innate social mechanism (Johnson, Dziuawiec, Ellis & Morton, 1991; Goren, Sarty & Wu, 1975). The eyes in particular can convey a vast array of useful information. We are sensitive to this from an early age and even young infants look at the eye-region more than the mouth region of faces (Haith, Bergman & Moore, 1979). Attending to and following another person’s eye-gaze may help us to identify their desires and intentions or alert us to important events in the environment (Ristic, Mottron, Friesen, Iarocci, Burack & Kingstone, 2005). In general we are influenced by people’s direction of gaze and attend to where others are looking (Langton & Bruce, 1999; Senju, Csibra &
Johnson, 2008). This is true even if gaze direction is not predictive of anything (Bayliss & Tipper, 2005; Driver, Davis, Ricciardelli, Kidd, Maxwell, & Baron-Cohen, 1999; Friesen & Kingstone, 1998). Having expertise in gaze processing and gaze-following are
important pre-cursors to language acquisition (Baldwin, 1995; Bruner, 1983) and theory of mind development (Baron-Cohen, 1995).
Attention to Social Stimuli in ASD
face-processing difficulties have been reported in both children and adults with ASD (Baron-Cohen, Wheelwright, Hill, Raste & Plumb 2001; Boucher & Lewis, 1992; Chawarska and Shic, in press; Joseph & Tanaka, 2003; Spezio, Adolphs, Hurley & Piven, 2007). It has been proposed that the salience of social stimuli is diminished in individuals with ASD (Dawson et al. 1998; Klin, Jones, Schultz & Volkmar, 2003).
Analysing patterns and priorities of attention may provide an indication of the reasons for some of the social difficulties experienced by individuals with ASD. In everyday life, there are more things to look at than it is possible to see at one time. Limited visual resources must be directed appropriately. The aspects of the world to which we attend influence the knowledge we have. This in turn impacts how we interact with our environment (e.g. Smilek et al. 2006). As noted by Jones and Klin (2008), a way to understand more about the world from the perspective of an individual with autism is to measure their selective sampling of their environment by recording what they choose to look at. Eye-tracking is a useful methodology for investigating spontaneous priorities and patterns of attention. Relative priorities in attention can be inferred by analysing which regions of a stimulus a participant looks at, for how long the regions are looked at and when during the course of viewing the various regions are looked at.
participants with ASD and matched controls (van der Geest, Kemner, Cafferman, Verbaten & van England, 2002).
However, presenting faces alone is not particularly ecologically valid given that faces are not pre-selected in everyday life, we must first select the face from a complex visual array. This criticism was addressed by Riby and Hancock (2008). They presented a series of photographic scenes containing people to a group of individuals with ASD and a typically developing group. Overall, the ASD participants fixated the eye regions of the people in the scenes less than the typically developing participants suggesting that eye regions were given lower priority by the ASD group. The participant cohorts in the Riby and Hancock (2008) study were adolescents who had an average non-verbal mental age of five years. It has previously been suggested that mental age is a strong predictor of social ability in individuals with ASD (e.g. Leekam, Hunnisett & Moore, 1998). It is therefore important not to generalise inferences made from studies conducted with developmentally delayed individuals with ASD to individuals with ASD that do not have a comorbid developmental delay. As screening, diagnosis and genetic understanding continuously improves, some researchers now believe that there may actually be no link between ASD and developmental delay (e.g. Skuse, 2006; 2007), highlighting the value of conducting studies with individuals at the high-functioning end of the ASD spectrum.
eyes. However, it is likely that the way the “intense social interactions” and complex stories were processed was fundamental to the visual fixation patterns observed. It is also possible that certain aspects of the stimuli which are not typically present in real-life, such as changes in camera angles, scene cuts and snippets of dialogue, may have influenced fixation patterns. It is therefore necessary to analyse the components of complex social stimuli separately in order to understand where similarities and differences lie between typically developing individuals and individuals with ASD. A study by Speer, Cook, McMahon and Clark (2007) compared the visual fixation patterns of participants with ASD and matched controls when viewing a series of scene clips, used by Klin et al. (2002), and visual fixation patterns when viewing a series of still frames from the same film. No differences were reported in gaze duration when static stimuli were viewed which may suggest that high-functioning individuals with ASD attend to social stimuli in a similar manner to matched controls when certain components such as motion, audio, social interaction and emotion information are removed. However, Speer et al. (2007) used a relatively small participant cohort (n=12 in each group) with a wide age range (9-18years) and a long presentation time for each static photo (10seconds each). This may have reduced the sensitivity of the study to any differences between groups. Hence, the propensity of high-functioning individuals with autism to selectively attend to people when presented with complex scenes warrants further in-depth investigation. This issue is addressed in both experiments 1 and 2 of this paper. Multiple eye-tracking measures analyse the priorities and patterns of attention in relation to a person within a scene.
Gaze Direction Processing in ASD
ASD (Chawarska, Klin & Volkmar, 2003; Ristic et al. 2005; Swettenham, Condie, Milne & Coleman, 2003). However, as far as we are aware, no studies to date have investigated whether when viewing a complex scene, participants’ fixation patterns are affected by the eye-gaze direction of an observed person in typically developing individuals or in
individuals with ASD. It is important to know whether eye-gaze direction cues visual fixation patterns in complex arrays. In everyday life we are continuously faced with a complex visual array within which the eye-gaze direction of a person is an extremely minor component. However, missing gaze information or using it inaccurately could have major social implications. It is therefore important to understand how typically
developing individuals and individuals with ASD attend to this information.
The Current Study
Here we present two eye tracking experiments investigating the selective attention of high-functioning adolescents with ASD to a person in a complex scene, especially their face, and the impact of their direction of eye gaze on the observer’s attention. A series of complex photographic scenes were viewed for 5 seconds each (Experiment 1) and 2 seconds each (Experiment 2). Each contained a person either looking straight out of the photo or looking at an object in the photo. The gaze direction of a person in eight
In accordance with the findings of Birmingham et al. (2008) we predicted that typically developing participants would prioritise their attention towards a person’s face, particularly their eyes, when viewing the scenes. If individuals with ASD do not prioritise their attention to faces as strongly, especially the eyes, (Dalton et al. 2005; Klin et al. 2002; Pelphrey et al. 2002) then presumably less time will be spent looking at the face, especially the eyes, and the face will not be looked at as early in viewing, in the ASD group.
Based on previous research using attention cueing paradigms (Driver et al. 1999; Friesen & Kingstone, 1998; Langton & Bruce, 1999) we predicted that the eye-gaze direction of the person in the scene will be a strong cue, affecting visual fixation patterns. If attention to gaze direction is not a strong cue for individuals with ASD then we would expect to see less gaze following in the ASD group.
EXPERIMENT 1
Method
Participants
Oswald (2006) showed that there is a high degree of agreement between clinical and research diagnosis, with research instruments sometimes leading to over diagnosis. However, this lack of independent diagnosis may be viewed as a limitation of the methodology.
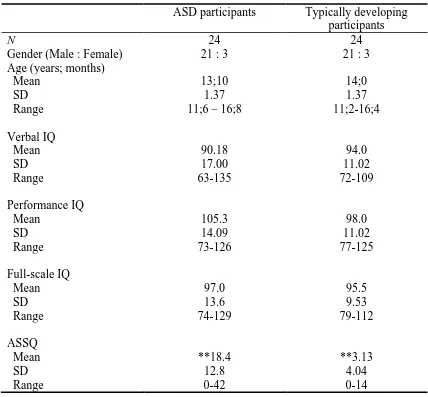
An Autism Spectrum Screening Questionnaire (Ehlers, Gillberg and Wing, 1999) was completed by a teacher or parent of each participant giving an indication of current level of autistic features. The ASSQ served to identify between group differences on current levels of autistic features. Ehlers et al. (1999) note that imposing cut-off scores at any level will cause a certain percentage of true cases of ASD to be missed. As all participants in the ASD group had an official diagnosis from a clinician, participants were not included or excluded from the ASD sample on the basis of ASSQ scores. An independent-samples t-test demonstrated that there were significant between group differences on ASSQ scores, t(46)=5.38, p<.001, d=1.6.
All participants completed the Wechsler Abbreviated Scale of Intelligence (WASI) providing measures of verbal IQ, performance IQ, and full-scale IQ. An independent samples t-test found no differences between the groups on full-scale IQ, t(46)=0.2, p=.84, d=0.06. See Table 1 for further details of participant information. All participants had normal or
corrected-to-normal visual acuity.
(Insert Table 1 about here)
Stimuli and Design
the centre. The person was either looking straight out of the photo or looking at an object on the opposite side of the photo. The middle of the object looked at was approximately 120 pixels to the opposite side of centre to the person (12.5%). The photos were then vertically cropped and compressed to a final stimulus size of 1024 x 512 pixels. Each participant was presented with 8 target photos depicting 8 different scenes containing one person – 4 in which the person in the photo had straight gaze, (Figure 1a) and 4 in which the person looked towards an object (Figure 1b). A different person appeared in each scene. Of the 8 indoor scenes, 4 contained a male and 4 contained a female, each with a neutral expression.
Three different distinctive objects were placed in three locations in each photo: Location 1 – the exact location of gaze; Location 2 – on the same side of the photo as the location of gaze but not in the direction of gaze; Location 3 – on the opposite side of the photo to the direction of gaze (see Figure 1a as an example). Two different versions of each photo were constructed, each version containing a different set of objects in the three locations. This was done to reduce the potential impact of particularly salient or non-salient objects. We verified that in each scene the object in location 1 was in the exact location of gaze by conducting a study on 16 undergraduate and postgraduate students at the University of Nottingham. The majority of pilot participants were able to correctly identify the object being gazed at in each photo and the mean agreement was 86%.
A total of 8 versions of 8 target photo scenes were used. The 8 versions enabled counterbalancing of the following factors for each target photo: person location x 2 (left/right - mirror image of left version); gaze direction x 2 (straight/towards object in location 1); object set x 2 (object set 1/object set 2), hence 64 photos were constructed in total requiring 8 between-subject conditions in total for counter-balancing purposes.
object 3. The regions were defined by 4 pixel co-ordinate points which represented a rectangular area for each region. Fixations falling within the co-ordinates of each rectangle were defined as being on that region of interest. As can be seen from Figure 1a some of the regions did not naturally fall within one rectangle so some regions were defined by two rectangles combined.
Sixteen filler photos were also constructed. Each photo was of an everyday scene containing at least one person. The scenes were composed differently to the target photos in order that participants did not become overly aware of the set-up of the target photos. When a filler photo only contained one person, the person was in a different location to the person in the target photos e.g. in the centre of the photo rather than 12.5% to the left or right. Some filler photos were of outdoor scenes and people in the photos were looking in various directions.
(Insert Figure 1 about here)
Apparatus
Eye movements were recorded using a remote Tobii 1750 eye-tracker system. The frequency of recording was 50Hz and was accurate to 1o of visual angle. The images were displayed on a 19” colour LCD monitor at a distance of approximately 60cms and subtended a visual angle of approximately 32 o horizontally and 24 o vertically. The screen resolution was set to 1024x768 pixels. Participants were free to move their head position throughout the experiment but were asked to “sit quite still”. A 9-point calibration was conducted using Clear View. An accurate calibration required participants to fixate within 1o of each fixation point. Accuracy of recording was maintained throughout the experiment as long as
this virtual space caused recording to temporarily stop, returning the head to the correct position re-started recording. Fixation locations and durations were recorded. A fixation was recorded if eye-tracking points were within 1.5o of visual angle for 80ms or more.
Procedure
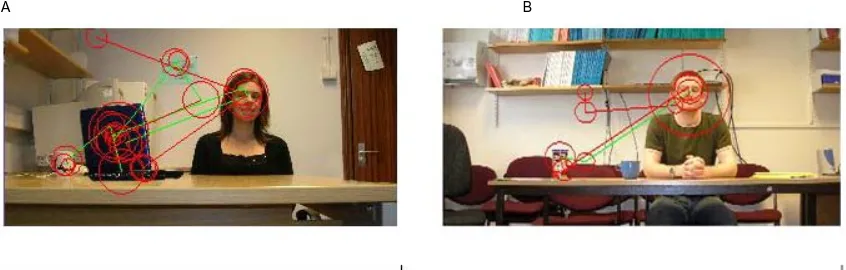
Following a calibration on the Tobii 1750 eye-tracker and a head position check immediately prior to the experiment, participants were presented with written instructions on the screen which were also read aloud by the experimenter. Participants were told that they were about to see 24 photos that would appear on the screen one at a time. They were told that in this phase of the experiment all they needed to do was to look at the photos. The 8 “target” and 16 “filler” photos were then sequentially presented for 5 seconds each separated by a blank screen presented for approximately 350ms whilst the fixation data from the previous photo was saved by the eye-tracker. Each participant viewed the scenes in the same sequence with two “filler” scenes being presented followed by one “target” scene. This sequence was repeated until all 24 photos had been viewed. Maintaining a constant scene order enabled systematic manipulation of the order of presentation of the counterbalanced factors – gaze direction; person location and object set. Visual fixation data from the eight target photos for each participant was analysed. Target photos were separated by filler photos to distract participants from the general set-up of the target photos. Participants were not alerted to the fact that certain photos were “targets” and certain photos were “distracters”. An example of a representative scanpath of a typical participant can be seen in Figure 2a.
Results and Discussion
An accurate calibration was obtained for each participant. All participants were within 2 standard deviations of the group mean in time to first fixate the photo and total gaze
duration on the screen throughout the experiment and so were included in the main analysis. Before conducting any parametric tests the assumptions of normality, homogeneity and sphericity were checked. In any case where these assumptions were breached, appropriate transformations were carried out on the data. In all other cases the relevant assumptions were met. Overall participants in each group spent similar amounts of time fixating on the photos, ASD group M=3.8secs, SD=.73secs per photo; typically developing group M=4.1secs, SD=.56secs per photo; an independent samples t-test demonstrated that this represented a trend for the typically developing group to fixate longer on the photos, t(46)=1.99, p=.053,
d=0.6. Time when fixations were not recorded comprised blinks; saccades and time spent looking away from the screen.
Fixations on Face
Proportions of fixations on the regions of interest were compared to a random fixation model. A random fixation model assumes that each point in the photo would be fixated with equal probability; hence the probability of fixating in a particular region is directly
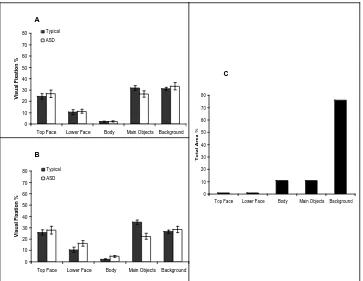
proportional to the area of the region. As is clearly demonstrated by comparing Figure 3a and 3c, the content of the scenes affected participants’ viewing patterns. A series of single sample
t-tests showed that participants in both groups looked at both the top and lower regions of the face for a significantly greater proportion of their time than would be predicted had fixations been randomly distributed over the image: Top Face typically developing group, t(23)=10.39,
The proportions of viewing time spent looking at the top and lower facial regions were compared between groups. A 2x2 mixed measures ANOVA (facial region x diagnosis) showed that the two groups spent a strikingly similar proportion of viewing time looking at the face overall [F(1,46)=0.39, p=.54, ηp2=0.01], mean per 5 second photo presentation,
typically developing participants=35%; ASD=38%. There was a significant main effect of facial region, F(1,46)=33.48, p<.001,ηp2=0.42 as the top face region was fixated for longer
than the lower face region. There was no region x diagnosis interaction, [F(1,46)=0.09,
p=.77, ηp2=0.002]. These results indicate the similarities between groups in the proportions of
time spent looking at the facial regions overall.
(Insert Figure 3 about here)
Eye-gaze following
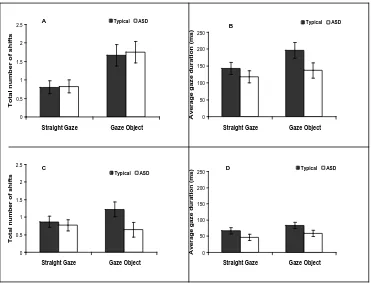
We aimed to discover whether a person looking at an object caused participants to look from the top face region of the person immediately to the object. The total number of direct saccades from the top face to the object was compared when the person was looking at that object to when that person was looking straight out of the photo. A 2x2 ANCOVA (gaze x diagnosis) was conducted on the number of direct Top Face to Object 1 shifts. The
difference between the total number of Top Face fixations in the “gaze object” and the “straight gaze” condition was covaried out to ensure a comparable baseline in each condition i.e. that the difference in the number of Top Face to Object 1 direct shifts was not affected by any difference in the number of Top Face fixations in each condition. There was a significant main effect of gaze, F(1,46)=22.2, p<.001, ηp2=0.33. There was no main effect of diagnosis,
[F(1,45)=0.04, p=.85, ηp2=0.001] or gaze x diagnosis interaction, [F(1,45)=0.003, p=.86,
and medium in the typically developing group, d=0.5 indicating that both groups displayed a similar magnitude of eye-gaze following, see Figure 4a.
The average time spent fixating on Object 1 in the gaze object and straight gaze photos was compared in order to discover whether observing a person looking at an object increases participants’ interest in that object, causing participants to look at that object for longer overall. A 2x2 mixed measure ANOVA (gaze x diagnosis) on total gaze duration on objects in location 1 revealed a significant main effect of gaze, F(1,46)=6.96, p=.01,
ηp2=0.13, there was no main effect of diagnosis, [F(1,46)=2.71, p=.11, ηp2=0.06] and no gaze
x diagnosis interaction, [F(1,46)=1.63, p=.21, ηp2=0.03]. The size of the effect of gaze was
small in the typically developing group, d=0.3 and small in the ASD group, d=0.15. These results demonstrate that participant interest in Object 1 increased when the person in the photo’s eye-gaze was directed towards it, Figure 4b.
(Insert Figure 4 about here)
Time Course Analysis
The average time to first fixate the face was analysed between groups. As the data was skewed analysis was done on natural log transformed data. An independent samples t -test showed that the typically developing participants were quicker to first fixate the face (M=369ms, SD=176ms) than the ASD participants (M=503ms, SD=296ms), t(46)=1.98,
The results of the average time to first fixate the face were in contrast to the average time to first fixate one of the main objects. An independent samples t-test showed that the ASD participants were significantly faster to first fixate one of the objects in the scene
(M=961ms, SD=337ms) than the typically developing participants (M=1214ms, SD=291ms),
t(46)=3.08, p=.003, d=0.9 so it is unlikely that the difference in the time to first fixate the face can be attributed to a general slowness in the ASD group to process the content of the scene.
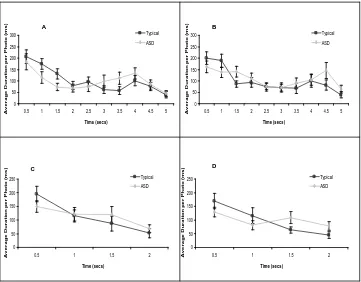
An exploratory time-course analysis was conducted to investigate whether
participants in each group were spending different proportions of time looking at the face at different stages in viewing. Figures 5a and 5b show the average amount of time spent looking at the top face region by the typically developing participants and the ASD participants starting in each 0.5second time-slot throughout the total 5seconds of viewing. A 10x2x2 mixed measures ANOVA (time x diagnosis x gaze) revealed a significant main effect of time,
F(9,414)=15.8, p<.001, ηp2=0.26, as participants tended to look at the face more of the time
early in viewing than late in viewing. There was a significant interaction between time and diagnosis, F(9,414)=2.04, p=.033, ηp2=0.04 indicating that the time course of viewing the
face was different for each group. A separate 10x2 repeated measures ANOVA (time x gaze) for each group revealed that the best fit model to the time data was linear for the typically developing group, F(1,23)=39.7, p<.001, ηp2=0.63 and cubic for the ASD group,
F(1,23)=33.2, p<.001, ηp2=0.59. Our interpretation of this result is that the typically
developing participants’ top face viewing pattern can be characterised by a significant
An exploratory analysis on the time-course of following gaze direction was
conducted. The average time of the first Top Face to Object 1 direct shift in the gaze object photos was compared between groups (a “direct shift” being a fixation on the Top Face region immediately followed by a fixation on Object 1, without any intermediate fixations). An independent samples t-test found no significant difference between groups, t(34)=-0.42,
p=.68, d=0.14, (typically developing group M=1163ms, SD=969ms; ASD group M=1050ms, SD=629ms). A measure of the speed of gaze cueing (including direct and indirect shifts) was also compared between groups. An independent samples t-test comparing the time between the first fixation on the Top Face region and the first fixation on Object 1 in the gaze object photos found no significant difference between groups, t(46)=-0.88, p=.38, d=0.26, (typically developing group M=1121ms, SD=592ms; ASD group M=971ms, SD=592ms). Both of these results indicate that the timing of gaze direction cueing in each group was very similar.
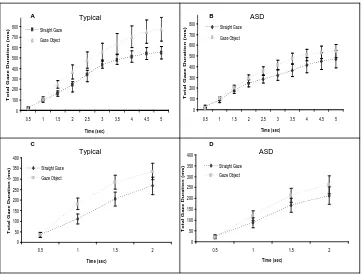
However, gaze cueing does not necessarily indicate that participants are processing the significance of the gaze direction cue. An alternative measure is to compare at what point in viewing the object looked at by the person in the photo increases in salience to the
participant (as measured by increased gaze duration) compared to the corresponding straight gaze photos. Figures 6a and 6b show the total time spent looking at objects in location 1 for the typically developing participants and the ASD participants. This was calculated
cumulatively for each 0.5second time slot of the total 5second viewing time. By 1.5seconds there was a significant difference between the total gaze duration on objects in location 1 in the gaze object condition and the straight gaze condition in the typically developing group,
t(23)=3.26, p=.027, d=0.6. It can be seen from Figure 5b that this coincided with reduced looking time at the top face in the gaze object condition. This rapid difference in time spent looking at Object 1 between the gaze object and straight gaze conditions, and reduced
(Figures 6b and 5b). These findings suggest that although the speed of gaze cueing was similar between the typically developing group and the ASD group, the object at the location of gaze did not increase in salience immediately after it was cued for the ASD participants – as it did for typically developing participants. This suggests that the participants with ASD processed the gaze information differently than the typically developing participants.
(Insert Figure 5 about here) (Insert Figure 6 about here)
EXPERIMENT 2
Method
Participants
Twenty four 11-16 year old adolescents (21 males, 3 females) with an autism spectrum disorder (ASD) - autism or Asperger syndrome - and 24 age, gender and IQ matched typically developing adolescents participated in the study. Thirteen of the ASD participants and 17 of the typically developing participants previously completed Experiment 1 within a larger testing battery. Each participant had a break of at least 6 months between testing sessions. There was no difference between the old and the new participants in how they performed on the main experimental measures - gaze duration on regions of interest and gaze following.
All of the participants with ASD had received an official diagnosis from a clinical psychologist based on DSM-IV criteria (American Psychiatric Association, 1994).
Approximately half of the ASD participants attended specialist schools specifically equipped for individuals with ASD. The remaining participants with ASD had a statement of special educational needs and attended mainstream school where they received additional classroom and pastoral support.
Although an accurate calibration was obtained for all participants on the eye tracker, two typically developing participants and two participants with ASD took an unusually long average time to first fixate the image (mean scores were more than 2 standard deviations from the group mean). These participants were looking away from the screen when the photos were presented and were not sufficiently attentive to the task. These participants were excluded from the main analysis. All remaining participants were within 2 standard
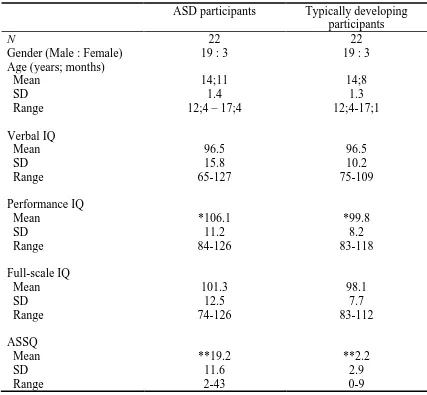
An Autism Spectrum Screening Questionnaire was completed by a teacher or parent of each participant giving an indication of current level of autistic features. An independent-samples t-test demonstrated a significant between group differences on ASSQ scores, t(42)= 6.65, p<.001, d=2.01.
All participants completed the Wechsler Abbreviated Scale of Intelligence (WASI) providing measures of verbal IQ, performance IQ, and full-scale IQ on which participants in the typically developing group and ASD group were matched. Independent samples t-tests found no differences between the groups on verbal IQ or full-scale IQ, however those with autism scored significantly higher on Performance IQ t(42)=2.14, p<.05, d=.64. All participants had normal or corrected-to-normal visual acuity.
(Insert Table 2 about here)
Procedure
The stimuli, design, apparatus and procedure were exactly the same as in Experiment 1 apart from the duration of presentation of the stimuli. The photos were sequentially
presented for 2 seconds each. An example of a representative scanpath of a typical participant can be seen in Figure 2b.
Results and Discussion
Before conducting any parametric tests the assumptions of normality, homogeneity and sphericity were checked. In any case where these assumptions were breached
group M=1.7secs, SD=.15secs per photo; [t(42)=1.20, p=.24, d=0.37].Time when fixations were not recorded comprised blinks; saccades and time spent looking away from the screen.
Fixations on Face
As in Experiment 1, the content of the scenes affected participants’ viewing patterns (see Figures 3b and 3c). A series of one sample t-tests showed that participants in both groups looked at the face for a significantly greater proportion of time than would be predicted by a random fixation model; Top Face typically developing group, t(21)=7.09, p<.001, d=3.1; Lower Face typically developing group, t(21)=5.21, p<.001, d=2.3; Top Face ASD group,
t(21)=7.89, p<.001, d=3.4; Lower Face ASD group, t(21)=6.27, p<.001, d=2.7.
The proportions of viewing time spent looking at the top and lower facial regions were compared between groups. A 2x2 mixed measures ANOVA (facial region x diagnosis) showed that the two groups spent a similar proportion of viewing time looking at the face overall [F(1,42)=2.15, p=.15, ηp2=0.05], mean per 2second photo presentation, typically
developing participants=44%; ASD=37%. There was a significant main effect of facial region, F(1,42)=18.63, p<.001,ηp2=0.31 as the top face region was fixated for longer than
the lower face region. There was no region x diagnosis interaction, [F(1,42)=0.36, p=.55,
ηp2=0.01]. These results indicate the similarities between groups in the proportions of time
spent looking at the facial regions overall and are very similar to the results from Experiment 1.
Eye-gaze following
As in Experiment 1, a 2x2 ANCOVA (gaze x diagnosis) was conducted on the
was no main effect of gaze, [F(1,41)=2.12, p=.15, ηp2=0.05]. There was no main effect of
diagnosis, [F(1,41)=2.76, p=.10, ηp2=0.06] or gaze x diagnosis interaction, [F(1,41)=1.07, p=.17, ηp2=0.05]. The size of the eye-gaze following effect was small in the typically
developing group, d=0.3. No trend for gaze following was observed in the ASD group, d =-0.1, see Figure 4c. Although no significant effect of gaze following or interaction between groups was observed, the trend of the data shows some gaze following in the typically developing group but not in the ASD group.
A 2x2 mixed measure ANOVA (gaze x diagnosis) on total gaze duration on objects in location 1 revealed a significant main effect of gaze, F(1,42)=6.10, p=.02, ηp2=0.13, there
was a trend for a main effect of diagnosis which approached significance, [F(1,42)=3.78,
p=.059, ηp2=0.08] as typically developing participants tended to fixate on objects in location
1 for longer overall than ASD participants. There was no gaze x diagnosis interaction, [F(1,42)=0.11, p=.75, ηp2=0.002]. The size of the effect of gaze was medium in the typically
developing group, d=0.4 and small in the ASD group, d=0.3. These results demonstrate that interest in Object 1 increased when gaze of the person in the photo was directed towards it, Figure 4d. Therefore some evidence of gaze cueing was found in each group.
Time Course Analysis
As in Experiment 1, time to first fixate the regions of interest was analysed. Neither group were faster to first fixate the face (typically developing group M=315ms, SD=45ms; ASD group M=322ms, SD=97ms) t(42)=0.28, p=.09, d=0.10 or to first fixate one of the objects in the scene (typically developing group M=677ms, SD=207ms; ASD group M=631ms, SD=229ms) t(42)=0.68. p=.50, d=0.2.
second time-slot throughout the total 2 seconds of viewing. The results of Experiment 2 were very similar to those of Experiment 1. A 4x2x2 mixed measures ANOVA (time x diagnosis x gaze) revealed a significant main effect of time, F(3,126)=17.7, p<.001, ηp2=0.3, as
participants tended to look at the face to a greater degree early in viewing than late in viewing. There was a significant interaction between time and diagnosis, F(3,126)=3.83,
p=.012, ηp2=0.08 the best fit model of which was linear in nature, F(1,46)=11.44, p=.001,
ηp2=0.20 indicating that the linear main effect of time for the typically developing group,
F(1,21)=57.8, p<.001, ηp2=0.73, caused by significantly more early than late fixations on the
face, was larger than the linear main effect of time for the ASD group F(1,21)=15.2, p=.001,
ηp2=0.42.
difference between the total gaze duration on objects in location 1 in the gaze object condition and the straight gaze condition in the typically developing group, t(23)=3.46,
p=.002, d=0.6. This rapid difference in time spent looking at Object 1 between the gaze object and straight gaze conditions, was not observed in the ASD group (Figure 6d).
General Discussion
The main aim of the experiments reported in this paper was to discover whether high-functioning adolescents with ASD selectively attend to a person, especially their face, when presented with a complex scene and whether the photographed person’s direction of gaze affects the observer’s attention. The experiments showed that when viewing a series of scenes containing one person both typically developing participants and those with ASD spent a large proportion of their time fixating on the face of the person, particularly the top face region containing the eyes, there was no difference between groups in this respect. Significant gaze following was also observed in both groups.
However, time-course analyses revealed differences between the viewing patterns of the ASD participants and the typically developing participants. Attending to the face was more highly prioritised by typically developing individuals than by those with ASD. The typically developing group were faster to first fixate the face when the scenes were presented for 5seconds each and looked at the top face regions more, early in viewing than late in viewing in both experiments. In contrast the ASD group were faster to first fixate one of the main objects when the scenes were presented for 5seconds and fixations on the top face regions were more evenly distributed throughout the viewing time in both experiments. Both groups were cued by the gaze direction of the person in the photo at a similar point in
direction of the person was processed differently between groups. The patterns of gaze following fixations revealed by the time-course analyses observed when scenes were viewed for 5seconds (Experiment 1) were replicated when scenes were viewed for 2seconds
(Experiment 2). The replication of these patterns indicates that these are robust effects. It was interesting to note that the individuals with ASD did not appear to be adversely affected by the more rapid pace of stimulus presentation in Experiment 2 demonstrating that their general attention to social stimuli did not deteriorate with the increase in task pace. However, it is clearly possible that reducing presentation time further may hinder performance and cause participants to miss important social information, this possibility warrants further
investigation.
The two experiments demonstrate the captivating nature of a person’s face in complex photographic scenes. The findings of this study support those of Birmingham et al. (2008) in demonstrating that participants tend to fixate the region of the face containing the eyes of people in scenes for a disproportionately long time compared to the physical size of those regions. The findings of this study suggest that when viewing static scenes high-functioning adolescents with ASD selectively attend to people’s faces as much as typically developing adolescents.
The results of this study demonstrate that the mere presence of a representation of a person in the context of a complex visual scene does not result in markedly reduced fixations on the person in that scene by high-functioning adolescents with ASD. This result is
seems likely as Leekam et al. (1998) demonstrated that mental age is a strong predictor of social ability in individuals with ASD. The difference in nature of the results between the current studies and those obtained by Riby and Hancock (2008) highlights the need to refrain from generalising results beyond the population involved in individual studies. The results of the current study are more similar to those recently obtained by Fletcher-Watson, Leekam, Benson, Frank and Findlay (2009) who ran an eye-tracking study with a similar cohort of participants to those in the current study. They also found that attention to people in scenes was not significantly reduced in high-functioning adolescents and adults with ASD but that the first fixation on a scene containing a person was significantly less likely to be located on that person in individuals with ASD than in typically developing individuals.
The similarities in total fixation duration on the Top Face and Lower Face regions in typically developing individuals and those with ASD found in this study are in contrast to the pattern of results from Klin et al.’s (2002) study in which high-functioning adolescents with ASD spent a far smaller proportion of the total viewing time fixating the eyes than typically developing matched controls. In view of the current findings it is likely that the differences observed in Klin et al.’s (2002) study were not due to the presence of people in the stimuli but were more likely to be due to factors such as movement, scene cuts, dialogue and the presentation of intense social interactions or the combination of these factors. In the future it would be useful to incrementally increase the complexity of visual social stimuli, adding factors such as movement, sound, emotion information and social complexity in stages to analyse the point at which significant differences in fixation patterns in relation to people are observed. In doing so it may be possible to identify the specific nature of the social attention difficulties experienced by individuals with ASD.
participants were given five seconds of viewing time. This study has extended the findings of attentional cueing paradigms (e.g. Charwarska et al. 2003; Driver et al. 1999; Swettenham et al. 2003; Ristic et al. 2005) which demonstrated that gaze direction cues attention in both typically developing individuals and those with ASD. Our study replicates this finding with more ecologically valid stimuli involving highly complex photographic scenes. We suggest that the ability to follow the gaze direction of a person in a static scene is intact in high-functioning adolescents with ASD.
Differences in the timings and patterns of fixations were observed between the two groups, suggesting different relative priorities in attention. These results provide support for suggestions of diminished salience of social stimuli in autism (Dawson et al. 1998; Klin et al. 2003; Swettenham et al. 2003; Chawarska et al. 2003). Typically developing participants tended to fixate on the face extremely rapidly and also fixated on the face to a greater degree early in viewing than late in viewing. This effect was found in both Experiment 1 and
the face in general in individuals with ASD, especially when there are other particularly salient stimuli present? Discovering the reasons for the distinctive viewing patterns observed in the current studies is an avenue for future research.
Rapid gaze cueing was observed in both the typically developing group and the ASD group; however an immediate increase in total gaze duration on the object looked at after cueing was only observed in the typically developing group. In Experiment 1 (5 second photo presentation) total gaze duration on the object looked at increased by 1.5 seconds (as
measured by greater fixation duration on that object) in the typically developing participants. In Experiment 2 (2 second photo presentation) total gaze duration on the object looked at increased by 1 second in the typically developing group. This rapid increase in fixations on the object looked at by the person in the photo was not observed in the ASD group. It is possible that the difference between groups resulted from the implication of following a person’s gaze not being apparent to individuals with ASD as it was to typically developing individuals. However, many other explanations for this difference are plausible. It is possible that the ASD group may have actually processed the information about the object looked at more quickly than the typically developing group and therefore not required markedly increased fixations on the object. In the future it will be important to more thoroughly investigate the information that is being extracted from observing gaze cues, both static and dynamic.
References
American Psychiatric Association. (1994). Diagnostic and statistical manual of mental
disorders (4th edition). Washington, DC: American Psychiatric Association.
Baldwin, D. (1995). Understanding the link between joint attention and language acquisition. In C. Moore & P. Dunham (Eds.), Joint attention: Its origins and role in development. Hillsdale, NJ: Erlbaum.
Baron-Cohen, S. (1995). Mindblindness: an essay on autism and theory of mind.
Cambridge (MA): MIT Press.
Baron-Cohen, S., Wheelwright, S., Hill, J., Raste, Y., & Plumb, I. (2001). The “Reading the Mind in the Eyes” Test Revised Version: A Study with Normal Adults, and Adults with Asperger Syndrome or High-functioning Autism. The Journal of Child Psychology and
Psychiatry and Allied Disciplines,42, 241-251.
Bayliss, A. R. & S. P. Tipper (2005). Gaze and arrow cueing of attention reveals individual differences along the autism spectrum as a function of target context. British Journal of
Psychology, 96, 95-114.
Boucher, R.P., & Lewis V. (1992). Unfamilar face recognition in relatively able autistic children. Journal of Child Psychology and Psychiatry, 33, 843-859.
Birmingham, E., Bischof, W. F., & Kingstone, A. (2008). Social attention and real-world scenes: The roles of action, competition and social content. The Quarterly Journal of
Experimental Psychology,61(7), 986-998.
Bruner, J. (1983). Child’s talk: Learning to use language. Oxford: Oxford University Press. Chawarska, K., Klin, A., & Volkmar, F. (2003). Automatic attention cueing through eye
Chawarska, K., & Shic., F. (in press). Looking but not seeing: Atypical visual scanning and recognition of faces in 2 and 4-year-old children with Autism Spectrum Disorder. Journal of Autism and Developmental Disorders
Dalton, K.M., Nacewicz, B.M., Johnstone, T., Schafer, H.S., Gernsbacher, M.A., Goldsmith, H.H., et al. (2005). Gaze fixation and the neural circuitry of face processing in autism. Nature Neuroscience, 8, 519-526.
Dawson, G., Meltzoff, A. N., Osterling, J., & Rinaldi, J. (1998). Neuropsychological correlates of early symptoms of autism. Child Development, 69, 1276-1285.
Dawson, G., Toth, K., Abbott, R., Osterling, J., Munson, J., Estes, A., & Liaw, J. (2004). Early social attention impairments in autism: Social orienting, joint attention, and attention to distress. Developmental Psychology, 40, 271–283.
Driver, J., Davis, G., Ricciardelli, P., Kidd, P., Maxwell, E., & Baron-Cohen, S. (1999). Gaze perception triggers reflexive visuospatial orienting. Visual Cognition, 6, 509-540.
Ehlers, S., Gillberg, C., & Wing, L. (1999). A Screening Questionnaire for Asperger Syndrome and Other High-Functioning Autism Spectrum Disorders in School Age Children. Journal of Autism and Developmental Disorders, 29(2), 129-141.
Fletcher-Watson, S., Leekam, S.R., Benson, V., Frank, M.C., & Findlay, J.M. (2009). Eye-movements reveal attention to social information in autism spectrum disorder.
Neuropsychologia, 47, 248-257.
Friesen, C.K., & Kingstone, A. (1998). The eyes have it! Reflexive orienting is triggered by nonpredictive gaze. Psychonomic Bulletin and Review, 5 (3), 490-495.
Goren, C.C., Sarty, M., & Wu, P.Y.K. (1975). Visual following and pattern discrimination of face-like stimuli by newborn infants. Pediatrics, 56, 544-549.
Johnson, M., Dziurawiec, S., Ellis, H.D., & Morton, J. (1991). Newborns’ preferential tracking of face-like stimuli and its subsequent decline. Cognition, 40, 1-19.
Jones, W., & Klin, A. (2008). Altered salience in autism. In E. McGregor, M. Nuez, K. Cebula & J. C. Gomez (Eds.). Autism: An integrated view from neurocognitive, clinical
and intervention research (pp. 62-82) Oxford: Blackwell
Joseph, R. M., & Tanaka, J. (2003). Holistic and part-based face recognition in children with autism. Journal of Child Psychology and Psychiatry, 44(4), 529-542.
Klin, A., Jones, W., Schultz, R., & Volkmar, F. (2003). The enactive mind, or from actions to cognition: lessons from autism. Philosophical Transactions of the Royal Society of
London Series B-Biological Sciences, 358(1430), 345-360.
Klin, A., Jones, W., Schultz, R., Volkmar, F., & Cohen, D. (2002). Visual fixation patterns during viewing of naturalistic social situations as predictors of social competence in individuals with autism. Archives of General Psychiatry, 59 (9), 809 – 816.
Langton, S.R.H., & Bruce, V.(1999)
Visual Cognition 6 (5), 541-567.
Leekam, S. R., Hunnisett, E., & Moore, C. (1998). Targets and cues: Gaze-following in children with autism. Journal of Child Psychology & Psychiatry & Allied Disciplines, 39,
951–962.
Leekam, S. R., Lopez, B., & Moore, C. (2000). Attention and joint attention in preschool children with autism. Developmental Psychology 36(2), 261-273.
Pelphrey, K. A., Sasson, N. J., Reznick, J. S., Paul, G., Goldman, B. D., & Piven, J. (2002). Visual Scanning of Faces in Autism. Journal of Autism and Developmental Disorders, 32(4), 249-261.
Ristic, J., Mottron, L., Friesen, C.K., Iarocci, G., Burack, J. A., & Kingstone, A. (2005). Eyes are special but not for everyone: The case of autism. Cognitive
Brain Research 24, 715– 718.
Senju, A., Csibra, G., & Johnson, M. H. (2008). Understanding the referential nature of looking: Infants' preference for object-directed gaze. Cognition, 108, 303-319. Skuse, D. (2006). Genetic influences on the neural basis of social cognition,
Philosophical Transactions of the Royal Society B: Biological Sciences361, 2129–
2141.
Skuse, D.H. (2007). Rethinking the nature of genetic vulnerability to autistic spectrum disorders. Trends in Genetics,23(8), 387-395.
Speer, L. L., Cook, A. E., McMahon, W. M., & Clark, E. (2007). Face processing in children with autism: Effects of stimulus contents and type. Autism, 11(3), 265-277. Spezio, M. L., Adolphs, R., Hurley, R. S. E., & Piven, J. (2007). Abnormal use of facial
information in high-functioning autism. Journal of Autism and Developmental
Disorders, 37, 929–939.
Wheelwright, S. & Reece, L., (1998). The frequency and distribution of spontaneous attention shifts between social and non-social stimuli in autistic, typically-developing and non-autistic developmentally delayed infants. Journal of Child Psychology and
Psychiatry39, 747–753.
Swettenham, J., Condie, S., Campbell, R., Milne, E., & Coleman, M. (2003). Does the perception of moving eyes trigger reflexive visual orienting in autism? Philosophical
Transactions of the Royal Society of London Series B-Biological Sciences, 358(1430),
Author Note
The authors are Megan Freeth, University of Nottingham - School of Psychology, UK; University of Sheffield – Psychology Department; Peter Chapman, University of Nottingham - School of Psychology, UK; Danielle Ropar, University of Nottingham - School of Psychology, UK; Peter Mitchell, University of Nottingham - School of Psychology, UK.
This research would have been impossible without the kind cooperation of the staff, students, and parents involved in the studies. Participating schools included
Aldercar Community Language College, Bigwood School, Bracken Hill, Bramcote Park and Enterprise School, Cruckton Hall, Foxwood, The Long Eaton School, Ysgol Plas Brondyffryn.
TABLE 1
Participant characteristics – Experiment 1
ASD participants Typically developing participants
N 24 24
Gender (Male : Female) 21 : 3 21 : 3
Age (years; months)
Mean 13;10 14;0
SD 1.37 1.37
Range 11;6 – 16;8 11;2-16;4
Verbal IQ
Mean 90.18 94.0
SD 17.00 11.02
Range 63-135 72-109
Performance IQ
Mean 105.3 98.0
SD 14.09 11.02
Range 73-126 77-125
Full-scale IQ
Mean 97.0 95.5
SD 13.6 9.53
Range 74-129 79-112
ASSQ
Mean **18.4 **3.13
SD 12.8 4.04
Range 0-42 0-14
TABLE 2
Participant characteristics – Experiment 2
ASD participants Typically developing participants
N 22 22
Gender (Male : Female) 19 : 3 19 : 3
Age (years; months)
Mean 14;11 14;8
SD 1.4 1.3
Range 12;4 – 17;4 12;4-17;1
Verbal IQ
Mean 96.5 96.5
SD 15.8 10.2
Range 65-127 75-109
Performance IQ
Mean *106.1 *99.8
SD 11.2 8.2
Range 84-126 83-118
Full-scale IQ
Mean 101.3 98.1
SD 12.5 7.7
Range 74-126 83-112
ASSQ
Mean **19.2 **2.2
SD 11.6 2.9
Range 2-43 0-9
* p<.05: Participants with ASD scored significantly higher on PIQ than typically developing participants.
Figure Caption Sheet
Figure 1. Example stimuli: a) Person left, straight gaze. Objects in locations 1, 2 and 3 are
indicated. Red boxes represent Regions of Interest (ROIs) b) Person left, gaze object
Figure 2. Example scan paths of typical participants showing time course graphs: a) 5
second viewing b) 2 second viewing. Red lines indicate saccade to the right; Green lines
indicate saccade to the left
Figure 3. Percentage of fixations in Regions of Interest – error bars represent standard
error: a) 5 second viewing b) 2 second viewing c) percentage of stimuli area covered by
regions of interest
Figure 4. Overall gaze following – error bars represent standard error: a) Top Face to
Object 1 direct shifts – 5 second viewing b) Total gaze duration on Object 1 – 5 second
viewing c) Top Face to Object 1 direct shifts – 2 second viewing d) Total gaze duration on
Object 1 – 2 second viewing
Figure 5. Top Face fixations in each 0.5second time slot – error bars represent standard
error: a) Straight gaze – 5 second viewing b) Gaze Object – 5 second viewing c) Straight
gaze – 2 second viewing d) Gaze Object – 2 second viewing
Figure 6. Cumulative fixation duration on Object 1 – error bars represent standard error a)
Typical participants – 5 second viewing b) ASD participants – 5 second viewing c) Typical
Figure 1. TOP
Location 1
Location 2 Location 3
A
Figure 2. TOP
Figure 3. TOP 0 10 20 30 40 50 60 70 80
Top Face Lower Face Body Main Objects Background
V is ua l Fix a tion % Typical ASD 0 10 20 30 40 50 60 70 80
Top Face Lower Face Body Main Objects Background
V is ua l Fix a tion % Typical ASD 0 10 20 30 40 50 60 70 80
Top Face Lower Face Body Main Objects Background
Figure 4. TOP 0 0.5 1 1.5 2 2.5
Straight Gaze Gaze Object
Tot a l num be r of s hi ft s Typical ASD 0 0.5 1 1.5 2 2.5
Straight Gaze Gaze Object
Tot a l num be r of s hif
ts Typical ASD
0 50 100 150 200 250
Straight Gaze Gaze Object
A ver ag e g az e d u r at io n ( m s) Typical ASD 0 50 100 150 200 250
Straight Gaze Gaze Object
A ver ag e g az e d u r at io n ( m
s) Typical ASD
A
B
Figure 5. TOP 0 50 100 150 200 250 300
0.5 1 1.5 2 2.5 3 3.5 4 4.5 5 Tims (secs) A v e r a g e D u r a t io n p e r P h o t o ( m s ) Typical ASD 0 50 100 150 200 250 300
0.5 1 1.5 2 2.5 3 3.5 4 4.5 5 Time (secs) A v e r a g e D u r a t io n p e r P h o t o ( m s ) Typical ASD 0 50 100 150 200 250
0.5 1 1.5 2
Time (secs) A v e r a g e D u r a t io n p e r P h o t o ( m s ) Typical ASD 0 50 100 150 200 250
0.5 1 1.5 2
Figure 6 TOP 0 100 200 300 400 500 600 700 800
0.5 1 1.5 2 2.5 3 3.5 4 4.5 5 Time (sec) T o t al G az e D u r at io n ( m
s) Straight Gaze
Gaze Object 0 100 200 300 400 500 600 700 800
0.5 1 1.5 2 2.5 3 3.5 4 4.5 5 Time (sec) T o t al G az e D u r at io n ( m
s) Straight Gaze
Gaze Object 0 50 100 150 200 250 300 350 400
0.5 1 1.5 2
Time (sec) T o t al G az e D u r at io n ( m
s) Straight Gaze
Gaze Object 0 50 100 150 200 250 300 350 400
0.5 1 1.5 2
Time (sec) T o t al G az e D u r at io n ( m
s) Straight Gaze