.
i•
;
•
. . .
Demand for and applications of extra large EDP systems In the
EEC Countries and the United Kingdom In the
seventies-Vol. 1.~ Deveiopment trends
of
the
computer ·lnltaHatlons.ln the•
'
..
•
The survey was conducted for the "Commission des CommiJnauMs Europtennea (Direction Generaie des Affaires
lndustrlelles)".
The survey was conducted by a research group from SORIS, consisting of: Andrea Barablno, Serena Girardi, Donata leones!, Guido Musso, lacopo Muzio, Plero Taverna.
Collaborated have:
Enrico Albanl, Glusllno Gasbarrl, Alfredo Mantlca, MassJmo Merlino, from
Praxis Calcolo
Antonio di leva, Graziella Pent, Marla Teresa Relnlerl, from the University of Torino
Rinaldo Sanna from the University of Genova
The Interviews with users and experts have been conducted by:
SORIS In Italy and the United Kingdom SOBEMAP of Brussels In Belgium SEMA of Paris In France Deutsche Revlslons·und
Treuhand A. G. Treuarbelt
of Frankfurt In Germany Rljkskantoormachlne·
centrale of'S Gravenhage In Holland
June 1970 In. 6835
SORIS s. p. a.
'
•
Demand for and applications of extra large EDP systems In the
EEC Countries and ·the United Kingdom in the seventies
•
C 0 N T E N T S
Chapter IV.
· Development trends o£ the computer installations
in the EEC Countries and the United Kingdom between
1962 and 1969
page
1.
,The EEC countries •••••••••••••••••••••••••••••
11 • 1 • Sources • • • • • • • • • • • • • • • • • • • • • • • • • • • • • • • • • •
1·
1.2.
Development o£ computer installations ••••
41.3. Computers installed
by size-cla~ses••••••
14
1.4. The Computer Market ••••••••••••••••••••••
20
1.5. Computers installed
byindustry ••••••••••
222.
The Benelux •••••••••••••••••••••••••••••••••••
252.1.
Sources ••••••••••••••••••••••••••••••••••
252.2.
Development o£ computer installations ...
262.3. Computers installed
bysize classes ••••••
32
2.4.
The computer Market ••••• ·•••••••••••••••••
38 2.5.Computers installed
byindustry ••••••••••
423.
France ••••••••••••••••••••••••••••••••••••••••
44
3. 1.
Sources • • • • • • • • • • • • • • • • • • • • • • • • • • • • • • • • • •
443.2. Development o£ computer installations ••••
46
3.3. Computers installed
bysize classes ••••••
52
3.4. The computer market ••••••••••••••••••••••
5'
3•5·
Computers installed
byindustry ••••••• , • •
51
4•
Germany •••••••••••••••••••••••••••••••••••••••
6i
4. 1.
Sources • • • • • • • • • • • •.• • • • • • • • • • • • • • • • • • • • • •
6j4.2.
Development o£ computer installations ••••
64
4. 3.
Computers installed
bysize classes • • • • • •
·
70 4.4.Computer Market ••••••••••••••••••••••••••
7j4. 5. Computers installed by industry • • • • • • • • • •
76
5.
Italy ••••••••••••••••.•••••••••••••••••••••••••
82
5.1. Sources • • • • • • • • • • • • • • • • • • • • • • • • • • • • • • • • • •
82
5.2. Development o£ computer installations...
855.3.
Computer installed
bysize classes ••
~....92
5.4.
The computer Market ••••••••••••••••••••••
95·
£ollowst contents
6.
United Kingdom ••••••••••••••••••••••••••••••••••••
6.1.
Sources ••••••••••••••••••-••••••••••···••••
·6.2.
Development o£ computer installations ••••••••
6.3. Computers installed by size classes ••••••••••
6.4.
The Computer Market ••••••••••••••••••••••••••
6. 5.
Computers installed by .industry· ••••••••••••••
Chapter
v.
page
102
102
104
112
115
118
Forecast o£.computer installations in the EEC countries
and the United Kingdom (1970-1980)
1.
Foreword
•
•
•
•
•
•
•
•
•
••
••
••
• ••
• ••
• •
••
• ••
••
• • •
••
•
•
•
•
•
•
•2.
Factors explaining the demand trend ••••••••••••••••
3. Methodology employed in the forecast o£ the computer
installations development •••••••••••••••••••••••••
4.
Analysis o£ the results o£ the projection •••••••••
5. Evaluation o£ the annual hardware expenditure •••••
6.
Evaluation o£ variations in the computer
installa-tions number in the EEC and the UK ••••••••••••••••
7•
Forecast o£ the global demand •••••••••••••••••••••
8.
Trend toward employment o£ more advanced computer
124
125
129
132
134
140
143
types • • • • • • • • • • • • • • • • • • • • • • • • • • • • • • • • • • • • • • • • • • • • •
145
g. Evaluation o£ the European
marke~£or extra-large
computers •••••••••••••••••••••••••••••••••••••••••
146..
The two chapters o£ this volume deal with the past and
the future trend o£ computer installation's in the EEC
countries and the U.K ••
Chapter £our includes, £or each country, a synthesis
o£ all information available on the trends o£ computer
installations in the period 1962 - 1969, ·total and by
~ndustry.
Chapter five contains forecasts ·o£ computer total
installations development, by number anq value, with
particular reference to extra-large computers in the
CHAPTER IV.
Development trends o£ the computer installations in
the EEC Countries and the United Kingdom between
1. The EEC countries
1,.1. sources
During the last five years the topics of the computer
diffusion in. European· countries and of the establishment of a European computer industry have been widely discussed by international and national (1 ), public and private organi -zations and by economic-technical literature (2) in debates
.
about the technological gap between Europe and the us. The sources of information available to this respect are plentiful, and often the data reported therein are not only difficult to compare, but vary also greatly from each other, opening thus the possibility to arrive at contradictory
conclusions especially when the extent and the trend of
the gap between Europe and the US are concerned. Consequently, according to some of these sources (3), the EEC countries and the
UK are behind the US by about 5 years in its computer instal lations, and this delay tends to remain una1 tered, other · sources (4) affirm that this delay is even greater and tends to increase, while still others (5) think that the delay will decrease.
The causes for these differences of . opinion lie in the
(1)· OCDE- Les ecarts technologiques entre les pays membres: calculateurs electroniques, March 1968
(2) Pierre Lhermitte - Le pari informatique, Paris 1968 (3) OCDE - idem
(4) W.K. De Bruijn - Computers in Europe in 1966
-Recent-developments in the European market. Datamation, .January 1968
2.
diversity o£ the criteria which have been chopen by the ·
various sources £or their surveys. The.largest discrepancy,
however,is due to different
interpretati~n~o£ the expression
"installed computers" .(1).
In this research the statistics o£ the Diebold Group were
·primarily used, first o£ all, because they assure rather
homogeneous surveys £or all the
countri~s,secondly, because
they o££er periodeally a census·o£ installed computers broken
down according to the models, and finally because it is the
most widely used statistics.
Unfortunately, these data are not very ·accurate when examined
. .
closely, especially concerning the listing o£ manufacturers
and models.and the distinction between
~nstallationsand
orders.
(1) Concerning the definition "computer", some sources
· a) survey only the. digital computers above a certain size
(e.g.
Intern~tionalData Corp. in the publication EDP
·Industry Report)
b) others include all digital computers,also micro
-.computers (e.g. Diebold Group)
c) others survey all digital computers (in the sense o£ a)
and b)) as well as analogic computers (e.g. official
bulletin o£ the French Republic) •
. According to the sources "installed" means:
a) the computers installed and actually in operation with
specific categories o£ users .(excepting, e.g. ,. the
. constructing firms according to !STAT, or the military
lorces according to the Diebold Group);
b) all computers installed and actually in use (e.g. only
"Computer survey"speci£ies that it does.not take into
consideration those computers no longer in use);
c)
the computers installed and in operation (as in a) and
b))
and ·those delivered but not yet in operation;
4) the computers installed (operating or not) and those
3.
The information supplied py the above mentioned source has, however, been integrated or substituted by a more reliable one, wherever it was possible: thus, for example, statistics from Computer Survey have been preferred, for the UK.
The data used during the survey are, in our opiriion,the only ones available, because of the lack of official statistics about computers in· the various countries.
4 •.
1.
2. Development of- computer installationsWhile the first computers for scientific purposes were installed in· the UK in 1951 and on the continent in 1954, their industrial and commercial utilization began only by the end of the Fifties as a result of the introduction of the IBM 1401 whose deliveries on the. European market took place in 1959-1960.
r·---~ . .--~-· .. ·:.----=~~
1 In the period between: 1962 and 1969 to which the data eell~ed-"'
J
by ws refer almost uniformJ.y, in the European market:~ the third computer generation has appeared and spread changing deeply the factors of the market development; - the conditions of the offer have changed with the increase
in the number of constructors operating on the market and the Tange of computers offered •.
Between 1962 and 1969 the computer.s installed in the EEC countries have increased from an initial 11647 to 13,871 , ·at
.an average annual compo~e9 rate of 39%, while their value (expressed in annual rental ) has increased from 137 million US Dollars to 998 million US Dollars (+35.8%). During the same period the compute-rs installed in the UK
hav~ increased from 489 to 3,575 in number and from 3618 to ·
·
3~0,4 million US Dollars in value, at annual.rates of, increase of 33·. 7% and 37.2% respectively...
The comparison. between· the countries under examination end the
u.s.
.
. CCM'UTERS I"NSTALLED IN Nlf.IBER AND VALUE
·-·
1 9 6 2 . 1 9 6 9 (30/6) ;AVERAGE ANNUAL RATE
.
VAll£ . VAll£ -·
NlJ.IBER
(Million S) NI.M3ER (Mtlllon Sl NlJ.IBER VALUE
.
EEC +UK 2,136 174 17,.446 1,.318 + 37.7· + 36.~
us·. 11,076 1,144 59,m 5,660
.
+ 30.2 + 29.~Since during the last years of the period 1962-1969 the
presence of desk computers in Europe has increased noticeably,
it is more meaningful for the purposes of an evaluation of
the considerable development of the European installations to
take a look at the trend of the installations (desk type
escluded). The followino results can·~ be obtained:
.
EEC
UK
us
. CCWUTERS I Nll I ALLED, EXCLLO I NG DESK COMPUTERS
· .. c
. 1 g 6 2 1 9 6 9 (30/Gl
VALUE VALUE
. NUMBER
(Million Sl NUMBER (Mtlllon Sl ·
1,569 136 10,938 944
450 36
.
2,884 3109,680 11121 45,792 5,485
.
.AVERAGE ANNUAL R~TE
NUMBER VALUE
+ 34.2 + 34.7
+ :51.2 +' 37.1
+'27.5 + 29;1
While the number of computers installed in the EEC countries
and the UK by the middle of 1969 was apparently higher than
the US equipment in 1962, .its value was only slightly higher,
due to the fact that in the US the equipment is characterized
by a greater amount of medium and large computers, whereas
6.
Thanks to the considerable development o£ the European
installations £rom 1962 to 1969, the delayin 90~par~son with the
us
tends to decrease, when we compare the percentage o£ the installations in the EEC:countries, in number and in value, with the American one.,·
Ratio between European- installations and 100
u.s.
installations.
Year 1962 1963 "1964' 1965 1966 1967 1968 1969
EEC
Number Value
14.8 12.4
14.5 13.1
17.2 14.·6
18.4 15.5
16.7 14.1
17.9 14.5
22.4 17.2
23.2 •17.6
EEC and UK Number
19.2
20.2
23.3 23.8 21.8
23.0
28.8 29.1
Value 15.2. 17.9
20.1
20.9
19.8
19.0
23.2 23.3
The degree o£ the di££usion o£ hardware in the EEC countries and the UK can be validly compared with the US only through certain indexes, which take into account the economic di££e~
rences o£ the countries under examination.
The £ol1011ing indexes.
ha~e
be.en used:·t
- number o£ computers 'per.!Jlillion.extra-agricultural employees (Table IV.7);
- investment in computer (in terms o£ annual rental)
percentage b~ computer expenditure in relation to GNP (Table IV.9);
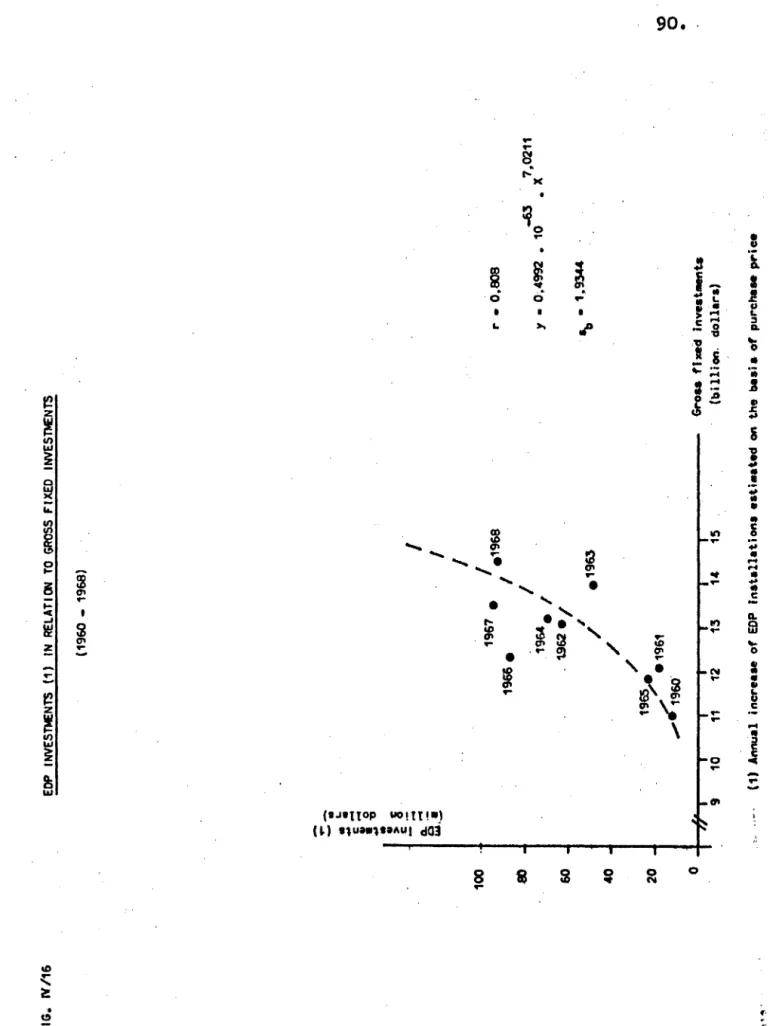
- share of the annual investment in computers (net increase of the equipment valued at purchase price) in relation to gross fixed investment (Figure IV.1).
The results of.the comparison are summarized as follows:
DIFFUSIOrnF CCW'UTERS IN Tl£ fEC COUNTRIES, Tl£ UK AND TI-E US
EEC UK us
1962 1968 . 1962 1968 1962 1968
N; PER MILLION EXTRA
AGRICULTURAL EMPLOYEE 28~ 200 20 138 179 .. 757
HA~WARE INVESMNT PER EMPLOYEE ( $) 2.334 14,261 1,475 12.301 18,5:1!0 70.'810
HA~WARE EXPENDITURE PER 1,000 s.·GNI ,0,48. 2.30 0,37
.
.3.02 1.73 5,83 HAOOWA-RE ~ESTJ.E)IT PER 1,000.
...
GROSS Fl.xEO INifESTMENT 0,264 0,952 0.735 0,492 (),907 3, 773
..
·'Concerning the comparison between the Common Market and the US .one has to note that:
- the delay expressed by the ratio computer/extra-agricultural employee remains almost constant, i.e. 5 years, for the
period considered;
F''~•~
IV/•{1
f
900 800 700 600 500 •oo -~ 200 100
--,.
"'•
•
...
c... • 0 • "0
...
.
. • c: > 0 c·-
--..
:: ....
;-"0
...
! 19M
-,_.
_____
_
HARDVARC IWES'TKNTS (1) IN RELATI~ TO GROSS FIXED IWESTIENTS (1963 -1968)1964
_,.
-_,
.
.,
.
,..
.,
,.,
.,.,
,.. e19as 1967..,.,""
/ / e1966 / / /,.
0I#,
I I I I I I I I I I I I I I I 70 71 72 73 7. 75 76 77 78 79 80 81 82 83 84 frJI
EURa'EANE~~
~<JIU41TY
I
/1968..., /
/ r • 0,914 '1 • 0.1721 • 10-67 • X 7 .OOfrJ lb .• 1.552• Gross fl xed lnveat.ent. (billion.: dollara) ( 1) AnnuaL iller....-Gl EDP lnat.allat I o.na er.tJ •a led on the b.aala of pw-cbaa. pri:ca
Fl&,.
. :
WiM
....
.
s,ooo .. ,ooo 3,000 1,000
0 MIIJWAR! lt..'VESMNTS (1) IN RELATIQ4 TO GROSS FIXED INVESnENTS :z:: .. _ .
-; r..
•
•
~
-c
-
r
0
,
~
•
c
..
,.0
;
-
t-
I.!
,
..
•
:z: 1961•
_,
e1960 10010.
-smaller, but .slightly. -increasing is the delay (about 4 years) when evaluating the index expenditure hardware per one
thousanq dollar GNP;
- extremely conspicuous (7-8 years) is the delay. e?Cpres'sed .through the ratio hardware investments/gross fixed
investments.
Whatever index o£ comparison is used, the European gap beh~nd
the US remains unchanged during the entire period 1962-196S, being thus in contrast to the indications which can be
deduced £rom the percentage incidence offthe European installations as compared with the US ones.
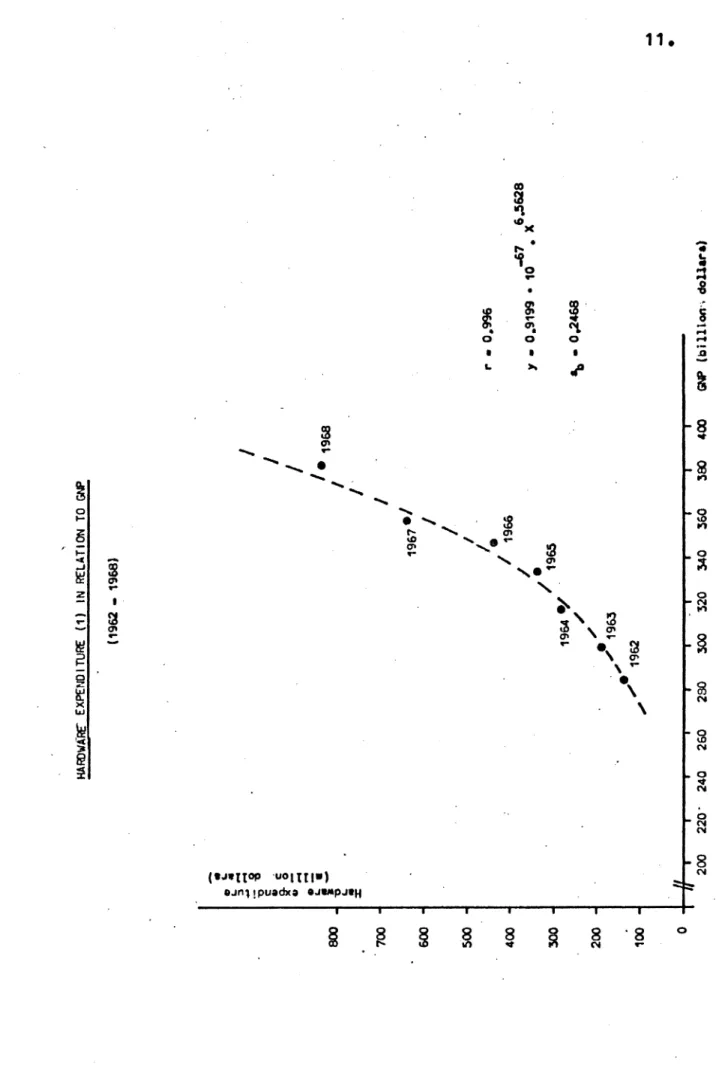
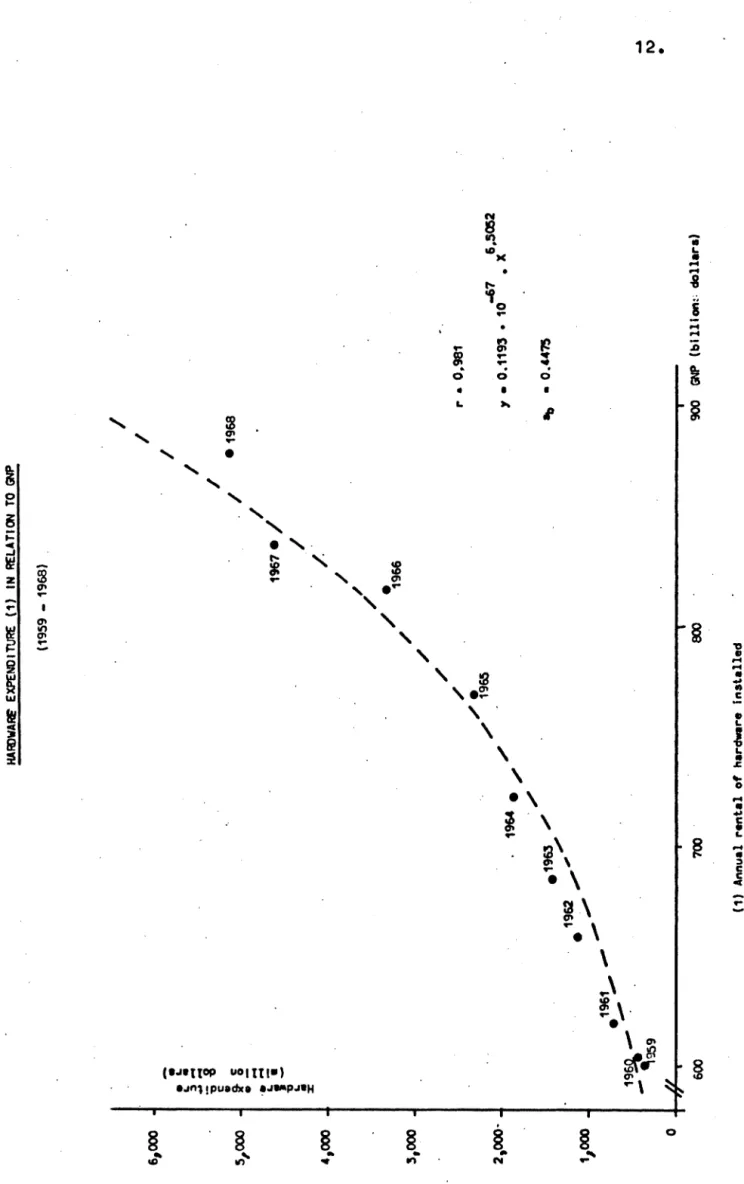
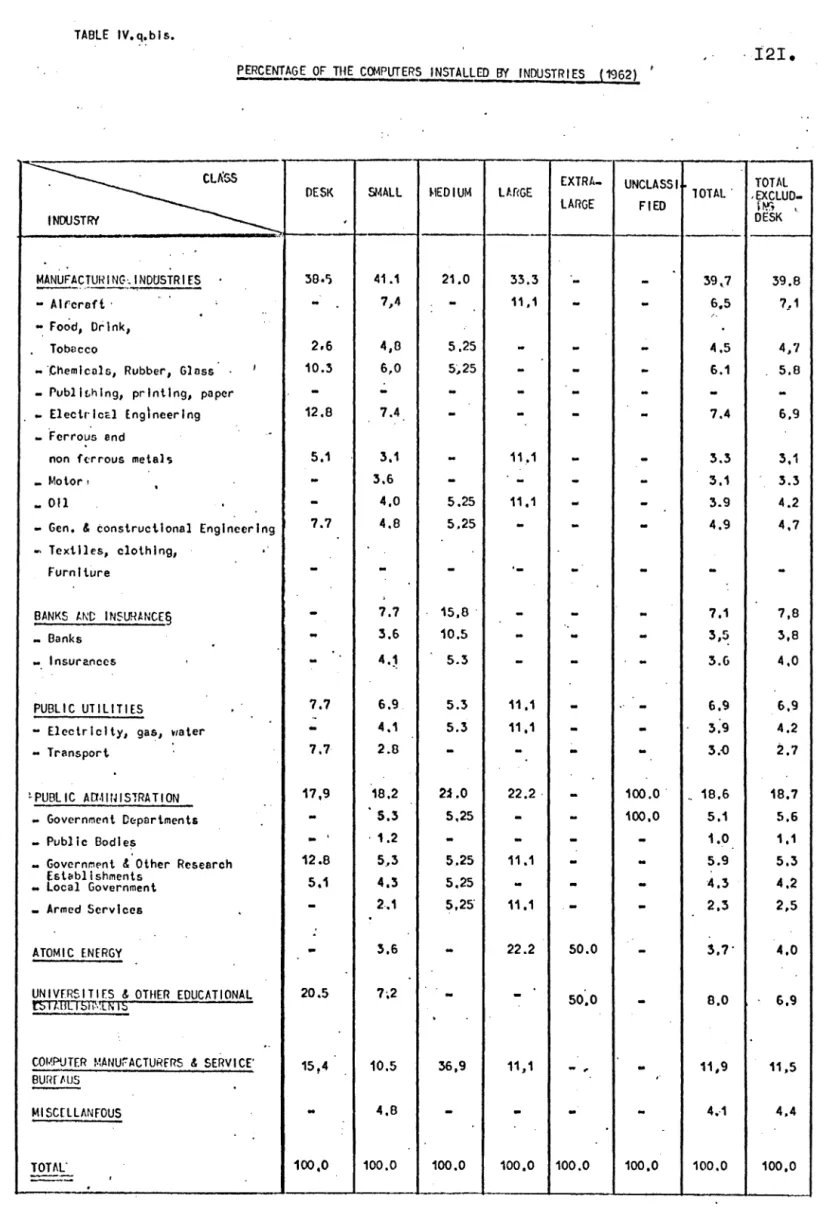
Further confirmation of the evenness of the gap EEC-USA concerning the computers diffusion, can be drawn by
examining the ratio which exists in the two areas between hardware expenditure and GNP (Figure IV.2 and IV.2 bis). The. estimated equations of regression assume the following form: .
y
=
0.91987r =0.996
Y = 0.11935 • 10-67 X 6•50
,(sb= 0.447)
tor the EEC Countries
tor the
u.s.
'wher~ .
y ·
~·
annual hardware expenditurefiG.
IV/2
800 700 600 500 400 300 200 100
0
•
.
~L
..
::1
...
...
~-8 c:.
.
It~
..
-
...
....
L-J.~
,
L..
,:
HARDWARE"
EXPENDITURE
(1)
IN
RELATION
TO
Gtl'
'1962
-1968) I
1967•1
I
l
I
'·
I
1966
/.
1964
•/
1965
/
•"'
•-'"'
1963
~~
1962
I
I I
I
'· 1968I I"
200
220.
240
260
280
300
320
340
360
380
400
(1)
Annual
rental
of
hardware
installed
.
r
EUROPEAN
ECON()UC
COMMUNITY
1
r
•
0.,996
1
•
o.9199
•
10
-67•
x'~62a
~
•
0.2468
IN'
(bi
lllon·•
ctoUara)
FIG.
JY/2
bla
6,000
-
•
•
L.
I.
•
~-
..
-
:;-8 1:•
s,ooo
-1
!l-&
.
-
-
..
-~.- J.! "V I.•
%I
~,ooo 3,000 2,000· 1,000
0
600
HAF!>WA~
EXPENDITURE
(1)
IN
RELATION
TO
GW
(1959
-1968)
700
eoo
(1)
Annual
rental
of
hardw8re
Installed
I
I
.1968
...
0.981
1
•
0.1193
•
10
-6
7
•
x6.5a52
..,
•
0.,~75
900
GNP
(billion:;
dollars)
I
l.WI
TED
STATES
u
14.
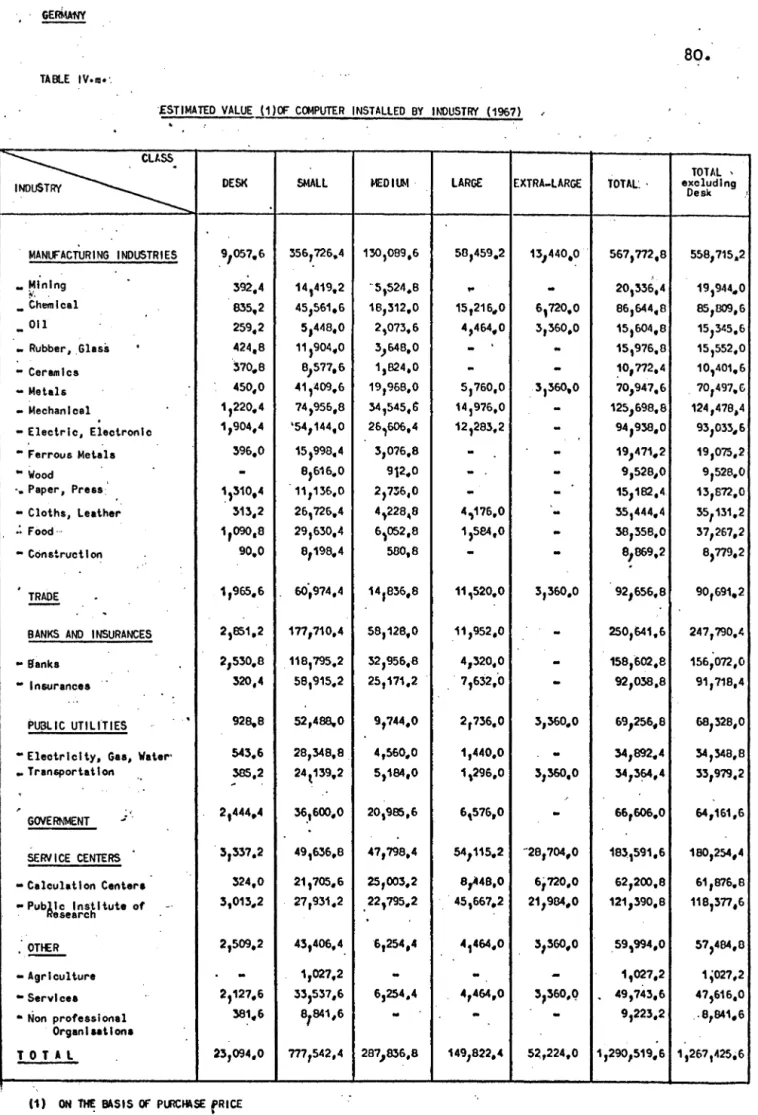
1 •. 3 Computers installed by size-classes
I
DESI< , SMALL~
MEDIUM URGE EXTRA-LARGE
~CLASSIFIED
TOTAL'
DESI< SMALL MEDIUM URGE
.
EXTRA-LARGE TOtAl-(1) From 1964.
The su.tdivision o£ computer installations per size classes in the EEC countries and the UK has changed between 1962
and 1969 in such a way as to grow more alike ~he US
\
subdivision. The variations are illustrated in the table •
PERCENTAGE AND ANNUAL RATE OF GROWTH OF Ca.1PUTERS INSTALLED
- .
1962 1969 (30/6) ,ANNUAL RATE (1962-1969)
EEt ll< us EEC UK us· EEC ll< us.
'·
'
: · Nvmber
4.7 8,0 12.15 21.1 19.3. 23.4 + 79.6 + 51.9 + 44.7
r
84!8 m.5 73;8 69.3 64,3 60.3 + 33,7 + 28.4 + 25.9
s.s
3,9 4,8 7.0 12,0 10,.5 + 44,5 + 51,3 + 50.7.
4,3 1,8 B.O 1,7 2.8 4,t + 19,5 + 49,2 + 14 .• 8-
0.4 0.8 0_.7 1.2 1,7 + 188. 9(1 + 61.8 + 45,70~~ 0,4
-
0.2 0,4-
-
-
-100 .• 0 100,0 100.0 100,0 100.0 100,0
*
39.0 + 33,7 + 30,2..
Value •
'
1,0 2,1. 2,0 5,4 3.1 3,2 + 81,7
+ 43 .• 5 + 40.3
65,9 68,1 44.6 55.9 46,2 39,5 + 11,7 + 29~2 + 27.6
11,9 9,3 8~3~ 19,8 25,9 23.4 + 47,8
+ 53.9 + 55,4
21,2 12.3 38,2 10,2 12.7 18.2. + 20.2 + 41.6 + 11.8
..
8,2 6,9 8,7 12,1 15.'1- +151,2(1 + 50.4 + 45.7100,0 100,0 100.0 100,0 100.0 100.0, + 35,8 + 37.2 + 29,4
;
Between 1962 and 196~ an increased development has been
recorded for the EEC countries and the UK·in the extreme size classes: desk on one side and extra-large on the other. The total of the large and extra-large computers maintains also
in 1969 .a relative importance as compared to ~he total
'
«
,.,
•
L.
•
... ....g
.
5
1,000 ~ ...
:1: 900
BOO
700
600
•
500
400
300
200
100
0
1962
FIG. l't/3
EUROPEAN ECONOMIC Ca.MMITY
ESTIMATED ANNUAL VALUE CF COMPUTERS INSTALLED AT n£ END CF EACH YEARS, BY SIZE CLASSES.
(1962 - 1969)
EXTRA-URGE
LARGE
~EOilJ4
SMALL
-~· DESK
1963 1964 1965 1966 1967 1968 1969 Years
16.
UNITED STATES
F'IG. lfY/3 bla
ESTIMATED ANNUAL VALUE OF COMPUTERS INSTALLED AT THE END Of EACH YEARS, BY SIZE CLASSES
(1959 - 1969)
•
L
"
6,00Q ... ...
0 '0
c:
0
...
...
s,ooo :1: EXTRA-LARGE
,I
LARGE
41000 I
I ~ED IUM
SMALL
1,000.
0 DESK
..
1r400
1,300
1,200.
1,100
1,000
900
BOO
700
tAi(9
:ii\;1
a
300
ilo'
100
o'
FIG. IY/4
17 •.
E~PEAN ECONOMIC Ca.MJNITV AND UNITED KINGDOM
ESTIMATED ANNUAL VALUE or COMPUTERS INSTALLED AT THE END or EACH YEARS, BY SIZE CLASSES
(1962- 1969)
•
"
•
....
....
.a
EXTRA-LARGEg
....
.... LARGE
s
SMALL
18.
This is due not only to. the more advanced state of development
ot
EDP'applications in theus,
but, above all, to the fact that in this country, contrary to the EEC, there are more large private and government offices which employ high capacity comput~rs.The development of the European park seems to have been faster than.that of the US one, in number as ~ell as in value, in all computer classes with the exception of the medium class which has recorded in the US between 1962 and 1969 an average annual rate of increase of 50.7% in number and of 55.4% in value, whereas in the EEC countries the rate registered was only 44.5% in number and 47.8% in value.
The differences in .the rates of development of the various
.
. computer classes in the EEC countries and the USA can be explained mostly by historical reasons.In the US, where automation had begun firs~,the structure of theinstallations was already well balanced at the beginningofthe period under consideration.
In the UK, ~here the diffusion of automation began earlier
th•n
in
the EEC countries, a growth ~ate higher than theiVIPflfJI £or the EEC can be recorded as a consequence, at least
i~ t~f~$ of the installations· value which has, in the period
aoni!~red, increased at an average annual rate of 37.2%
~~glffR-$.~.the 35.8% recorded for the EEC), while in number the
r~t$- n~s increased by .33.7% against the average EEC of 39.0% •
. /t§
J'l.,as been indicated in the preceding table, this difference19.
small, and the.extra-large class wnich possesses relatively
few install~ations.
In t~e UK, however, considerable increases took place in the
medium class· which accounts for 12% of the total and whose.
unitary value is rather important.
Large and ext~a-large computers in the EEC countries and the
UK numbered 331 and 138 respectively, in June 1969, and their
distribution per country can l;>e seen in the following table.
Number of large and extra-large computers installed in the
EEC Countries and the UK by the middle of 1969
Country Large Extra-large
Belgium 13
...
France 80 53
Germany ."82 16
Italy 40 21
Netherlands 16 6
United King~om 100 42
20.
1•
.
4 The Computer MarketOn th~ EEC and UK computer markets, American as well as European companies are present: as a result, the European market is much more competitive and lively than the American one.
The American manufacturers' presence is .maintained not only through the creation of branch offices and efficient sales networks, but also through the establishment of production
p~ants and through the stipulation of license agreements with
'
national manufaturers.
MARKET SHARES PER MANLf'ACTURERS
,.
v
·- -1C'I_iRt
BELG1!J.I HOLLAND FRANCE I GERMANY ITALY UK
--·
'
.
us
BULL/GE 17,2·-· ... 10,4·-. 14,5~- 4;6- 20,4- 1.5- 2,0 (1:
coc 0.4 4,9 ~ ... 1 2,7 1 .. 5 0.9 5,3
Cll 2,0 0,6 4,0 ;(i~l
-
-
-HONEYWEll 1.2~ 2,0- 1.7- 2.4 - 2 .. 2 - s.o ... .4.1
IBM 64.9 54,8 62,6 63,3 66.3 40~3 71.0
ICL 2,6 3..4 1. 7. OS 0 .. 2 4?.0 !!'
PHILIPS 0,8 8,7
-
-
-
-
..!!'SIEMENS 2,9 2.2 1.o· 13.2 0,8
-
..-UoliVAC 3.a8 7,4 4.5 7.-:'f '7,5 3.8 7.0
on£R 4.2 5,6 6,9 5.7 1 .• 1 6,5 10.6
!Qill:. 1oo.o 100_,0 100 .. 0 100,0 100,0 100,0 100,0
..
.
(1) .GENERAL ELECTRI~ only .
.
---···
The importance of the American presence in this sector in almost all European countries is demonstrated
by
the marketshares (in value) for 1969 in the preceding ~able; the pri~cipai American manufacturers have a market share in all EEC countries
21.
which is high~r _than 80%.and reached 98% in Italy. Only in
the UK, tlue to the presence of ICL, the market share of the
American manufacturers reaches a 58% only.
The Ame~ican ~~~ranee is particularly .eviden~ in that
sec.tor of the ~-:·wbi-G~f--.~~ interest·-"to.-~-t.h-~_study,
~~·o:f\t\1~ large and extra-large computers. American
manufacturers.control it entirely in Belgium, Holland, France .
.
and Italy. In Germany and the UK : American manufacturers
dominate the market, but do not control it, because of the presence
of ICL and
s
iernens • .I
The shares reached by the American manufacturers on the large
and . extra-large computer market are more important than those
obtained for the market as a whole. This is due to the lack
of cornpeti tion by· European manufacturers in this field,
whereas in the other classes the national industries of some
European countries have begun to offer strong competition to
22 •
.
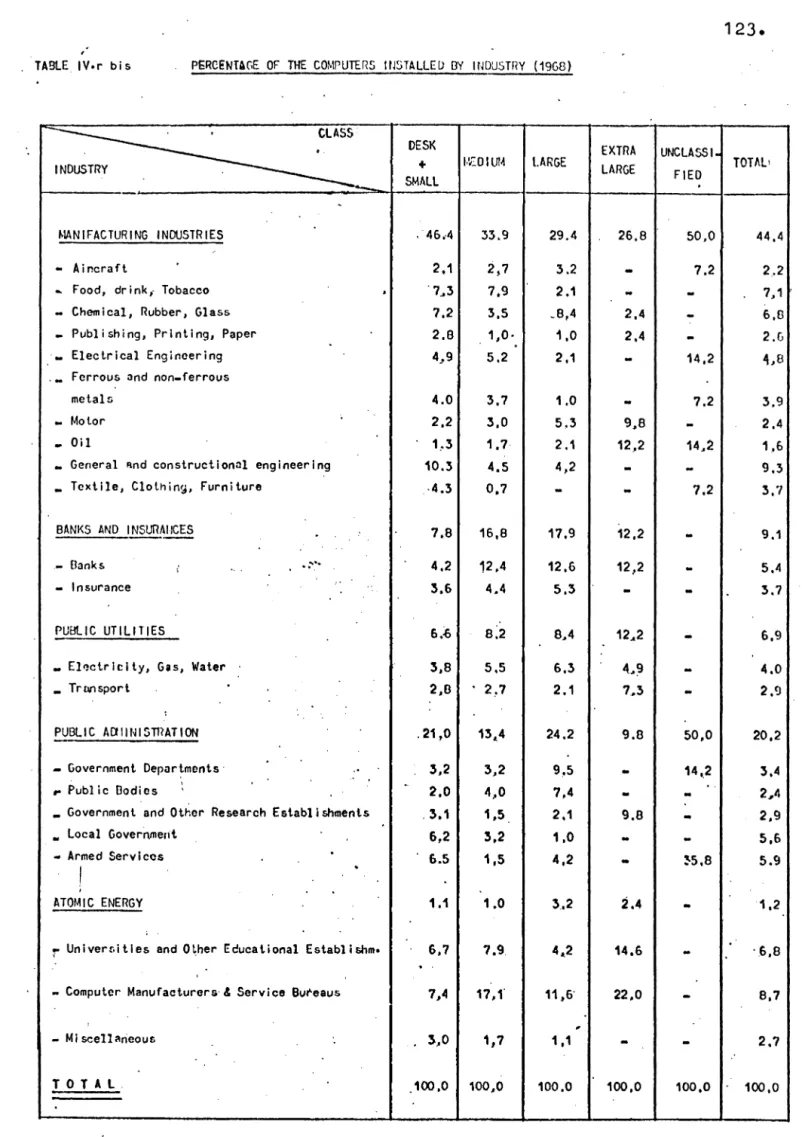
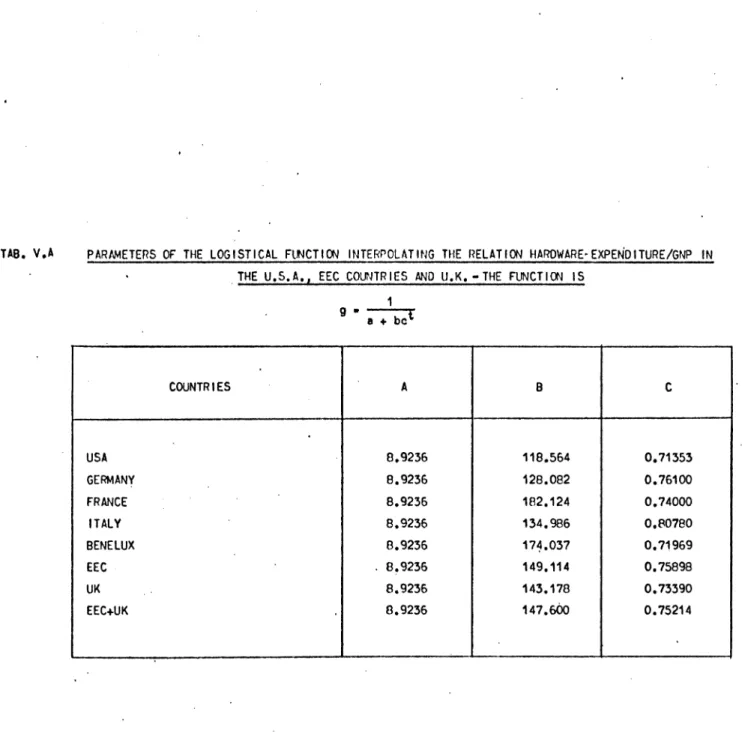
1~5· Computers in$talled by industryThe informations concerning the distribution of computers per
.secto~ of utilization vary greatly from country to country. These differences depend largely on the availability of up-to-date:data, on the different ways of classifying the individual sectors and on their degree ~f reliability.
An attempt was made in 1966 by W.K.· De Bruijn to compare the ·.position of computers in ·the European market, but unfortunately
it referred to only.one type and to a time when·computer
installations were little more than the half of the 1969 ones (table IV.a.). ;
. : . ;·' :.r: .... ·· <' ~. • '
In _the table IV .b. the nu)'~t.Jrecent informations from each
country concerning the number of installed computers per large sectors of the economy have been summarized. Using the
recornmended cautton in interpreting data which are rather
heterogeneous like the ones listed, one can however conclude that the industrial sector is the most important one concerning the number of installed computers with a percentage of around
\
40% of all the installations in the countriesconsidered here. Central·and local goverTh~ents are important users of computers only in England (28% of all installations), while their
.
.importance is by far smaller in other countries.
The third sector in order of importance regarding the employment of computers· is. that _ of banks and insurance companies whose importance in the various countries varies between the UK
Holland.
TAStE IYtia! aM'tJTERS INSTALLED f1f INDUSTRY
,
..
. ----" II ~ '" EEC ITAlY·-· 'FRANCE GERMANY -.. I INQm_ffiri -f N. % N. % N. % N. % '• -t..'NIVF.RS1T1£S# R & o· INSTITUTES .. 475 12.6 53 8.8 196 19.0 162 11.0 ---. GOVERNEMENT DEPARTMENTS 201 ~.:5 52 8.7 58 5.6 51 3.5 lOCAL GOVERNMENT :533 8.8 55 9.2 68 6.6 176 12.0 INSURANCE. ' 330 8.7 30 5.0 95 9,0 '135 9.2 BANKING 464 12.3 105 17,6 145 14,1 130 8.8 BUREAU. -3ii:! 9.6 35 5.7 114 11,0 131 6.9 MANUFACTURING: 1,614 42.6 270 45,0 :575 34,7 684 46.5 -*Food 251 6.7 42 7.0 64 6.2 68. 6,0 * Mechanical 221 5.9 42 7,0 42 4.j 103 7.0.
* Electric .. 17G 4,7 17 2,8 28 2.7 68 6.0 • Motor -151 4.0 24 4,0 55 ·5,3 S> 3.4 • Chemical. I 4.0 ·34 5,7 32 3.1 70 4,8 -•" I 153. i.
• Metals ,_I
165 4,4 34 5.7 15 1.5 89 6,0 .. • T ut, lleI
109 2.9 29 .4 .. 8 27 2,6 27 1,8 ~ Transportation eo 2.1 '10 1,7 25. 2.4 22 1.5 * 011!
77 1,8 12 2.0 26 . 2.5 16 . 1.2 • Retail I as 2.2 9 1,5 14 1.4 S> :5.4 I.
• Engeneerlng I 57 1.5.
40,7 7 0.7 42 2,9 *Publishing
·I
41 1.1 a 1,3 11 1.1 15 1,0 ~ Mining 48 1.3 5 o .. a 11 1.1 22 1,5 ..I i
. T 0 TAl 3,779 600 ~.em 1,469
.
I SOURCE: W.K DE BRUIJN -Computers In Europe ln 1966.BENElUX N.
"
.
64 9.5 40 5.9 34 5.0 70 10.4 64 12.4 82 12.1 303 44,8 57 8.4 34 5.0 43 6,4 22 3.3 17 2.5 27 4.0 26 3.8 23 3.4 21 3.1 12 1.8 4 0.6 7 1.0 10 1,5 677 I
UNITED KINGDOM N ..
~
.
210. 11.8 105" 5.9 234 13,1 115 6.4 1_16 6,5 1j3 7,4 875 LS.9 89 s.o 104 5.8 147 8.2 143 8,0 122 6,9 85 4,8 49 2.7 35 ~.o 34 1, 9 12 0.6 16 0.9 20 1.1 19 . 1,1 1,768..
i I I, i ' ' '. -.... '·· ·.· .FRANCE .. 1968 (2) · MANIEACruRING INDUSTRIES -.• 36.7 BANKS.AND INSURANCE COMPANIES 15.8 PUBLIC UTILITIES -5.4 \.-GElVERNMENT. -17.1 SERVICE BUREAUX
-OTHER AND RETAIL ;: 21.3 T 0 TAL -100.0. (1) Information for B£LG1UM-1fot-available (:5) lnat.ltut fur Angewandte Reaktorphyslk.GERMANY 1967
(3)
45.6 20.8 6.5 5.0 8.3 13.8
100.0 : .l5) W.K. De Brut Jn -C0111puters use In Netherlands ITALY NETI£Rl.ANOS UK
..
1968 (4) 1967 (5) 1967 (6) -47.9 44.3 44.4 -20.2 21.1 9.1 s.o :5.S 6.9.
.
17_019.6 28.2
-..
-10.2 8-,.1: ' 9 .. 9 1 .. 0 2.7 100.0 100.0 100.0. (2)
BIPE (4) Cassa dl' Rtapar11lo delle Province lolnbarde . . (6) Compu\_. ~
..
2. THE BENELUX
2.1. Sources
The statistics about computer installations refer in most
·cases to Benelux as a whole, instead of examining ~eparately
Belgium and Holland.
For the years 1962 to 1969 data disaggregated per model are·
available onl"y for Benelux; whereas, frqm 1965 to 1969 it is
possible to analyze separately the installations per model in
Belgium and Holland.
Data, both aggregated for the Benelux countries and disag
-gregated for Belgium and Holland, have been supplied by the
Diebold Group.
The Diebold statistics have· been controlled and integrated by
.
the.exhausting information supplied by SOBEMAP, the Belgian
26.
2.2. Development of computer installations
The actual hardware situation in the Benelux countries and its
development trends depend from the trends, in number and
value, of computer installations in BelgiUm and Holland.
Trend of the pomputers installed in the . .Benelux_ (number and value)
Years Number Value
(ooos
annual rental)1962 . 175 13,238
1963 270 19,550
1$}64 422 29,625
1965 600 39,872
1966 861 58,998
1967 1,277 82,093
1968 1, 741 113,251
1969 (30/6) 1,964 127,601
InJune 1969t the Benelux countries account for a seventh of
the EEC installations.
The Benelux installation has recorded an average an·nual
growth rate of +45.5% in number and +41.9% in value from
1962 to 1969; these figures demonstrate that the Benelux have
dev~t8p84 at a rate higher:than the EEC countries (+39.0 in
. .
.
INSTAI:LATIONS IN BELGII..Mj HOLLAND AND BENELUX, 1965 AND 1969
(number and value)
... NIJ.IBER VALUE lannual rental)
1965 . 1969 1965 1969
N.
"
N."
000s
"
000s
'
"
BELGILM 288 48.0 903 43.6 17,636.e 44.2 54,101·0 41·7
NEJHERLANDS )12 52.0 1,167. 56.4 22,235.4 55.8 75,528·2 58·3
.
!ill!:.'
.
(:00 100.0 2,070 100.0 . 39,872.~ 100~0 29,629·2 100·0Making a detailed examination of the Belgian and Dutch
.·ccomputer installation for the .years of which the ·equipment .
. .
.
.
~ .. . . . . . . . . . .of both .~ountries· is knoWn.t ··one .notes that there are always m6re installations in Holland. ·
Besides, considering the percentage of the two countries, the Dutch percentage, between 1965 and 1·969, has increased in number and value.
In Belgium as well as Holland the years which saw the major developments were 1964 and 1967, a fact which demonstrates
'
that also these countries have shown the effects of the introduction on the market of the second and third computer generation s.
Iri Holland the first computer employed dates back to 1952
.
and the first computer for scientific use was put in operation in the second halE
ot
1954~ The real computer diffusion,however, began in 1957 when the first installations for
comme~c~al purposes were made.
The
ratio
number and valueoP
ca.mputersinstalled per number28.
of extra-agricultural employees allows to make an evaluation
of the diffusion of the hardware in the two countries as
.compared to the Common Harket as a whole.
BELGILM
NETHERLANDS BE fiE LUX EEC
U~K·
BELGILM NETllERLANDS
BENELUX
'·
EEC U·K·
.
NUMBER OF COMPUTERS PER MILLION EXTRA-AGRICULTURAL EMPLOYEES
1962 . 19G3 1%4 1965 1966
85 119
?8 112
25 38 58 81 115
28 ~ 61 85 110
20 36 51 59 - 79
.·
HARDNARE INVESTh\ENT PER EXTRA...AGRICUL TURAL EWLOYEE
(dollars)
1962 1963 1964 1965 -1966
5.2 e.o
5,5 7.7
1.8
.
2.7 -... 0 5.:5 7~82.:5 3.0 4.5 5,9 7.6
1.4 2.6 4,1 4.9 7,2
I
1967
168 176 173 155 105
1967
11.5 10.7 11.0
.
10,9 8.3
-1968
220 245 234
200
138
1968
16.~ 14.2 15.2 14.2
I
12.3
During the period 1962 - 1965 the average EEC ratio number of
computer installations per number of extra-agricultural
employees was higher than the one of Benelux; however, later
it improved its. position in the comparison.with the other
countries.
The intensity of the computer installations· development in
the Benelux countries between 1962 and 1969 is confirmed by
the Gross National Product, a rather1high elasticity. In fact
the regression analysis gives the. following result:
6 . '7 084
y ; o,.363 • · 10- 7 ·
x •
( sb
= .·
0. 46 6 ) (r =. 0.989).•.
where x
=
GNPand y ~ value of .annual rental of installed hardware (Fig.
IV/5).
The elasticity (7.0849) is inferior only to the Italian one-for the same period. The hardware expenditure accounts in 1968 for 2.58°/oo ~f the Dutch oross >~tional P.roduct and for 2.31°/oo of the Belgian one.
-
•
.
~ L.- ::3,... :::.g -o c: .,c:
It~
140
-f
....
...••
~-120
~
~ L.
•
:XI
100 eo .60 40 20 0
~
.
30
32
FIG.
IV~
EOP
EXPENDITURE
(1)
IN
RElATION
TO
GNP
1967
•
.
/
/
1966.
/
/
/.1965
1963
/
~964
1962
.)J
~
---
3436
38
40
42
(
1962
-1968)
I
I 44
I
I
1
e1968
I
46
48
(1)
Annual
rent.al
of
hard-are
Installed
...
0,989"
Y
•
0,3630·
•
10-67
•
x7,0849
8t,
•
0.4661
GNP
(billion
dollara)
I
~>ELUX
I
.
"I~
I
FIG. tV/6 EDP INYESnENTS (1) IN RElATICJI TO GROSS FIXEO INVESnENTS-
:.•
\.•
•..
-
c.... • 0 .! '0 140-t;& c
·-
--....
120 -t 25 .. w-100 -teo-t 60~ 40
~ 20 4 0 (1963-1968) I 1968-I
I I
1967
el I
1966 e I I / / 196'/e .1965 / 1963 .,.
,
6 7 8 9 10 11,.
Ir .·o.964 Y • 0.2826 • 10-38 • x4.6454 8tt • 0.6441 Gross f I xed I nves t~~enta (billion dollars) (1) Annual increaae of EOP lnatallatlona eati•ated on the purchase price
32.
2. 3. Computers insta-lled by s'ize classes
A breakdown of the computer equipment according to size classes ·permits an examination of the computers installed in Benelux
.
as. compared with the EEC, with special emphasis t>•l large
computers.
"'ftmSER AND VALUE OF CQ.IPU'T!RS INSTALLED IN THE BENELUX BY SIZE
' 1962 1969 (:!0/6)
. N. Value N. Value
(000 S) (000 S)
bESK 15 324.0 495. . 8,816.8
SMALL 151 10,102~8 1,250 67,014,3
MEDIUM ·4 651.6 174 !5, 133._8
LARGE 5 2,160.0 29 '· 12,103,5
£XTRA-LARGE
-
-
6 4,532,7UNCLASSIFIED
..
-
10-
.
TOTAl 175 13,238,4 1,964 127,601.1
-·
-
-·
TOTAL (excludl rig Desk) 160 12,914.4 1,469 118,784,3
In total the Benelux countries have a computer equipment which is larger than that of other European countries; however, as far as extra-large compu'ters are concerned, they possess the smallest number, and·all of them are located in Holland. Holland have also a higher number of large c~mputers than Belgium. ( fige IV.7- IV.9.)
F'IG. rf/7
ESTIMATED ANNUAL·VALLE OF' Ca.1PUTERS INSTALLED AT n£ END OF EACH YEARS, BV SizE CLASSES
(1962 - 1969)
•
180 L.
•
....
.... 0
"0
160
5
;:;
140 .... :II 120
100
eo
60
40
20
0
1962 1963 1964 1965 1966 1967 '
EXTRA-LARGE
LARGE
MEDIUM
SMALL
DESK
f"l G. I Y/13
ESTIMATED ANNUAL VALUE ~ CMUTERS INSTALLED AT n£ END ~ EACH YEARS, BY SIZE "CLASSES
( 1965 - 1968)
•
r..•
.... ....
0
,
g
100 .... ....
:I:
00
60
40
20
0
35.
FIG,. IY/9
ESTIMATED ANNUAL' VAll£ 0: Ca.4PUTERS INSTALLED AT n£ END OF EACH YEARS, BY SIZE CLASSES
(196.5 - 1968)
•
100
...
...
:.
0
,
eo 5
;::;
...
60 :IE
EXTRA-LARGE
LARGE
40 ~·lEO I \Jot
20 SMALL
0 DESK
36.
I
·The Benelux installations, with the exception of extra-large
compute~s,· have· developed during the period 1962 ~ 1969 at ·an
·' .
average annual growth rate which was always h~gher than the· .one of the EEC countries, as can be seen.in the following
table:
. AVERAGE-
ANNtal
RATE OF' GRownf OF' TIIE"'INSTALLATIONS IN 'mE DENELUlC'AND· · - THE EEC COUNiRIES (1962 .. 1%9}
BENELUX EEC
.
..
. . NUIIber . Value Number Value
'
..
.
DESK
.
~.1 +81,0 +19,6 +81,7.
.. -37.1+32,7 +l3,? +31.7
SMAU
MEDIUM
.
+73.5 +80,9 +44.5 +47,8. LARGE .~.9 +34.0 +19;5 .ro.2
£XTRA-URGE
-
-
+188.9 +151,2TOTAL +45,5 +41.9 +39.0. +35.8
-
.
'-Noteworthy in the Benelux countries is the rate of growth of the medium size computers which increases at an average
annu~rate of
73.5%
in number and of80.9%
in value, asagainst the average EEC rate of
44.5%
in number and47.8%
in value~ In fact, in 1962 there were only four computers
of th~s size in BeneluX, and by the middle o£ 1969 there
PERCENTAGE OF THE BELGIAN AND OOTCH INSTALLATIONS ON THE BENELUX TOTAL
1965 1968
. '
.
-BELGiuM HOLLAND BENELUX .. I£LGILM HOLLAND BENELUX
' .
Number
.
. DESK 40,0 60.0 100,0 .\4.6 55.4 100.0
SMALL 51.2 48.8 100,0 43.6 56,4 100.0
MEDIUM 35.0 65,0 100.0 'S7.7 '62.3 100,0
.
lARGE 42.9 5?.1 100,0 34.6 65.4 100.0
EXTRA LARGE
..
-
-
-
100,0 100,0. '
Value
llESK .. 38,3 61.7 100.0 4'6.4 53.6 100.0
SMALL 47.4 52.6 100.0 46.9 53.1 100,0
MEDIUM 36.6 63.4 100,0 '39.4. 60.6 100.0
URGE 36.3 63.7 100.0 33.1 66,9 100.0
'EXTRA LARGE
-
-
-
.-
100,0 100,0Holland absorbs, in nwnber as well as in value, the major.
share o£ each size class o£ the installations ·in the Benelux
countries.
Between 1965 and 1~68 the installations have £allowed a
different course in· each of the two countries. In fact, the
Belgian percentage of desk and mediwn computers has increased
Also in Benelux, like in the other EEC countries, the major
part' of the installed computers are from IBM which in 196S
38.
had a market share of 47.61. in number and of 59.0% in value.
IBM dominates especially the market of large and extra-large
computers, while in the desk and small classes it faces strong
competition from Bull/GE. On the hardware market ·of the
Benelux countries· Bull/GE has, in fact, a share of 59.6% in
·number and of 63.6% in value in the desk class as against a
total share of 23.6% (and of 13.1% in value). In the class
of small computers the market shares attributed to Bull/GE
are 9.9% in nwnber and 8.6% in value (table IV.C).
Numerous, but with shares of little importance, are the other
manufactures on the Beneltu market. The national Dutch industry,
Philips, arrives at .only 5.6% of the total number of
installations in the Benelux countries (and at 5.5~ of the
value), and the major part of its installations are
concentrated on the Dutch market.
At present, the goverrunent of this country does not follow a
specific policy in the EDP field and grants no direct subsidies
to this sector of industry. It does, however, supply aid to
the institutions which occupy themselves fully,or partial:ty
with EDP and whos.e services can be made use of by anyone,
either without charge or at reduced rates.
The purchase of computers for the goverrunent agencies and
sponsored institutes are coordinated by the
I.
I£LGI
LM
I .
TABI.~IV•C (bis) MARKET SHARES PER MA~ClURERS, ACCOROIOO: TO niE SIZE OF niE CO!iPU'l£RS .. rfA~'i..--. .. )
.
v-NUMBER v A L UE
··-; DESK SMALL MEDIUM LARGE EXTRA-LARGE TOTAL DESK SMALL II.EDIUM LARGE EXTRA-LARGE TOTAL' ·-- "' ~ BULliGE 61.0 12·6 15.6 15.4
-27,2 59.3 10.9 16.2 -18.9 . -17,2.
CDC -0.2 1,6 -0.2 : -0.1 -·o.4 Cll 3.8 ·4.:5-...
3.8 4,5 2.8 ' -2,0 -HCf.'EYWEU. ·-1.4--.
0,9' -2,1 -1,2 IBM 29,0 .. 63.6 64,1 84.6-.
53.8 34.4 65.8 66.6 81.1 -64.9.
.
ICL 0.4 1~8 -1,2 0.3 4.5. -2.6.
PHILIPS/EL -1.3 1.6--·
-0.9 -1.0 .1.1 -0.8 SIEMENS 2,3 1~4 7.8 -2.1 0~3 1,4 7.5 -2,9 UNIVAC -9.5 -5.9. ;.. 6.6 -~ -3.8 OTHERS ~.!l.
3.7 9,3 4,0 .1.2 4.8 ~.6 -. 4,2 --·. -! .· i ----TOTAL 100 .• 0 100.0 100.0 100.0 100,0 100.0 100,0 100.0 100.0 . ·100,0 100.0 100.0-·
r -· ..: I
42 •
. 2.5. Computers installed by.industry
A research published in September 1969 (1) indicates the
principal sectors of utilization from 1952 to 1967 and points out that, as Holland maintains the highest percentage of all Benelux installations, the results which are valid for that .country can also be extended to the Benelux countries.
The table IV.d. . ·records the percentage of the computer
installations for the 26 sectors considered, during different years.
. I
The University sector was the one to install the first
computer and to maintain for at least ten years the highest perce,ntage of installations. In 1963/1964 the sector Banks and Insurance Companies possessed the highest number ·of computers and maintained this position until 1967 •.
The ~ectors · of the manufacturing indus tries, ecich of which accounts for only a modest percentage of the total number of
ins_tallations, ·taken· as a whole represent instead almost half of the installations. Small is also the number of
. \
·installations. in central and local govermnents, representing ·only 10.3% of· the, total· equipment.
(1)
·w.K ...
De Brui'jn - Computer Use in the Netherlands~·•
~] •. 1l1lt:E ,., • ., . PEl'lttftllG! tF CMtn!M ftfST-M.l.£0 1W INfXISTRY . 1952 1!53 '1~ 1955 1956 195? 1958 1959 1950 .. -UNIVERSITIES 100.0. 100.0 66.7 50.0 50~0 33,3 • +'·4 2'7.6 21.7 OIL 33.3 25.0 25.0 16.7 16,7 20.8 16.2 -CARS 25.0 25.0 16.7 5.6 3,4 5.4 SERVICE CENTRES ' 33.3 .16.7 10.4 • 13.5 INSIJlAtU COWANIES · 11.0 17.3 1R.9 FOOD .. 5.6 3.4 2.7 BANKS .. 3,4 2.7 ELEI;TRIC MACHINES ,: . 6.9 8.1 GOVERr*NT · ~ ... 3.4 5.4 TRANSPORTATION.
.
.. 3.4
. 2.7 METALS, STEEL .
.
., 2 .. 7 'I I LOCAL GOVERtiDT ~ .. . '.
c lEXTtlES r UA1L ORDER . . •· .~-.
.. WOOD AND PAPER .. GLASS AND CERAMICS · · AGR I Cll. TURE .· . •· ., ' . _OPTICS ; · ...
---.
PHARMACEUTICAL,ctEN14r. CONSTRUCT!
ONS
.
.
;.
.
..
PUII.ISHING..
. ..
LEAT~..
' I RUB9ER • .. RESEARCH, CONSlL TfNG.
OTHER . ,..
TOTAL • 100.0 100.0 100.0 100.0 100.0• 100.0 100.0 100.0 1o0,0.
.
SOI.R:E: W•K•. IE EIRUI.If -COifiUTER USE IN NETlERl.ANDS-1961 1962 1963 1964 . 18.1 16.5 14.5 .~1.6 13.-J 7.3 5.3 3.9 4.2 4,6 S.l 3.4 12.5 12,8 12.6. 12.1 '· 12.5 11.0 9.3 9.2 5.6 8.2 7.~ 7,7 8.3 11.0 15.2 . 18,8 8.3 9.2 7.3 9.6.
5.6s.s 6,0 5,8 2.8 2.8 3.3 1.9 5.6 . 4.6 5,3. 4.3 1.3 2.8 3.3 3.9 1.3 2.8 3.3 2.9 0.9 0.7 1,9 0_.7
0.5 0~ 0,5
..
o.s 1.0
. · .. ., ·.
-.
.
. . 100.0 100.0 100.0 100,0 ..-1955 .. 1966 ' . .. 10.7 9~7 2.6 3,5 2.9 2.3 12.4 11~8 9.1 . 9.1 ·7.5 6.1 16.2 15.3 9.1 7.0 s.a 4.9 1,9 1.9 5.8 s.a 4.2 4,7 4,9· 4.5 1,9 1,4 1.3 1.0 0.3 ' 0,2 0.7 0.6 ·o.7 0.5 --0.7 2.7 0,3 1.0 1.62.1 0.6 Q,4 0,4
0.3 . 0.4 100.0 100.0 1967
9.3 3.4 2.8 10.2 8.8 7,8'
12,3 7.7 3-e 2,2 6.6 6.5 5.4 1
.•
2
i
1.3 0.3 1.1 0.5 2.3 1.3 2.6 0.5 o.s 0.7 1-1
100.0
~--·
.
.
.
,r::.. (,.)
..
3. FRANCE
44.
3.1. Sources.
.
The following table lists the available sources of information concerning-the insta~lations of computers in France during the last ten years.
Not all of them are original. The Lhermitte's study, for
example,though making minor changes, uses information collected by Diebold and published in the ADP New~letter. The De Little's study uses data from other sources, completing them, however, with infor~ation received by manufacturers.(T~ble.IV.c.)
There is also a difference in the degree of these sources· .
.
reli~bility. In this resp~ct the most satisfying are the data
of the "Syndicat des Industries de materiel professionnel
elec~ronique et ratiotechnique" which were colle~ted directly from the manufacturers. Unfortunately however, they are
. published i~ aggregated form withholding indications as to
>
model which are th·e only one to a1.low an identification ofthat segment of the market which is the purpose of this
study. For this reason, our analysis. is based essentially on data supplied by the ADP Newsletter which have been duly corrected wherever other more reliable sources permitted to do so.
The SORIS estimates for the period 1962-1969 are systematically lower than those of the SPER st'udy,, this .being due, above all, to the fact that the latter -includes many processing computers which have been constructed by firms operating only marginally in xhe field of computers and which have not been included in the SORIS research ·(1).
(1) The firms in question are the following: Alcatel, Compagnie des Compteurs,, Jemont Schneider, Schlmnberger, SINTRA,
f 11l\tJI£ i~' NlM!ER r7 Ca.tPUTERS INSTALLED, ACCORDING TO VARIOUS SOURCES (1958 -t968) •· 1958 1959 1960 1961 1962 1963 1964
..
.
. . K. DE SIWIJN 35 6.5 16.5 275 520 790 1.050-.
LI£RMITTE .. "20 60 ·125 2aS 510 77S 1.043 DE LITTLE 750 1.050 EOP 791 1.090 SPER .. 524 776 1.058 . AOP "445 556 1.043 SORtS...
382 588 998 . ---1965 1966 .. 1.250 1.850 1.578 2.008 1.400 1.8CO 1.320 2.025 1~624 2.323 1.578 2.008 1.548 1.935.-1967 2.600 2.975 3.430 3.959 3.030
1968
.
--
---5.010 4.079
46.
3.2 Development o£ computer installations.
The first computers introduced in France at the end of 1955 were the IBM.650, followed the year after by the Gamma ET o£ Bull •.
By the end of 1958 there were 20 computers installed, ten years later there were 4,000, the equipment had multiplied 20 times.
The French installations trend follows an exponential law with a tendency to doubling itself every year until 1964 and every two years therea.f~er.
The comparison between the ~verage annu~l rate of increase o£ the French equipment (in number and value) and the EEC and
us
~veals the following results:.
.,.Annual rate of Increase (1962 -1969)
CoW1tty Number Value
France + 46.5 + 40.9
E!EC + 39.0 + 35.8
us
+ 30.2 + 29.4The equipment in 1962 (382 computers) was limited,whereas the development. of desk computers after 1963 was considerable,the growth of· the French installations has taken place at a higher ·average rate when compared with the other countries
mentioned.
However, d~spite the rapid growth, there is a considerable
•
47.
difference in the diffusion of EDP between France ·and the US
.
.
which can be proved by some indicators.
In the ratio computer extra-agricultural employee, France has managed to reduce, between 1964 and 1968, the gap with the US from ·6 to 5 years •.
In the same period, however, the gap has ·increased from 5 to 6. years when the parameter of annual hardware expenditure per extra-agricultural employee is considered.
The following factors can be mentioned for having caused a delay in value following the emplo~nent in France of computers of smaller dimensions and capacity:
-the switching of a certain.number of firms from account±ng machines to computers of low singular values;
..
the size of French firms;
- the lower·cost of manpower than in the
us,
which sometimes makes the installation of a computer unnecessary;- the delay in training personnel. s~ecialized in EDP.
Compared to
the
EEC countries France records higher figures for the twoindexes
referring to extra-agriculturalemployment.
When relatedtotb1l gross national product the annual hardware expenditure
which is
equal in France and the EEC countries48.
. cci1PUTER DIFFUSION IN FRANCE, THE EEC COUNTRIES AND THE US
19G2 19G9
·FRANC£ .. EEC us .FRANCE EEC us
. )
Number of Computers installed
per million.extra-agricu~tural.
.
'
emp.loyees . 26 28 179 250 200 757
Hardware expenditure per
extra-agricultural employee (S) 2 .. 6 2 .• 3 18.5 18.1 14-3 70·8
'
.
Hard~are expenditure per 1,000 S .. ..
GNP 0,400 0.480 1, 7:30 2,310 2.:300 ~ 5·84
'
' '
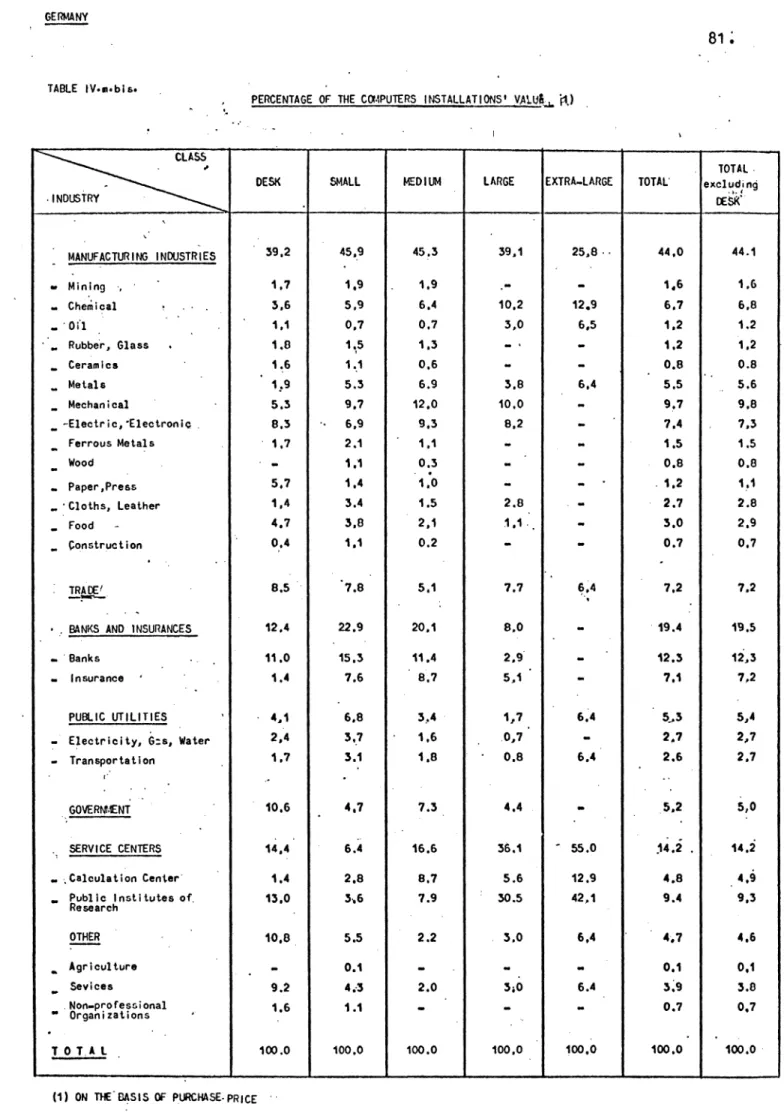
~
·The ·ratio value o£ statistically very
following results:
hardware / gross nationa~ product is
signi£icantFig~ IV.10. and shows the
y
=
0.107 •10~
65 {r = 0.99)' ( sb
=
o.
23 )··where
y
=value o£ the investment in EDP (annual rental)and x =gross national product(at market constant prices>•
The elasticity o£ the investments in computers in relation to
tbe gross
national
product reaches values comparable to theaverage
onestor
the EEC countries (6.6) and the USA (6.5).•
..
49.
The net variations of the installations (valued at purchase
.
.
price) are significantly related to the course of fixed
investments, but show, compared to the latter, a smaller growth
rate than the average ones for the EEC countries and the USA.
The regression analysis Fig. IV.11. shows the following results:'
-41 4.78·'
y = 0.168 • 10 • X
(sb
=
0.91) (r=
0~93) ·where y = net annual increase of the computers installed .(at
purchase price)·
·~Ill.
fii/Jifl)
280 260
.., -
...
--•
·240 -f • :a&..,... :II,..
=.s
"0220
~
c ..
c
~2
...
o..::!200
"-'-1
0.
180 160 140 120 100 eo 60 40 20
0 90 1962 •
---
-92 94 EDP EXPENDITURE (1) IN RELATION TO GNP ( 1962 -1968) / / / / / / / ~966
,
,
~ . .,.,. , 1963--,
.,
,
/ .1964 ..,
/ 1965 ~,
,
/· 96 98 100 102 104 106 108 110 112 114 (1) Annual rental of hardware installed. 116 118 120 / ./ /1967~ •/ /
,.
•
0.997
EJ
IfCJ68 • I I I /
/
Y • 0.1068•
10
~ • x'·"/014 . ' • 0.2269 122 124 126 GNP (billion. dollars) •