Using Evolutionary Rates to Investigate Protein Functional Divergence and
Conservation: A Case Study of the Carbonic Anhydrases
Bjarne Knudsen,*
,1Michael M. Miyamoto,
†Philip J. Laipis
‡and David N. Silverman
§*Bioinformatics Research Center, University of Aarhus, 8000 A˚ rhus C, Denmark,†Department of Zoology, University of Florida, Gainesville,
Florida 32611-8525,‡Department of Biochemistry and Molecular Biology, College of Medicine, University of Florida, Gainesville, Florida
32610-0245 and§Department of Pharmacology and Therapeutics, College of Medicine, University of Florida, Gainesville, Florida 32610-0267 Manuscript received November 19, 2002
Accepted for publication April 9, 2003
ABSTRACT
Functional constraints on proteins limit their evolutionary rates at specific sites. These constraints allow for the interpretation of conserved residues and sites with a rate change as those most likely underlying the functional similarities and differences among protein subfamilies, respectively. This study describes new likelihood-ratio tests (LRTs) that complement existing ones for the identification of both conserved and rate change sites. These identifications are validated by the recovery of residues that are known from existing biochemical and structural information to be critical for the functional similarities and differences among carbonic anhydrases (CAs). In combination with this other information, these LRTs also support a unique antioxidant defense role for the puzzling CA III. As illustrated by the CAs, these LRTs, in combination with other biological evidence, offer a powerful and cost-effective approach for testing hypotheses, making predictions, and designing experiments in protein functional studies.
F
UNCTIONALLY important sites and regions of bio- duplications (Gu1999, 2001;KnudsenandMiyamoto2001). For relatively recent events, these tests usually logical sequences are under strong purifying
selec-tion and therefore evolve slowly according to the rule of rely on comparisons of the nonsynonymous
(replace-ment) to synonymous (silent) substitution rates for
cod-functional constraint in molecular evolution (Kimura
ing DNAs (Hughes1999;NeiandKumar2000;Yang
1983; Li 1997). This widely acknowledged rule forms
andBielawski2000). However, this approach is limited the foundation of many comparative approaches for the
by the relatively rapid saturation of the synonymous functional analysis of protein and nucleic acid
se-substitutions by multiple hits. Thus, studies of older
quences (Hughes1999;Neiand Kumar 2000;
Land-protein subfamilies usually rely on the replacement rates
graf et al. 2001; Gaucher et al. 2002). For example,
alone to identify sites that are most likely responsible conserved amino acids are routinely interpreted as those
for their divergent, as well as conserved, functions that are most likely critical for an enzyme’s function. In
(Gaucheret al.2002). turn, those homologous sites with varying evolutionary
In these studies of protein functional divergence, re-rates among protein subfamilies are often interpreted
placement rates are most often evaluated on a site-as those that most likely underlie the functional
differ-by-site basis and according to whether they differ be-ences among their groups. When integrated with
bio-tween subfamilies or are accelerated in their stems (i.e., chemical, structural, and other biological information,
in the direct ancestral or basal-most lineage that leads these rate tests of functionally important sites offer a
to the most recent common ancestor of the group; powerful and cost-effective way to generate new
hypoth-Knudsen and Miyamoto 2001; Gaucher et al. 2002; eses and experiments for testing protein function (
Gold-PupkoandGaltier2002). The two latter patterns of
ingandDean1998).
rate change, as evidenced by their subfamily differences Protein functional divergence is related to gene
dupli-or stem accelerations, have been referred to as type I
cations and major speciations (Ohno 1970; Nei et al.
and type II divergences, respectively (Gu 1999, 2001).
1997;Hughes1999;LynchandForce2000;Gaucher
The most obvious example of a type I site is a
homolo-et al. 2002). In particular, gene duplications provide
gous position that is conserved for a particular amino the additional coding and regulatory sequences for the
acid in one subfamily, but highly variable in another. origins of new protein functions and subspecializations
Such a site can be interpreted as functionally important of their ancestral roles. Correspondingly, most rate tests
in the first subfamily, but less so in the second. In con-of functional divergence focus on the subfamilies from
trast, the best example of a type II site is one that is fixed for radically different amino acids between the subfamilies. Here, the functional interpretation is that
1Corresponding author:Department of Zoology, Box 118525,
Univer-this site fulfills different, but equally important roles in
sity of Florida, Gainesville, FL 32611-8525.
E-mail: [email protected] the two subfamilies.
Type I and II divergences belong to a series of five nested hypotheses for rate change and conserved sites (Figure 1). These related hypotheses are sequentially interconnected from the simpler to more complex by three rate parameters. New rigorous likelihood-ratio tests (LRTs) have been recently described for type I and conserved sites (H1a,H2, and H3; Knudsen and
Miya-moto2001;PupkoandGaltier2002) and compared
to other current methods (Gu1999, 2001;Dermitzakis
andClark2001;Gaucheret al.2001). This study com-plements these LRTs for type I and conserved sites by describing new ones for type II positions (H0andH1b).
As an illustration of its utility, this comprehensive series of LRTs is applied to a set of carbonic anhydrases (CAs). These LRTs recover known sites of functional impor-tance to CAs and support a distinct biological role for their puzzling CA III.
LIKELIHOOD-RATIO TESTS FOR RATE CHANGE AND CONSERVED SITES
Type II model:In type II divergence, the evolutionary rate for a specific site is accelerated somewhere along the basal internode that connects the two subfamilies (Figure 1). This basal acceleration can be modeled by multiplying the overall rate for this internode, as
esti-mated for the entire protein, by a factor of a ⬎ 1.
Alternatively, this acceleration can be modeled by in-creasing the length of the basal internode by a positive
Figure 1.—Nested hypotheses and LRTs for rate change
amount. These two approaches are identical when there and conserved sites. Triangles represent the two protein
sub-are no prior constraints on the basal acceleration. families from a gene duplication or major speciation (for
an example of subfamilial divergence due to the latter, see
In this study, this acceleration is modeled with the
Gaucher et al.2002). Red and blue denote a homologous
new factor, thereby yielding three parameters for the
position with different rates in the two subfamilies (e.g., fast
type I and II tests (afor the basal increase andrIvs. rIIfor vs.slow, respectively) and therefore a type I site. A break along
the site-specific rates in subfamily Ivs.II, respectively). the basal internode, connecting the two subfamilies, signifies
These parameters are included in the likelihood calcula- an accelerated rate for the position in one or both of the
subfamily stems and therefore a type II site. Black and purple
tions by extending the relevant branches in the tree by
denote a site with a single rate that is equal or unequal to the
corresponding amounts (Felsenstein1981). As Figure
overall average for the protein, respectively. The five
hypothe-1 shows, the significance of these parameters is tested
ses are for type I and II sites (H0), type I or II positions (H1a
in a hierarchical fashion, first for a basal acceleration and H
1b, respectively), and those with a single rate that is
and/or rate shift (H0,H1a, orH1btoH2). If there is no unequal or equal to the overall average (H2vs.H3). The num-bers of free parameters (fp) for each hypothesis are listed to
rate shift or basal acceleration, the site is then tested
the left. These parameters include the basal acceleration factor
for whether it is evolving slower or faster than the overall
(a) and separate rates for the two subfamilies (rIvs.rII). Arrows
average for the protein (H2toH3). indicate which nested hypotheses are directly compared in
Testing the hypotheses: The likelihood values for the LRTs and which parameters are reduced from the more
each site are calculated using the method of Felsen- complex to simpler models.
stein(1981). Maximum-likelihood (ML) scores are ob-tained for all hypotheses by optimizing their free param-eters given phylogeny of the sequences.
U1a⫽ ⫺2 log L(H2) L(H1a)
The ML scores for the three rate change hypotheses [L(H0),L(H1a), andL(H1b)] are each tested against the
ML score for the hypothesis with a single rate for the
U1b⫽ ⫺2 log L(H2) L(H1b)
. entire tree [L(H2)]. These evaluations are quantified by
the U values of their LRTs (Knudsen andMiyamoto
U0 and U1b are strongly influenced by an amino acid
2001):
replacement along the basal internode. Thus, neither statistic closely follows a2or related distribution, since U0⫽ ⫺2 log
L(H2)
distrib-Figure2.—Choosing which stem to test for a rate change when more than two subfamilies are represented. This selection is illustrated for three protein subfamilies andH1a(Figure 1). There are three stems to test for a type I change given three subfamilies. The one with the greatest ML score is chosen for the LRT ofH1atoH2. In the same way, single stems are selected for the LRTs ofH0 andH1b.
uted values. Consequently, the 5% significance levels rate change hypothesis, then the one with the greatest
for U0, U1a, and U1b (U5%0 ,U5%1a, andU5%1b, respectively) difference is accepted as the best explanation for the
are found with simulations (see below). site in question.
The 5% cutoffs from the simulations are compared The main reason that only a single rate shift or basal
to the observedUvalues (HuelsenbeckandRannala acceleration is allowed for each site is that the number of
1997): possible rate change configurations grows exponentially
with the number of sequences. The introduction of even
⌬U0⫽U0 ⫺U5%0
one extra rate change would lead to increased numbers
⌬U1a⫽U1a ⫺U5%1a of parameters, thereby making it much more difficult
to estimate them reliably given the available information
⌬U1b⫽U1b⫺ U5%1b.
for a site.
A positive ⌬U indicates that the corresponding rate The final selection of H0,H1a, or H1b for a site with
change hypothesis is a significantly better explanation more than one significant⌬Udoes not inflate the overall
of the data than isH2. If⌬Uis positive for more than one significance of the accepted rate change hypothesis,
rate change hypothesis, then the one with the greatest since this decision is made after the LRTs are completed.
difference is retained for the site in question. If no In contrast, the selection of which stem to test given
⌬Uis positive, then the rate for this site is accepted as more than two subfamilies forms the basis of the LRTs
constant throughout the tree. The constant rate can themselves and is therefore vulnerable to the effects of
then be tested against the average for the entire protein multiple testing. This source of inflated significance can
to determine whether this site is evolving significantly be readily corrected by establishing the 5% cutoffs in
slow or fast. This test is done with the following LRT the simulations with only the best ML scores for the
(KnudsenandMiyamoto2001): multiple subfamilies.
Type II LRTs—power analyses and phylogenetic
er-U2⫽ ⫺2 log L(H3) L(H2)
. rors:A site with a fixed amino acid difference between
two subfamilies provides the clearest evidence of type
Although U2 approximately follows a 2 distribution, II divergence (Gu2001). The probability of obtaining
simulations are again recommended for the determina- this fixed difference by chance (P) can be approximated
tion of its 5% cutoffs, since they are more reliable. under the Jukes-Cantor ( JC) model that assumes equal
In this series of LRTs,H0is directly compared toH2, replacement rates among all amino acids (Jukes and
even thoughH1aandH1bare also nested in the former Cantor1969). A highly significantPwill reflect a large
hypothesis (Figure 1). Thus, alternatively,H0could be difference in the probability of an amino acid change
directly evaluated against H1a and H1b, rather than withinvs.between the subfamilies. Thus,Pcan serve as
against H2. However, this alternative sequence is not a measure of the power available to type II LRTs.
preferred, since their 5% cutoffs are determined with
Assuming that all replacements occur with equal
fre-simulations. Direct testing of H0 against H1a and H1b quency and that none are hidden due to multiple
requires the specification ofrIandrIIorain their respec- changes,
P can be approximated for a given rate (r)
tive simulations. By comparing insteadH0to H2, these
under the JC model by the following equation (Jukes
extra parameterizations are avoided.
andCantor1969): Evaluating multiple subfamilies: The type I and II
LRTs specifically test for rate changes in either or both P(r)⬇ (1⫺e⫺rl0)e⫺r(lt⫺l0)⫽e⫺r(lt⫺l0)⫺e⫺rlt. of the subfamily stems (Figure 1). By analogy, these
LRTs can be extended to the stems of multiple subfamil- Here,l
0andltrefer to the branch length for the stem
ies (Figure 2). Given multiple subfamilies, ML scores of the test subfamily vs. that for the total phylogeny.
are separately calculated under H0, H1a, and H1b for a The gamma distribution can be incorporated to
accom-type I and/or II change along each stem. The one stem modate site-to-site variation in rates (Yang1996):
with the greatest ML score forH0,H1a, orH1bis retained
for further testing of that rate change hypothesis with P⫽
冮
∞r⫽0
φ(r)P(r)dr⬇
冮
∞
r⫽0
φ(r)(e⫺r(lt⫺l0)⫺e⫺rlt)dr.
TABLE 1 The power analyses further illustrate that rate hetero-geneity among sites increases the chances of a type II
Power analyses of the type II LRTs
position (Table 1). Under a gamma process with␣ ⫽
1.15, a relatively large proportion of sites is slowly
evolv-A. % 2lt(CA) %lt(CA) % 0.5lt(CA)
ing (Yang 1996). For these slow sites, any chance
re-2l0(CA I) 0.72 2.51 7.32 placement in the stems is less likely to be followed by
l0(CA I) 0.35 1.19 3.34
a subsequent change within the subfamilies relative to
0.5l0(CA I) 0.17 0.58 1.60
a position evolving at or faster than the average rate. Thus, a stem replacement for a slow site is more likely
B. l0 %␣ ⫽1.15 %␣ ⫽∞
to be preserved as a fixed difference among subfamilies.
CA I 0.2140 1.19 0.82
This conclusion reinforces the overall conservative
na-CA II 0.1332 0.72 0.49
ture of type II sites and their corresponding potential
CA III 0.2953 1.67 1.18
as indicators of protein function (Gu2001).
Percentages are the probabilities of observing by chance
An alternative strategy to increase power in the type
(P) a fixed amino acid difference between one CA subfamily
II LRTs is to include an appropriate replacement matrix
and the two others. (A) Power analysis for CA Ivs. II and III,
for unequal rates among amino acids [e.g., the Jones,
given varying lengths of the stem for the former subfamily
[l0(CA I)⫽0.2140 replacements/site]vs. total tree [lt(CA)⫽ Taylor, and Thornton ( JTT) model;Joneset al.1992].
3.3730 replacements/site]. (B) Power analysis for each CA For CAs, P under the JC model is ⵑ1.19% for a site subfamily, with and without a gamma distribution (␣ ⫽1.15
with any fixed amino acid difference between CA Ivs.
and ∞, respectively). The 1.15 estimate is the ML value for
II and III. In contrast, according to simulations,Punder
the CAs under the Jones, Taylor, and Thornton model with
the JTT model varies from⬍0.01% for Fvs.K toⵑ1.79%
a gamma correction (Joneset al.1992;Yang1996).
for H vs. Y of CA I vs. II and III, respectively. These
extremes agree with the premise that radical amino acid
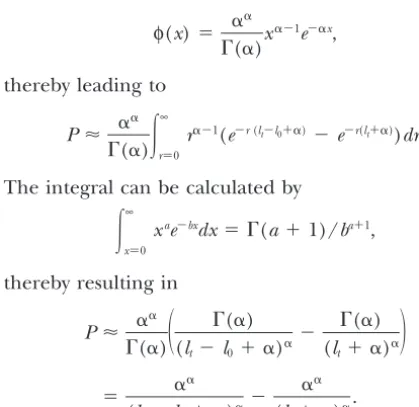
The gamma density function, with parameter␣, is calcu- differences are more informative than conservative ones
lated by about the functional divergence of proteins (
Living-stoneandBarton1996;Gu 2001). By incorporating
φ(x)⫽ ␣
␣
⌫(␣)x
␣⫺1e⫺␣x,
an appropriate unequal rate matrix in their LRTs, fixed radical differences can contribute even stronger
evi-thereby leading to dence to the recognition of type II sites.
In general, phylogenetic errors are not expected to diminish greatly the power of the type II LRTs, since
P⬇ ␣ ␣
⌫(␣)
冮
∞r⫽0
r␣⫺1(e⫺r(lt⫺l0⫹␣)⫺e⫺r(lt⫹␣))dr.
their strongest support is obtained from fixed amino acid differences among subfamilies. By definition, these The integral can be calculated by
fixed differences will remain, even if lineages are shifted
冮
∞x⫽0
xae⫺bxdx⫽ ⌫(a⫹ 1)/ba⫹1, within subfamilies and the latter are rearranged (
Knud-senandMiyamoto2001). However, the power analysis
with l0 and lt serves as a reminder of the importance
thereby resulting in
of accurate branch lengths, particularly for the stems (Table 1). In this regard, phylogenetic errors may
indi-P⬇ ␣ ␣
⌫(␣)
冢
⌫(␣) (lt ⫺l0⫹ ␣)␣
⫺ ⌫(␣)
(lt⫹ ␣)␣
冣
rectly affect the type II LRTs by influencing the branchlength estimations.
⫽ ␣␣
(lt⫺ l0 ⫹ ␣)␣
⫺ ␣␣
(lt⫹ ␣)␣
. Availability of a computer program:A computer
pro-gram for the LRTs of types I and II and conserved sites is available as a web server at www.daimi.au.dk/ Varying the relative lengths of the stem for one CA
subfamilyvs.total phylogeny documents that power de- ⵑcompbio/LRTs.
creases with l0 and increases with lt (Table 1). Thus, power is maximized when the opportunity for a stem
RATE AND FUNCTIONAL ANALYSES OF
replacement is small, but that for a change within
sub-CARBONIC ANHYDRASES
families is large. This conclusion becomes important
when many sites of the protein have evolved as type CA I, II, and III:The CA family of ubiquitous enzymes
catalyzes the reversible hydration of CO2to bicarbonate
II positions. In these cases, phylogenetic methods will
overestimate the lengths of the stems and thereby lead and protons in many fundamental biological processes
(e.g., respiration and photosynthesis; Lindskog 1997;
to underestimates of the actual numbers of type II sites.
In contrast, this conclusion also indicates that an obvi- Chegwidden and Carter 2000). At least 15 CAs are
known in mammals, with each encoded by a different ous strategy to reducel0and thereby increase power is
to sample species that connect to the phylogeny along duplicate gene (Hewett-Emmett2000). Their diverse
lytic efficiencies, coupled with the successful develop- the local averages for their regions of the phylogeny (Knudsen and Miyamoto 2001; Pupko and Galtier
ment of a CA glaucoma drug, ensures that this family will
remain a primary target for biochemical, physiological, 2002). By relying on relative rates, changes in the local
averages due to varying demographic (e.g., population
structural, and pharmacological research.
Phylogenetic and linkage analyses indicate that CA I, size) and mutation/repair factors are compensated,
thereby allowing for functional interpretations of the II, and III form a related group within their
monophy-letic CA family, even though their tissue expression pat- significant sites (Gaucher et al. 2002). However, this
reliance on relative rates also reduces the ability of the
terns and CO2 hydration rates vary almost as much as
for all CAs (Hewett-EmmettandTashian1996;Lind- LRTs to detect large numbers of type I and II sites
that may be involved in a major overall change in the
skog1997;Hewett-Emmett2000). CA II remains the
primary reference for the family, because of its high function of a protein subfamily. In the case of duplicate
genes, this reduction can be addressed by focusing on catalytic efficiency and broad tissue expression. Its high
CO2hydration rate is related to its conserved H64 that the common species and branch points of the different
subfamilies. These shared species and nodes offer the functions as a highly effective intramolecular shuttle for
proton transfer from the zinc catalytic center to the common time points and uniform biological
back-grounds to compare the site-specific rates among sub-surrounding medium. CA II is also characterized by a
set of five or six H and K residues at its N terminus for families on a more absolute basis and without the
inter-ference of variable demographic and mutation/repair
Cl⫺/HCO⫺3 anion exchanger (AE1) binding for
bicar-bonate channeling from inside to outside the cell factors. In this way, the sensitivity of the LRTs is
en-hanced, along with the functional interpretability of (Vince et al.2000). This set of basic residues may also
contribute to the transfer of protons from H64 to the their statistically significant sites.
In the case of the CAs, this advantage of shared lin-bulk solvent (Brigantiet al.1997).
CA I and III are more restricted in their tissue expres- eages was accommodated by a constraint that required
the distances from the root to each common species
sions and their catalytic rates are ⵑ20% and ⬍1% of
that for CA II, respectively (Lindskog1997). In CA I, and node to be equal across subfamilies (Figure 4). The
branch lengths of the phylogeny were then estimated H64 is also conserved, but its set of basic residues at the
N terminus is greatly diminished (Brigantiet al.1997; with ML under the JTT model with the gamma
distribu-tion ( JTT ⫹ ⌫). As illustrated by the phylogeny, this
Vinceet al.2000). Thus, CA I cannot bind to AE1 and
its N terminus probably does not participate in proton constraint did not impose a molecular clock on the
analysis in the classical sense, since rates remained free shuttling. In light of its reduced, but significant CO2
hydration rate, CA I is thought to be a backup to CA to vary across other lineages. The JTT⫹ ⌫model was
significantly preferred over both the JTT and the JC⫹ ⌫ II. Conversely, the physiological role of CA III remains
unresolved. Its active site shows several important models (log likelihood decreases of 149.48 and 677.17,
respectively). changes (e.g., K or R at position 64) and its N-terminal
set of basic residues is reduced. In contrast, CA III Ten thousand sites were simulated underH2to
estab-lish the 5% cutoffs forH0,H1a, andH1b. These
simula-evolves slowly and comprises ⵑ8% and ⵑ25% of the
total soluble proteins in red skeletal muscle and adipose tions relied on the JTT⫹ ⌫model with␣set to its ML
value of 1.15 for the CAs. Ten thousand sites were also tissue, respectively. Collectively, these characteristics
suggest a major biological role for CA III, which is dis- simulated underH3(i.e., with a single rate equal to the
average for the entire protein) to determine the 5%
tinct from the standard CA function of reversible CO2
hydration. significance forH2. Finally, a set of 42 functionally
im-portant sites for CAs was defined according to the 36 CA sequences, phylogeny, and LRTs:To evaluate
fur-ther their functional similarities and differences, all positions of the active site and six basic residues of the
N terminus for AE1 binding and/or proton shuttling available sequences of CA I, II, and III were compiled,
aligned, and analyzed with the LRTs for rate change (Hewett-Emmett andTashian 1996;Brigantiet al.
1997;Vince et al.2000).
and conserved sites (Figure 3; Tashian et al. 1980;
ErikssonandLiljas1993;Hewett-EmmettandTas- Significant sites and functional interpretations: The LRTs for conserved sites recovered 47 positions that
hian1996). The final alignment consisted of 260
posi-tions for 11 CA I, 8 CA II, 6 CA III, and 5 CA Va were evolving significantly slower than the overall
aver-age for the entire protein (Figure 3). These 47 con-and Vb (outgroup) sequences. The accepted phylogeny
combined the CA gene tree from phylogenetic and link- served sites were concentrated among the 42
function-ally important positions (Table 2) and included the age analyses with the eutherian mammal phylogeny
from a recent molecular synthesis (Figure 4;Hewett- seven direct and indirect ligands to the zinc catalytic
center of the active site (Q92, H94, H96, E117, H119,
Emmett and Tashian 1996; Hewett-Emmett 2000;
Murphyet al.2001). T199, and N244;Hewett-EmmettandTashian1996;
Lindskog1997). Collectively, these results reconfirmed The standard approach in the LRTs is to measure the
Figure 3.—Multiple se-quence alignment for all 30 CAs. This alignment follows that of Hewett-Emmett
andTashian(1996). Sources
Figure 4.—Accepted phylogeny for the CAs. The distances from the root to identical species and ances-tors are fixed across subfamilies, as illustrated by the thin vertical lines. This constraint allows for the more direct interpretation of the site-spe-cific rates among subfamilies in terms of their absolute rather than relative differences (see text). Sites 1 and 121 are excluded from the branch length estimations, because of their gaps in
⬎25% of the sequences. Further-more, the CA Va and Vb outgroups are not constrained in these estima-tions, since they are included only to root the phylogeny. Sources for the 30 CAs are given in parentheses and include their GenBank (GB) and SWISS-PROT (SP) accession num-bers or original references for those sequences that are not available in the databases (Benson et al. 1999;
BairochandApweiler2000). In the
case of the pig CA III, this sequence is derived from an analysis of seven overlapping ESTs (GB AJ301094, AJ301207, AJ301290, AJ301337, AU059476, BF074991, and BI360558). BF074991 varied from AJ301337 and AJ301094 by one silent difference. In turn, the two terminal nucleotides of AJ301290 were ignored, since they differed from the corresponding identical bases of BI360558 and AJ301207.
important sites of proteins are under the strongest puri- therefore H4), shows a measurable decrease in AE1
fying selection and thereby evolve the slowest. binding (Vinceet al.2000). One obvious follow-up
ex-The LRTs for rate change sites identified 32, 10, and periment is to retest the AE1 binding of a site-directed
2 type I, II, and I/II positions, respectively (Figure 3). CA II mutant after the replacement of its H4 with acidic
The expected numbers of type I, II, and I/II sites were D or E (GoldingandDean1998).
11.8, 11.7, and 2.9 according to the simulations, respec-tively. Thus, almost three times as many type I sites were
recovered as expected by chance. The 32 type I sites DISCUSSION
included position 64, with its fixed H in CA I and II
Functional predictions for CA III:Available
biochemi-vs. variable R and K in CA III (Hewett-Emmett and
cal, mutagenic, and structural information defines a
Tashian1996;Lindskog1997).
series of sites that are of known importance to the com-Despite their near equal observed to expected
fre-mon and unique functions of CAs. The ability of the quencies, further analyses validated the importance of
LRTs to detect these known sites, as demonstrated both the type II sites to the greater understanding of CA
collectively (Table 2) and individually (e.g., H4, H64, functional divergence. The 44 type I and/or II sites
and the seven direct and indirect ligands to the zinc were concentrated among the 42 functionally important
catalytic center), validates their utility for both testing positions (Table 2). However, this significance
de-existing hypotheses and generating new ones. In the pended on the recognition of both divergences, since
case of CA III, these LRTs, in combination with
bio-Pbecameⵑ0.20 when the 10 type II sites were instead
chemical, structural, and other bioinformatic informa-counted among the “other positions.” Thus, type II
di-tion, support a distinct role for this enigmatic isozyme. vergence complements type I change and both
pro-In CA III, C183 and C188 are unique surface residues cesses must be considered in evolutionary studies of
that are known binding targets for glutathione (GSH;
protein function (Gu2001).
Figures 3 and 5). CA III is among the first proteins to Of the 10 type II sites, 4 mapped to functionally
impor-be glutathiolated during oxidative stress and a mutant tant positions (Figure 3). These 4 type II sites
empha-cell line that is deficient for this isozyme is particularly sized fixed radical differences among the subfamilies
sensitive to oxyradical insults (Chai et al.1994;
Ra¨isa¨-within two primary functional regions of CAs. For
exam-nenet al.1999). Thus, CA III is hypothesized to function ple, type II site 4 highlighted the fixed radical difference
as an oxyradical scavenger, whereby glutathiolation pro-of H in CA II against the acidic D and E in CA I and
tects its C183 and C188 from irreversible oxidation. In III. H4 of CA II is one of the five or six basic residues
support of an antioxidant defense role, the LRTs re-at its N terminus for AE1 binding. A truncre-ation mutant
TABLE 2
Distributions of conserved and type I and/or II sites among the CAs
Functionally
important Other
positions positions Totals
A.
Conserved sites 13 (6.7) 34 (40.3) 47
Other sites 18 (24.3) 151 (144.7) 169
Totals 31 185 216
B.
Type I and/or II sites 11 (6.0) 33 (38.0) 44
Other sites 18 (23.0) 151 (146.0) 169
Totals 29 184 213
Type I and/or II sites are not included in A, whereas
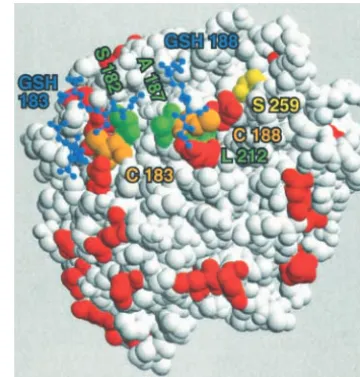
con-Figure5.—Spacefill model of the tertiary structure for rat
served positions are conversely excluded from B. Expected
CA III with bound GSH (Protein Data Bank accession no. counts are given in parentheses. Functionally important
posi-1FLJ), as rendered with RasMol (Sayle andMilner-White
tions refer to the 42 residues of the active site and N terminus
1995;Bermanet al.2000;Malliset al.2000). This view focuses for AE1 binding and/or proton shuttling. The chi-square tests
on the key residues around C183 and C188, with both alterna-for both contingency tables are significant (P⫽ 0.005 and
tive conformations of GSH183 shown. Acidic D and E residues 0.017, respectively).
are red.
underneath C183 and C188 (positions 182/187 and ple testing and reduced power are thereby avoided, this
212, respectively). At these three type I and I/II sites, fixation limits the analyses to predefined groups (see
CA III is slowly evolving in contrast to the more variable below). The performance of the type II Bayesian
CA I or II. The conserved or nearly conserved residues method has not yet been studied with real or simulated
of CA III at these rate change sites may contribute to data nor is it currently implemented in a computer
the greater surface exposure and weaker acidic sur- program for general distribution (e.g., DIVERGE; Gu
roundings that enhance GSH binding at C188 over that andVander Velden2002). Further comparisons of the
at C183 (Malliset al.2000). type II LRTs and Bayesian method await the
implemen-Interestingly, S259, which lies close to C188 at the tation, testing, and application of a generally available
surface (Figure 5), is a potential phosphorylation site computer program for the latter.
according to NetPhos (an artificial neural network algo- As for their Bayesian counterparts, the type I and II
rithm;Blomet al.1999). The score for conserved S259 LRTs are designed for the study of functional
diver-being a phosphorylation site is 0.995 (out of 1.000) for gence among protein subfamilies that are clearly
dis-tinct according to available biochemical, structural, and every CA III, except for that of cow (0.928). Thus, S259
phylogenetic information (e.g., CA I, II, and III; Gu
phosphorylation/dephosphorylation may affect C188
1999, 2001;KnudsenandMiyamoto2001;Pupkoand
glutathiolation or vice versa. Through these reversible
Galtier 2002). In turn, nonsynonymous-to-synony-covalent modifications, CA III may then function as a
mous rate tests using coding DNAs allow for the detec-sensor of oxidative stress, whose activity is tied to the
tion of functional change among the more closely
re-signaling pathways for antioxidant defense (Ra¨isa¨nen
lated members of each subfamily (Hughes 1999;Nei
et al.1999;ChegwiddenandCarter2000).
and Kumar 2000; Yang and Bielawski 2000). Thus, Future studies:The only other likelihood-based
pro-as the two approaches are complementary, both are
cedure for type II sites is the Bayesian method (Gu
recommended for more comprehensive studies of func-2001). This method calculates separate
gamma-distrib-tional divergence and conservation between and within uted rates for the subfamily stemsvs.crown groups (i.e.,
protein subfamilies. most recent common ancestors and their descendants
of the subfamilies) and then tests for the independence We thank A. C. Harmon, R. L. Levine, and M. R. Tennant for their comments about our research. This study was supported by National
of these estimates by their site-specific posterior
proba-Institutes of Health grant GM25154 (P.J.L. and D.N.S.) and by funds
bilities. This separate treatment of the subfamily stems
from the Department of Zoology, University of Florida.
vs.crown groups and incorporation of the gamma
pro-cess contrasts with the use of whole phylogenies and
distribution-free rate estimates by the type II LRTs. In LITERATURE CITED
turn, the current and Bayesian methods share the
as-Bairoch, A., andR. Apweiler, 2000 The SWISS-PROT protein
se-sumption of a fixed point for potential functional diver- quence database and its supplement TrEMBL in 2000. Nucleic
Acids Res.28:45–48.
multi-Benson, D. A., M. S. Boguski, D. J. Lipman, J. Ostell, B. F. Ouel- generation of mutation data matrices from protein sequences. Comput. Appl. Biosci.8:275–282.
letteet al., 1999 GenBank. Nucleic Acids Res.27:12–17.
Jukes, T. H., andC. R. Cantor, 1969 Evolution of protein mole-Berman, H. M., J. Westbrook, Z. Feng, G. Gilliland, T. N. Bhatet
cules, pp. 21–123 inMammalian Protein Metabolism, edited by H. N.
al., 2000 The protein data bank. Nucleic Acids Res.28:235–242.
Munro. Academic Press, New York. Blom, N., S. Gammeltoftand S. Brunak, 1999 Sequence- and
Kimura, M., 1983 The Neutral Theory of Molecular Evolution. Cam-structure-based prediction of eukaryotic protein phosphorylation
bridge University Press, Cambridge, UK. sites. J. Mol. Biol.294:1351–1362.
Knudsen, B., andM. M. Miyamoto, 2001 A likelihood ratio test Briganti, F., S. Mangani, P. Orioli, A. Scozzafava, G. Vernaglione
for evolutionary rate shifts and functional divergence among
et al., 1997 Carbonic anhydrase activators: X-ray crystallographic
proteins. Proc. Natl. Acad. Sci. USA98:14512–14517. and spectroscopic investigations for the interaction of isozymes
Landgraf, R., I. XenariosandD. Eisenberg, 2001 Three-dimen-I and Three-dimen-IThree-dimen-I with histamine. Biochemistry36:10384–10392.
sional cluster analysis identifies interfaces and functional residue Chai, Y. C., S. HendrichandJ. A. Thomas, 1994 Protein S-thiolation
clusters in proteins. J. Mol. Biol.307:1487–1502. in hepatocytes stimulated by t-butyl hydroperoxide, menadione,
Li, W.-H., 1997 Molecular Evolution. Sinauer, Sunderland, MA. and neutrophils. Arch. Biochem. Biophys.310:264–272.
Lindskog, S., 1997 Structure and mechanism of carbonic anhy-Chegwidden, W. R., andN. D. Carter, 2000 Introduction to the
drases. Pharmacol. Ther.74:1–20. carbonic anhydrases, pp. 13–28 inThe Carbonic Anhydrases: New
Livingstone, C. D., andG. J. Barton, 1996 Identification of
func-Horizons, edited by W. R.Chegwidden, N. D.Carterand Y. H.
tional residues and secondary structure from protein multiple Edwards. Birkha¨user Verlag, Basel, Switzerland. sequence alignment. Methods Enzymol.266:497–512. Dermitzakis, E. T., andA. G. Clark, 2001 Differential selection Lynch, M., and A.Force, 2000 The probability of duplicate gene
after duplication in mammalian developmental genes. Mol. Biol. preservation by subfunctionalization. Genetics154:459–473. Evol.18:557–562. Mallis, R. J., B. W. Poland, T. K. Chatterjee, R. A. Fisher, S. Eriksson, A. E., andA. Liljas, 1993 Refined structure of human Darmawanet al., 2000 Crystal structure of S-glutathiolated
car-carbonic anhydrase II at 2.0 A˚ resolution. Proteins16:29–42. bonic anhydrase III. FEBS Lett.482:237–241.
Felsenstein, J., 1981 Evolutionary trees from DNA sequences: a Murphy, W. J., E. Eizirik, S. J. O’Brien, O. Madsen, M. Scallyet maximum likelihood approach. J. Mol. Evol.17:368–376. al., 2001 Resolution of the early placental mammal radiation Gaucher, E. A., M. M. MiyamotoandS. A. Benner, 2001 Function- using Bayesian phylogenetics. Science294:2348–2351.
structure analysis of proteins using covarion-based evolutionary Nei, M., andS. Kumar, 2000 Molecular Evolution and Phylogenetics. approaches: elongation factors. Proc. Natl. Acad. Sci. USA98: Oxford University Press, New York.
548–552. Nei, M., X. GuandT. Sitnikova, 1997 Evolution by the birth-and-Gaucher, E. A., X. Gu, M. M. MiyamotoandS. A. Benner, 2002 death process in multigene families of the vertebrate immune
Detecting functional divergence in protein evolution by site-spe- systems. Proc. Natl. Acad. Sci. USA94:7799–7806.
Ohno, S., 1970 Evolution by Gene Duplication. Springer-Verlag, Berlin. cific rate shifts. Trends Biochem. Sci.27:315–321.
Pupko, T., andN. Galtier, 2002 A covarion-based method for de-Golding, G. B., andA. M. Dean, 1998 The structural basis of
molec-tecting molecular adaptation: application to the evolution of ular adaptation. Mol. Biol. Evol.15:355–369.
primate mitochondrial genomes. Proc. R. Soc. Lond. Ser. B269:
Gu, X., 1999 Statistical methods for testing functional divergence
1313–1316. after gene duplication. Mol. Biol. Evol.16:1664–1674.
Ra¨isa¨nen, S. R., P. Lehenkari, M. Tasanen, P. Rahkila, P. L. Ha¨rko¨ -Gu, X., 2001 Maximum-likelihood approach for gene family
evolu-nenet al., 1999 Carbonic anhydrase III protects cells from hy-tion under funchy-tional divergence. Mol. Biol. Evol.18:453–464.
drogen peroxide-induced apoptosis. FASEB J.13:513–522. Gu, X., andK. Vander Velden, 2002 DIVERGE: phylogeny-based
Sayle, R., and E. J. Milner-White, 1995 RasMol: biomolecular analysis for functional-structural divergence of a protein family.
graphics for all. Trends Biochem. Sci.20:374. Bioinformatics18:500–501.
Tashian, R. E., D. Hewett-Emmett, S. K. Stoup, M. Goodmanand Hewett-Emmett, D., 2000 Evolution and distribution of the
car-Y.-S. L. Yu, 1980 Evolution of structure and function in the bonic anhydrase gene families, pp. 29–76 inThe Carbonic
Anhy-carbonic anhydrase isozymes of mammals, pp. 165–176 in Biophys-drases: New Horizons, edited by W. R.Chegwidden, N. D.Carter
ics and Physiology of Carbon Dioxide, edited by C.Bauer, G.Gros and Y. H.Edwards. Birkha¨user Verlag, Basel, Switzerland.
and H.Bartels. Springer-Verlag, Berlin. Hewett-Emmett, D., andR. E. Tashian, 1996 Functional diversity,
Vince, J. W., U. CarlssonandR. A. Reithmeier, 2000 Localization conservation, and convergence in the evolution of the alpha-, of the Cl⫺/HCO⫺
3 anion exchanger binding site to the amino-beta-, and gamma-carbonic anhydrase gene families. Mol. Phylo- terminal region of carbonic anhydrase II. Biochemistry 39: genet. Evol.5:50–77. 13344–13349.
Huelsenbeck, J. P., andB. Rannala, 1997 Phylogenetic methods Yang, Z., 1996 Among-site rate variation and its impact on phyloge-come of age: testing hypotheses in an evolutionary context. Sci- netic analyses. Trends Ecol. Evol.11:367–372.
ence276:227–232. Yang, Z., andJ. P. Bielawski, 2000 Statistical methods for detecting Hughes, A. L., 1999 Adaptive Evolution of Genes and Genomes. Oxford molecular adaptation. Trends Ecol. Evol.15:496–503.
University Press, New York.