R E S E A R C H A R T I C L E
Open Access
Optimization of a high-throughput whole blood
expression profiling methodology and its
application to assess the pharmacodynamics
of interferon (IFN) beta-1a or polyethylene
glycol-conjugated IFN beta-1a in healthy clinical
trial subjects
Normand E Allaire
1,2*, Steven E Bushnell
1, Jadwiga Bienkowska
1, Graham Brock
1and John Carulli
1Abstract
Background:Clinical trials offer a unique opportunity to study human disease and response to therapy in a highly controlled setting. The application of high-throughput expression profiling to peripheral blood from clinical trial subjects could facilitate the identification of transcripts that function as prognostic or diagnostic markers of disease or treatment. The paramount issue for these methods is the ability to produce robust, reproducible, and timely mRNA expression profiles from peripheral blood. Single-stranded complementary DNA (sscDNA) targets derived from whole blood exhibit improved detection of transcripts and reduced variance as compared to their
complementary RNA counterparts and therefore provide a better option for interrogation of peripheral blood on oligonucleotide arrays. High-throughput microarray technologies such as the high-throughput plate array platform offer several advantages compared with slide- or cartridge-based arrays; however, manufacturer’s protocols do not support the use of sscDNA targets.
Results:We have developed a highly reproducible, high-through put, whole blood expression profiling
methodology based on sscDNA and used it to analyze human brain reference RNA and universal human reference RNA samples to identify experimental conditions that most highly correlated with a gold standard quantitative polymerase chain reaction reference dataset. We then utilized the optimized method to analyze whole blood samples from healthy clinical trial subjects treated with different versions of interferon (IFN) beta-1a. Analysis of whole blood samples before and after treatment with intramuscular [IM] IFN beta-1a or polyethylene
glycol-conjugated IFN (PEG-IFN) beta-1a under optimized experimental conditions demonstrated that PEG-IFN beta-1a induced a more sustained and prolonged pharmacodynamic response than unmodified IM IFN beta-1a. These results provide validation of the utility of this new methodology and suggest the potential therapeutic benefit of a sustained pharmacodynamic response to PEG-IFN beta-1a.
Conclusions:This novel microarray methodology is ideally suited for utilization in large clinical studies to identify expressed transcripts for the elucidation of disease mechanisms of action and as prognostic, diagnostic,
or toxicity markers.
* Correspondence:[email protected]
1Biogen Idec Inc., Genetics and Genomics Group, 14 Cambridge Center,
Cambridge, MA 02142, USA
2Biogen Idec Inc., Translational Medicine Department, 14 Cambridge Center,
Cambridge, MA 02142, USA
Background
The study of the blood transcriptome in the context of clinical pharmacogenomics has generated much interest in recent years [1,2]. The cellular and molecular compo-nents of peripheral blood exhibit dynamic responsive-ness to physiological, environmental, or pathological stimuli and are in contact with nearly every tissue in the body, allowing for assessment of systemic responses to disease or treatment. As such, peripheral blood is a source of clinically accessible diagnostic, prognostic and pharmacodynamic (PD) markers [3,4]. This idea is sup-ported by a growing body of research that describes the identification of expressed transcripts from human and animal peripheral blood that can function as indicators of disease, as prognostic markers of clinical outcome, of risk of toxicity, and as evidence of a therapy’s pharmaco-dynamic effects [5-8].
The successful use of gene expression microarrays in basic research studies has spawned great interest in the application of this technology to large clinical pharmaco-genomics and population-based studies [9-11]. However, microarray cost, the complexity of sample processing and tracking, and practical limitations in sample throughput have restricted its utilization in clinical investigations [12,13]. Microarray manufacturers have responded to these needs with the recent development of higher-throughput solutions such as the high-higher-throughput (HT) plate array or “array of arrays” [14]. This platform was made possible through reduction and optimization of probe content and advances in photonics, collectively en-abling the miniaturization and assembly of 96 arrays into the spatial arrangement of a conventional microtiter plate. Our laboratory’s internal validation studies have confirmed that data from the HT plate array platform is highly con-cordant to that of industry standard cartridge arrays [15].
RNA is often amplified using T7 RNA polymerase-driven
in vitrotranscription (IVT) [16] to produce complementary RNA (cRNA) targets for hybridization to microarrays. However, the high concentration of hemoglobin transcripts in peripheral blood can induce a globin interference effect, effectively reducing a microarray’s detection sensitivity and increasing its signal variability [17]. Although effective methods have been developed to reduce globin interference [18-20], current methods of mitigation also induce variance in microarray results [21].
The challenges associated with utilizing cRNA targets from peripheral blood as probes for microarray investiga-tions have led to the development of alternative methods of amplification and the use of single-stranded comple-mentary DNA (sscDNA) targets from peripheral blood for microarray hybridization [22,23], effectively improving the sensitivity of microarray hybridizations for detecting per-ipheral blood transcripts. Results from our laboratory’s in-ternal benchmarking experiments analyzing peripheral
blood samples have verified that sscDNA targets improve microarray sensitivity and decrease signal variance as com-pared with cRNA targets analyzed using globin blocking, degradation, and depletion methods (data not shown).
In the current study, we have systematically optimized sscDNA/HT plate array target mass, hybridization para-meters and washing parapara-meters using 2 highly charac-terized test RNAs with the goal of developing a HT methodology for whole blood transcriptional profiling. Comparative analysis of optimization data against peer-reviewed expression array [15] and quantitative polymer-ase chain reaction (qPCR) [24] datpolymer-asets were used to select conditions that improved assay reproducibility and sensi-tivity. The utility of this new array method (BIIB_HT) was also confirmed through analyses of whole blood samples from a clinical trial comparing pharmacodynamic changes following dosing with either interferon (IFN) beta-1a or polyethylene glycol-conjugated IFN (PEG-IFN) beta-1a.
Results
Relative variable effect
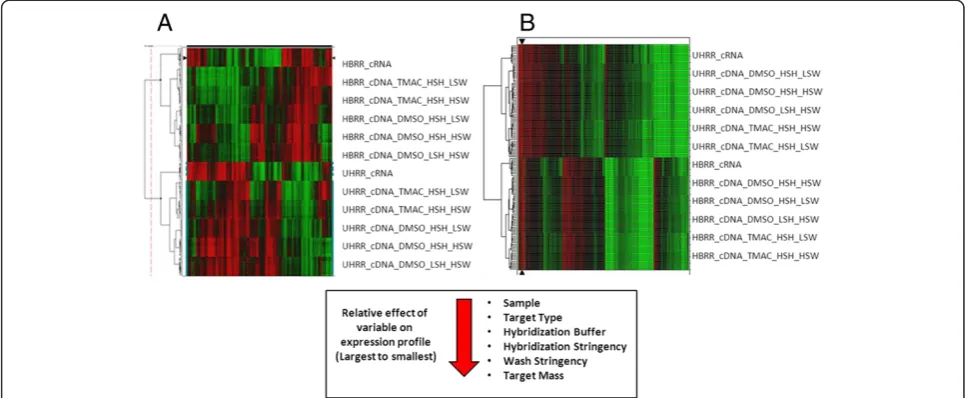
(LODS) greater than zero and fold change greater than 2.0 were considered significantly different. This filtering method reduced the number of qualifiers from 13898 to 7128. The remaining 7128 qualifiers were then clustered by single linkage using a Euclidean distance measure or correlation (Figure 1B).
The results from both clustering approaches revealed the significant effect of the experimental conditions on gene expression. Using the derived dendrogram, the relative effects of each condition were ordered from largest to smal-lest accordingly: sample type > target type > hybridization buffer > hybridization stringency > wash stringency > target mass. Interestingly, target type was second only to sample type in its relative effect on hybridization.
Global quality assessment
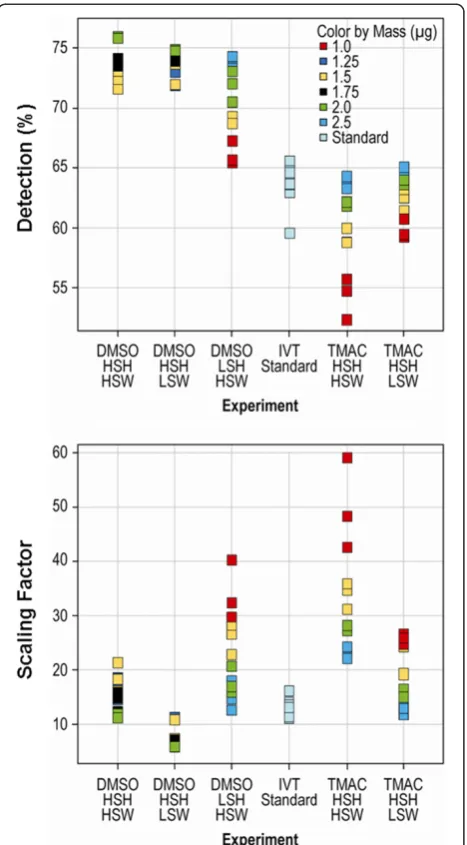
Initial scan quality was assessed using 2 metrics: the per-centage of qualifiers above the background (percent present), and the scaling factor (SF) that was used to adjust the median intensity of the array to a predefined target value. Higher percentages present and lower scaling factors were well correlated with overall scan quality (Figure 2). Results showed that DMSO/sscDNA hybridizations gener-ally resulted in significantly more qualifiers categorized as present than either cRNA or sscDNA targets in native HT TMAC hybridizations (p= 4.3 × 10⁻²³andp= 1.12 × 10⁻²³, respectively), with the sscDNA target mass positively cor-related with the percentage present score. Of all DMSO conditions tested, DMSO_HSH_HSW resulted in the
highest percentage of qualifiers scored as present, although this percentage was only marginally more than that for DMSO_HSH_LSW (p= 0.036). Scaling factor scores for DMSO and TMAC hybridizations were not as well defined. Scaling factors were lowest for sscDNA targets in DMSO_HSH_LSW as compared with all other conditions; however, the lowest scaling factors were produced by sscDNA targets hybridized and washed under the condi-tions of TMAC_HSH_HSW. As expected, sscDNA target mass was found to be negatively correlated with its scaling factor score.
Normalized, unscaled standard error (NUSE) plots allow for an assessment of variance within an array and for determination of the array’s relationship to a group of arrays [27]. Analysis of cRNA targets hybridized under native HT conditions resulted in the largest rela-tive error among all intra-array and inter-array errors (Figure 3). Conversely, DMSO hybridization resulted in a lower relative error than any native TMAC conditions, with the lowest inter-array and intra-array error pro-duced using sscDNA targets and the hybridization con-ditions of DMSO_HSH_LSW.
Data analysis to identify optimal assay conditions
[image:3.595.56.540.90.289.2]The principal component analysis (PCA) method, which reduces the dimensionality of large data sets and allows visualization of the overall data structure, was used to identify experimental HT array hybridization conditions that produced results that were most highly correlated
with a gold standard qPCR reference dataset [24]. PCA identified a total of 164 sscDNA qualifier transcripts that changed at least 1.5-fold (p= 0.0001) between HBRR and UHRR samples under one of the experimental condi-tions and that were also present in the qPCR reference dataset. These qualifiers showed a clear separation in clustering between DMSO and TMAC hybridization cocktails (Figure 4). Furthermore, within each cocktail cluster, there was a substructure defined by hybridization and washing stringency that consisted of the all target masses. The qPCR reference clustered most closely with the hybridization conditions of DMSO_HSH_LSW (Figure 4) and these conditions were selected for use with subsequent analyses.
Detection and differential expression of whole-blood mRNAs encoding IFN beta-1a biological response genes
[image:4.595.58.292.88.511.2]It has been well established that parenteral administra-tion of IFN beta induces a robust response in systemic gene expression [28]. In order to confirm the utility of this new BIIB_HT method, the optimized assay was uti-lized for analysis of peripheral blood samples collected as part of a phase 1 clinical dose- and route-finding study [29]. In this study, a single intramuscular (IM) in-jection of unmodified IFN beta-1a 30 μg was adminis-tered and peripheral blood samples were collected predose and at 6 hours and 48 hours postdose. Results showed strong transcript induction at 6 hours (1,398 probe sets, logarithm [base 10] of odds [LOD] score > 0, ±1.5-fold change), with many transcripts returning to pretreatment levels within 48 hours (110 probe sets, LOD score > 0, ±1.5-fold change). A list of the transcripts
[image:4.595.304.538.89.248.2]Figure 2Global scan quality.Addition of the cDNA probe in a DMSO buffer increases detection of expressed transcripts.
Figure 3Standard error plot.The conditions DMSO HSH_LSW yielded the smallest variance in assay results and was selected as the preferred sample processing methodology.
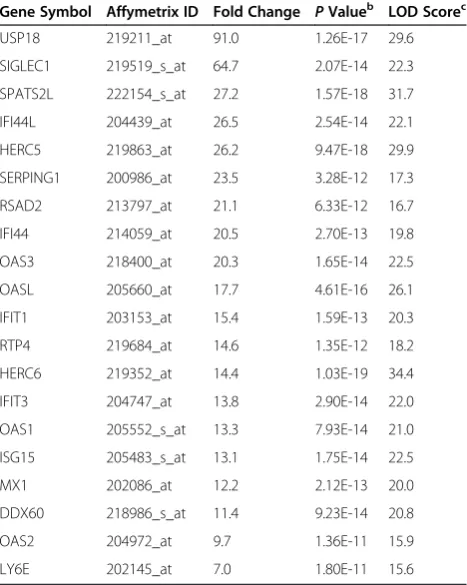
[image:4.595.306.539.520.704.2]most commonly upregulated following IFN beta-1a treat-ment is presented in Table 1. Transcript analysis showed a strong induction of several canonical cell signaling path-ways at 6 hours post treatment, including both previously reported and novel candidate pharmacodynamic markers of IFN response. Induced pathways included those involved in IFN signaling, bacterial and virus pattern recognition receptors, IFN regulatory factors, cytoplasmic pattern rec-ognition receptors involved in IFN regulatory factor signal-ing, and regulation of cytotoxic T lymphocyte-mediated apoptosis (Additional file 1).
PEGylation modifies the kinetics of IFN beta-1a transcriptional response in healthy subjects
To further demonstrate the practical utility of this new methodology, we next compared the peripheral blood tran-scriptional response with native IM IFN beta-1a versus PEG-IFN beta-1a in healthy subjects. Healthy volunteers were administered a single dose of IFN beta-1a (30 μg given IM) or PEG-IFN beta-1a (63μg given IM or subcuta-neously [SC]). For comparison of responses to the 2 drugs,
composite IFN beta induction scores were calculated from the geometric mean of the normalized intensities of the top 20 induced transcripts at 6 hours post-dose (Table 1). Results showed significant differences between IFN beta-1a and PEG-IFN beta-1a in their induction scores at 6 and 48 hours post-dose (Figure 5), indicating that the up-regulation of IFN-responsive transcripts was longer follow-ing dosfollow-ing with PEG-IFN beta-1a than with IFN beta-1a.
Discussion
Peripheral blood transcriptional expression profiling is an attractive technology for large pharmacogenomics studies. However, there have been technical limitations to generating robust transcriptional profiles from this important tissue. Although microarray technologies have been standardized and miniaturized to allow much lar-ger numbers of samples to be processed in parallel than was previously possible from tissues and cell lines, there are few robust methods to utilize these highly parallel profiling technologies for the analysis of large numbers of peripheral blood samples. Therefore, development of new methodologies that enable the reproducible gener-ation of expression profiles from thousands of patient blood samples are of paramount importance to transla-tional research.
[image:5.595.57.291.381.674.2]We report the development and validation of a highly sensitive and reproducible HT whole blood expression pro-filing methodology, designated BIIB_HT. This methodology Table 1 Whole blood transcripts most frequently
upregulated by IFN beta-1aa
Gene Symbol Affymetrix ID Fold Change PValueb LOD Scorec
USP18 219211_at 91.0 1.26E-17 29.6
SIGLEC1 219519_s_at 64.7 2.07E-14 22.3
SPATS2L 222154_s_at 27.2 1.57E-18 31.7
IFI44L 204439_at 26.5 2.54E-14 22.1
HERC5 219863_at 26.2 9.47E-18 29.9
SERPING1 200986_at 23.5 3.28E-12 17.3
RSAD2 213797_at 21.1 6.33E-12 16.7
IFI44 214059_at 20.5 2.70E-13 19.8
OAS3 218400_at 20.3 1.65E-14 22.5
OASL 205660_at 17.7 4.61E-16 26.1
IFIT1 203153_at 15.4 1.59E-13 20.3
RTP4 219684_at 14.6 1.35E-12 18.2
HERC6 219352_at 14.4 1.03E-19 34.4
IFIT3 204747_at 13.8 2.90E-14 22.0
OAS1 205552_s_at 13.3 7.93E-14 21.0
ISG15 205483_s_at 13.1 1.75E-14 22.5
MX1 202086_at 12.2 2.12E-13 20.0
DDX60 218986_s_at 11.4 9.23E-14 20.8
OAS2 204972_at 9.7 1.36E-11 15.9
LY6E 202145_at 7.0 1.80E-11 15.6
a
Results are from whole blood samples collected from healthy volunteers 6 hours post-dose with 30μg IM IFN beta-1a. A composite IFN beta induction score was calculated from the geometric mean of the LOD score intensities of the top 20 transcripts.
b
Values were calculated using F-tests within the software package BRB Array Tools.
c
[image:5.595.306.539.438.673.2]LOD score, logarithm (base 10) of odds score.
can be utilized in conjunction with clinical studies to iden-tify expressed transcripts that may be useful for elucidating drug or disease mechanisms of action, or that can function as prognostic, diagnostic, or toxicity markers. This method was applied to the analysis of whole blood samples col-lected from healthy clinical trial subjects before and after treatment with a single dose of either IM IFN beta-1a or SC or IM PEG-IFN beta-1a. Study results demonstrate that PEG-IFN beta-1a induces a more sustained and prolonged pharmacodynamic response than unmodified IFN beta-1a. These results provide validation of the utility of this new methodology and support potential therapeutic benefits of PEG-IFN beta-1a.
The BIIB_HT method is unique in that it has been opti-mized specifically to provide the most robust detection of transcripts from 96 peripheral blood samples in parallel. It can be used to analyze peripheral blood samples from large clinical studies in order to identify expressed transcripts that may be useful for elucidating disease and therapeutic mechanisms of action, as well as for the identification and validation of prognostic, diagnostic, or toxicity markers. BIIB_HT generates sscDNA targets using OvationW (NuGEN Technologies, San Carlos, CA) amplification technology and has been optimized to provide the max-imum sensitivity and specificity when used in combination with the HTA plate array platform from Affymetrix (Santa Clara, CA). sscDNA targets were selected as the amplifica-tion moiety for the development of blood profiling meth-odologies based on internal benchmarking experiments (data not shown) and published reports [21,22]. Because there are currently no reports describing the validation of sscDNA targets for use with the HTA array platform, a sys-tematic optimization was required. Specifically, hybridization and washing conditions and mass/array parameters were optimized using 2 RNA samples from the MicroArray Quality Control (MAQC) project to identify conditions yielding maximum detection and lowest variance sscDNA targets [24]. The current results were referenced against native HTA plate array conditions as well as independent qPCR published results.
TMAC is the native HTA plate array hybridization buf-fer used with cRNA probes. It has been shown to stabilize adenine-thymine (AT) base pairs (bp) and minimize the effect of base composition on oligonucleotide hybridiza-tions of up to 200 bp. The TMAC hybridization buffer ef-fectively equalizes the melting points of different probes therefore allowing probes with different nucleotide com-positions to be hybridized under identical conditions [30,31]. On the other hand, sscDNA hybridizations on glass slide or cartridge arrays typically utilize a 10% DMSO-based buffer. In the presence of DMSO, denatured DNA has been shown to renature with homologous DNA and is not retained by the substrate, thereby reducing the occurrence of background signals [32]. In the current study,
the assay results for TMAC-based versus DMSO-based hybridizations were markedly different. Hybridization chem-istry (DMSO or TMAC buffer) influenced hybridization quality, as indicated by its ranking as the third most im-portant factor impacting assay results after target type and sample type (Figure 1). In general, use of TMAC-based hybridizations with sscDNA probes produced lower num-bers of detectable transcripts and higher background sig-nals across the various masses tested (Figure 2). Given these data, the DMSO-based hybridization buffer was su-perior to the TMAC-based buffer when sscDNA targets were used in conjunction with the HTA platform.
When assessing possible errors induced as a function of experimental variables, NUSE plots are useful for graphical assessment of array quality. With this method, standard error estimates for each probe set are normal-ized to a median value of 1 across all arrays. Box plot representation of NUSE values are then drawn for each array and comparative analysis can be conducted for the entire dataset. Arrays or sets of arrays with a larger spread are determined to be of higher variance and are therefore of lower quality. Based on the NUSE plots, use of DMSO buffer with HSH and LSW conditions gener-ated the most reproducible data (Figure 3). Interestingly, mass type and sample type did not strongly influence assay results. These observations may stem from a mask-ing effect due to averagmask-ing across sample types. Never-theless, DMSO was clearly superior to TMAC for use with sscDNA targets on an HT array.
Finally, a PCA in fold change space was used to assess correlations between the variable conditions tested and a
“gold standard” qPCR reference dataset. In an effort to normalize all comparisons, qualifiers were selected that were present in the qPCR reference set, changed at least 1.5-fold between HBRR and UHRR datasets, and had a
p-value of≤0.0001 in any of the conditions tested. This strategy would allow for penalization of any assay condi-tions generating a false call as well as for benefiting con-ditions resulting in a correct call. Results showed a clear difference between DMSO and TMAC, with each buffer condition isolated to distinct clusters. Interestingly, the use of DMSO with LSH, HSW, and 2μg of sscDNA pro-duced results that clustered most closely with the qPCR reference set (Figure 4). Additionally, these optimized conditions markedly outperformed the standard cRNA/ HT array hybridization conditions (black data point), suggesting that the methods reported here represent a significant improvement over the current technology. As with the other analyses that were performed, of all the variables tested, the mass of sscDNA for each array had the smallest effect.
a clinical trial evaluating administration of IFN beta-1a or PEG-IFN beta-1a to healthy subjects. Human IFN beta-1a is a first-line therapy for patients with relapsing forms of multiple sclerosis (MS). In multiple clinical trials and long-term observational studies, IFN beta-1a has been shown to reduce the development of MS-associated brain magnetic resonance imaging (MRI) lesions, reduce clinical relapse rates, and slow the advancement of physical dis-ability [33-35]. PEG-IFN beta-1a is being developed with the aim of providing a treatment option that is at least as safe and effective as current first-line therapies, but with the added benefits of less frequent dosing and improved convenience. IFN beta-1a was PEGylated by the attach-ment of a 20 kDa methoxy-PEG-O-2-methylpropionalde-hyde to the α-amino group of the N-terminus of IFN beta-1a, a site that is not critical for binding to the type 1 IFN receptor [36,37].
Previous pharmacokinetic studies have shown that after a single parenteral injection, PEG-IFN beta1-a was detect-able in peripheral blood after 7 days as compared with 2 days with unmodified IFN beta-1a [29]. This increased drug exposure was accompanied by enhanced and sus-tained expression of the pharmacodynamic IFN biomar-kers 20,50-oligoadenylate synthetase and neopterin. We sought to verify if the transcriptional response would re-flect previous observations of a sustained and prolonged pharmacodynamic response to PEG-IFN beta-1a as com-pared with IFN beta-1a using BIIB_HT assay.
We observed a peak median induction score of 11 at 6 hours post IFN beta1-a dosing. A p-value of 0.007 was calculated by comparison of the IFN induction scores of the 2 groups at 6 hours post dose (Student’s t test). As expected, at 48 hours post-dose the induction score of sub-jects treated with IFN beta1-1a had declined to 10 while the subjects that received PEG-IFN beta-1a reached a peak Interferon induction score of 11. Again, the p-value that was calculated between the induction scores of the 2 groups was statistically significant (p= 0.00001). These transcriptional data reflect the previously reported transla-tional sustained pharmacodynamic response observed with PEG-IFN beta-1a.
Conclusions
The application of HT microarray technologies to large clinical pharmacogenomics studies represents a unique opportunity to discover prognostic and predictive markers of efficacy and safety on a genome scale. These studies allow a greater understanding of the variable expression of the human transcriptome in response to therapy in a highly controlled setting. A barrier to the execution of these studies is the ability to produce mRNA expression profiles from peripheral blood in a reproducible and robust manner. We believe that the methods presented in this report support the use of HT genome scale expression
analysis for biomarker discovery from whole blood sam-ples derived from large clinical trials.
Methods
Experimental design
To eliminate confounding factors associated with labeling variances, sscDNA targets were generated in bulk from the highly characterized control RNAs HBRR and UHRR. Following labeling, sscDNAs were hybridized to HT-HGU133A plate arrays using different masses under vary-ing hybridization and washvary-ing conditions. These data were used for comparative analyses between the different hybridization conditions as well as against historical HBRR/UHRR cRNA HT array“Genomics”data and 1000 gene“MAQC”qPCR reference data sets to identify optimal hybridization conditions that both maximize detection of rare transcripts and minimize hybridization variance.
HBRR and UHRR sscDNA target masses were titrated from 1.0-2.5 μg/array in DMSO or native TMAC hybridization buffer. Hybridization Stringency was con-trolled using temperature. High Stringency Hybridizations (HSH) or Low Stringency Hybridizations were conducted at 48-50°C or 41-43°C respectively. Washing stringency was controlled by adjusting the temperature of the stringent wash“B”buffer. High Stringency Washes (HSW) were con-ducted at 48–50°C and Low Stringency Washes were per-formed at 41–43°C. Experimental conditions for sscDNA targets were annotated as follows: “Hybridization Cock-tail”_“Hybridization Stringency”_“Washing Stringency”. The following conditions were tested for ssDNA targets, DMSO_HSH_LSW, DMSO_HSH_HSW, DMSO_LSH_H-SW, TMAC_HSH_LDMSO_LSH_H-SW, and TMAC_HSH_HSW. All ex-perimental arrays were processed on a GCAS automated workstation using the HYB_01 and WASH_01 protocols (Affymetrix, Santa Clara, CA). Additionally, the results of experimental sscDNA hybridizations were compared with previously published data from both cRNA/HT arrays pro-cessed under standard conditions (IVT_Std) and MAQC qPCR reference data sets [24]. All experimental conditions were replicated in triplicate for a total of 120 HT arrays.
Target preparation and labeling of test RNAs Reference RNAs
Two reference RNAs were used in this study. The Universal Human Reference RNA (catalog number 740000) and Human Brain Reference RNA (catalog number AM6050) samples were purchased from Stratagene/Agilent, Santa Clara, CA and Ambion/Life Technologies, Grand Island, NY respectively.
sscDNA target production
3100) and the Ovation Whole Blood reagent (catalog number 4200) NuGEN Technologies, San Carlos, CA, according to the manufacturer’s recommendations and then pooled to eliminate any potential confounding factors associated with labeling variance. sscDNA targets were mass titrated and then fragmented using FL Ovation cDNA biotin module (catalog number 4200-A01) NuGEN Technologies, San Carlos, CA according to the manufac-ture’s recommendation. Finally, fragmented and bioti-nylated sscDNAs were re-suspended in either TMAC hybridization buffer (100 mM MES. 2.5 M TMAC, 20 mM EDTA, 0.01% Tween-20) or DMSO hybridization buffer (100 mM MES. 1 M [Na+], 20 mM EDTA, 0.01% Tween-20) containing the hybridization controls BioB, BioC, BioD, and cre (P/N 900458, Affymetrix) for HT plates.
cRNA target production
The Affymetrix automated Target Preparation protocol (TP_0001) was used to prepare 48 replicates of labeled and unfragmented cRNA in bulk starting from 1 ug of either UHRR or HBRR according to the GeneChip Expression Analysis Technical Manual for Cartridge Arrays using the GeneChip Array Station (catalog number 702064), Affyme-trix, Santa Clara, CA. Labeled, unfragmented cRNA yields were calculated for each set of 48 wells and high-quality rep-licates were then pooled and redistributed to a 96-well plate for manual fragmentation (data not shown). Fragmented cRNA test samples were repooled to achieve uniformity and then split into two aliquots and added to a TMAC hybridization buffer containing the hybridization controls BioB, BioC, BioD, and cre (P/N 900458, Affymetrix) for HT plates.
Target preparation and labeling of test RNAs
sscDNA targets were generated in bulk from 96 replicate 20 ng HBRR or UHRR RNA reactions using the Ovation RNA automated amplification kit (NuGEN Technologies, San Carlos, CA), and then pooled to eliminate any poten-tial confounding factors associated with labeling variance. sscDNA targets were mass titrated and then fragmented using FL Ovation cDNA biotin module for automation (catalog number 4200-A01). Finally, fragmented and bioti-nylated sscDNAs were resuspended in either TMAC or DMSO hybridization buffer.
HT hybridization, washing, scanning, and image processing
sscDNA targets were hybridized to HT plate arrays over-night and then washed and stained as described above. Array images (.dat files) were generated using a GeneChip HT array plate scanner (Affymetrix). Mini“.dat”files were stitched together using the software HT Image Reader, v1.0.27 (Affymetrix). Signal values in“.cel”and“.chp”files and present/absent calls and“.rpt” files containing global
array quality metrics were generated for each scanned image using the GCOS Software Statistical Algorithm, v1.0 (Affymetrix). Global quality metrics were imported into Spotfire (Spotfire Inc., Palo Alto, CA) for visualization.
Clinical study design
Nine subjects (3 females and 6 males) from a phase 1, sin-gle-dose, healthy-volunteer, dose and route finding study conducted as part of the clinical development of PEG-IFN beta-1a received a single IM 30-μg injection (6 MIU) of either IFN beta-1a (AvonexW) or PEG-IFN beta-1a 63-μg injection (6 MIU). Peripheral blood samples used for ex-pression profiling were collected prior to injection and at 6 and 48 hours postinjection using the PAXgene Blood RNA System (Qiagen, Hilden, Germany). This study was per-formed according to the principles outlined in the Declar-ation of Helsinki and after approval by the Biogen Idec Institutional Review Board.
Subject information and consent
Prior to any testing under this protocol, including screening tests and assessments, written informed con-sent with the approved Informed Concon-sent Form (IFC) was obtained from the subject in accordance with local practice and regulations. Written informed consent was obtained from all subjects participating in this clinical study conducted by Biogen Idec.
A copy of the ICF, signed and dated by the subject, was given to the subject. Confirmation of a subject’s informed consent has been documented in the subject’s medical rec-ord prior to any testing under this protocol, including screening tests and assessments.
HT whole blood gene expression profiling
Statistical analyses
All analyses were performed in the R statistical language using BRB ArrayTools v3.6.3 developed by Dr. Richard Simon and Amy Peng Lam. Array quartile normalization and probe set summarizations were performed using the GCRMA procedure as implemented in BRB Array tools. Microsoft excel was employed for calculating standard deviations and coefficients of variation. PCA and hierarch-ical clustering analysis were performed using Spotfire (http:/www.spotfire.com) and R software packages.
Additional file
Additional file 1:Top induced pathways 6 post Interferon beta administration.
Abbreviations
Bp: Base pair; cDNA: Complementary DNA; cRNA: Complementary RNA; DMSO: Dimethylsulfoxide; HBRR: Human brain reference RNA; HSH: High stringency hybridization; HSW: High stringency wash; HT: High throughput; LSH: Low stringency hybridization; LSW: Low stringency wash; IFN: Interferon; IM: Intramuscular; IVT:In vitrotranscription; LOD: Logarithm (base 10) of odds; MAQC: Microarray quality control; NUSE: Normalized, unscaled standard error; PCA: Prinicipal component analysis; PEG: Polyethylene glycol; PEG-IFN beta-1a: PEGylated interferon beta-1a; pPCR: Quantitative polymerase chain reaction; SF: Scaling factor; sscDNA: Single-stranded complementary DNA; TMAC: Tetramethylammonium chloride; UHRR: Universal human reference RNA; MIU: Million Units.
Competing interests
The authors declare that they have no competing interests.
Authors’contributions
NEA conceived the study, participated in its design and coordination; carried out RNA sample preparation and qPCR experiments; participated in oligo-array hybridization, data extraction and data interpretation; performed the statistical analyses; and drafted the manuscript. JB, JC, SB, and GB participated in data interpretation and study coordination and contributed to the final draft of the manuscript. All authors read and approved the final version of the manuscript.
Acknowledgements
Medical writing assistance was provided by Christopher Barnes and editorial support was provided by Joshua Safran, both of Infusion Communications. Their work was funded by Biogen Idec Inc. This research was supported by Biogen Idec Inc.
Received: 31 October 2011 Accepted: 20 December 2012 Published: 5 January 2013
References
1. Baird AE:The blood option: transcriptional profiling in clinical trials.
Pharmacogenomics2006,7:141–144.
2. Burczynski ME, Dorner AJ:Transcriptional profiling of peripheral blood cells in clinical pharmacogenomic studies.Pharmacogenomics2006, 7:187–202.
3. Mohr S, Liew CC:The peripheral-blood transcriptome: new insights into disease and risk assessment.Trends Mol Med2007,13:422–432. 4. Liew CC, Ma J, Tang HC, Zheng R, Dempsey AA:The peripheral blood
transcriptome dynamically reflects system wide biology: a potential diagnostic tool.J Lab Clin Med2006,147:126–132.
5. Chia SY, Milas M, Reddy SK, Siperstein A, Skugor M, Brainard J, Gupta MK: Thyroid-stimulating hormone receptor messenger ribonucleic acid measurement in blood as a marker for circulating thyroid cancer cells and its role in the preoperative diagnosis of thyroid cancer.J Clin Endocrinol Metab2007,92:468–475.
6. Hilpert J, Beekman JM, Schwenke S, Kowal K, Bauer D, Lampe J, Sandbrink R, Heubach JF, Stürzebecher S, Reischl J:Biological response genes after single dose administration of interferon beta-1b to healthy male volunteers.J Neuroimmunol2008,199:115–125.
7. Miyamoto M, Yanai M, Ookubo S, Awasaki N, Takami K, Imai R:Detection of cell-free, liver-specific mRNAs in peripheral blood from rats with hepatotoxicity: a potential toxicological biomarker for safety evaluation.
Toxicol Sci2008,106:538–545.
8. Medvedovic M, Halbleib D, Miller ML, LaDow K, Sartor MA, Tomlinson CR: Gene expression profiling of blood to predict the onset of leukemia.
Blood Cells Mol Dis2009,42:64–70.
9. Fuscoe JC, Tong W, Shi L:QA/QC issues to aid regulatory acceptance of microarray gene expression data.Environ Mol Mutagen2007,48:349–353. 10. Gibson G:Microarrays in ecology and evolution: a preview.Mol Ecol2002,
11:17–24.
11. Strauss E:Arrays of hope.Cell2006,127:657–659.
12. Chen H, Li J:Nanotechnology: moving from microarrays toward nanoarrays.Methods Mol Biol2007,381:411–436.
13. Honore P, Granjeaud S, Tagett R, Deraco S, Beaudoing E, Rougemont J, Debono S, Hingamp P:MicroArray Facility: a laboratory information management system with extended support for Nylon based technologies.BMC Genomics2006,7:240.
14. Affymetrix White Paper:A Comparative Assessment of Performance Between HT and Cartridge IVT Expression Arrays. Santa Clara: 2007:1–22. http://www. affymetrix.com/esearch/search.jsp?Ntt=Affymetrix%3A+A+Comparative +Assessment+of+Performance+Between+HT+and+Cartridge+IVT+ +Expression+Arrays.+Santa+Clara%3A%3B+2007%3A1%E2%80%9322. &basic=1.
15. Allaire NE, Rieder LE, Bienkowska J, Carulli JP:Experimental comparison and cross-validation of Affymetrix HT plate and cartridge array gene expression platforms.Genomics2008,92:359–365.
16. Van Gelder RN, von Zastrow ME, Yool A, Dement WC, Barchas JD, Eberwine JH:Amplified RNA synthesized from limited quantities of heterogeneous cDNA.Proc Natl Acad Sci U S A1990,87:1663–1667.
17. Thach DC, Agan BK, Olsen C, Diao J, Lin B, Gomez J, Jesse M, Jenkins M, Rowley R, Hanson E, Tibbetts C, Stenger DA, Walter E, Epidemic Outbreak Surveillance (EOS):Surveillance of transcriptomes in basic military trainees with normal, febrile respiratory illness, and convalescent phenotypes.Genes Immun2005,6:588–595.
18. Affymetrix:Globin Reduction Protocol: A Method for Processing Whole Blood RNA Samples for Improved Array Results. Santa Clara: 2004.
19. Affymetrix:GeneChip Globin Reduction Kit Handbook. Santa Clara: 2004. 20. Ambion:GLOBINclear Kit for Reduction of Globin. Austin; 2007:22. 21. Liu J, Walter E, Stenger D, Thach D:Effects of globin mRNA reduction
methods on gene expression profiles from whole blood.J Mol Diagn
2006,8:551–558.
22. Eklund AC, Turner LR, Chen P, Jensen RV, deFeo G, Kopf-Sill AR, Szallasi Z: Replacing cRNA targets with cDNA reduces microarray cross-hybridization.Nat Biotechnol2006,24:1071–1073.
23. Barker CS, Griffin C, Dolganov GM, Hanspers K, Yang JY, Erle DJ:Increased DNA microarray hybridization specificity using sscDNA targets.BMC Genomics2005,6:57.
Meehan J, Miclaus K, Moffitt RA, Montaner D, Mukherjee P, Mulligan GJ, Neville P, Nikolskaya T, Ning B, Page GP, Parker J, Parry RM, Peng X, Peterson RL, Phan JH, Quanz B, Ren Y, Riccadonna S, Roter AH, Samuelson FW, Schumacher MM, Shambaugh JD, Shi Q, Shippy R, Si S, Smalter A, Sotiriou C, Soukup M, Staedtler F, Steiner G, Stokes TH, Sun Q, Tan PY, Tang R, Tezak Z, Thorn B, Tsyganova M, Turpaz Y, Vega SC, Visintainer R, von Frese J, Wang C, Wang E, Wang J, Wang W, Westermann F, Willey JC, Woods M, Wu S, Xiao N, Xu J, Xu L, Yang L, Zeng X, Zhang J, Zhang L, Zhang M, Zhao C, Puri RK, Scherf U, Tong W, Wolfinger RD, MAQC Consortium:The MicroArray Quality Control (MAQC)-II study of common practices for the development and validation of microarray-based predictive models.
Nat Biotechnol2010,28:827–838.
25. Gentleman R:Bioinformatics and computational biology solutions using R and Bioconductor. Springer Science + Business Media; 2005.
26. Smyth GK:Linear models and empirical bayes methods for assessing differential expression in microarray experiments.Stat Appl Genet Mol Biol
2004,3:Article3.
27. Wilson CL, Miller CJ:Simpleaffy: a BioConductor package for Affymetrix Quality Control and data analysis.Bioinformatics2005,21:3683–3685. 28. Vandenbroeck K, Urcelay E, Comabella M:IFN-beta pharmacogenomics in
multiple sclerosis.Pharmacogenomics2010,11:1137–1148.
29. Hu X, Miller L, Richman S, Hitchman S, Glick G, Liu S, Zhu Y, Crossman M, Nestorov I, Gronke RS, Baker DP, Rogge M, Subramanyam M, Davar G: A novel PEGylated interferon beta-1a for multiple sclerosis: safety, pharmacology, and biology.J Clin Pharmacol2011, Epub ahead of print. 30. Bains W:Selection of oligonucleotide probes and experimental
conditions for multiplex hybridization experiments.Genet Anal Tech Appl
1994,11:49–62.
31. Honore' B, Madsen P, Leffers H:The tetramethylammonium chloride method for screening of cDNA libraries using highly degenerate oligonucleotides obtained by backtranslation of amino-acid sequences.
J Biochem Biophys Methods1993,27:39–48.
32. Legault-D’mare J, Desseaux B, Heyman T, S’eror S, Ress GP:Studies on hybrid molecules of nucleic acids I. DNA-DNA hybrids on nitrocellulose filters.Biochem Biophys Research Comm1967,28:550–557.
33. The IFNB, Multiple Sclerosis Study Group:Interferon beta-1a is effective in relapsing-remitting multiple sclerosis. I. Clinical results of a multicenter, randomized, double-blind, placebo-controlled trial.Neurology1993, 43:655–661.
34. Jacobs LD, Cookfair DL, Rudick RA, Herndon RM, Richert JR, Salazar AM, Fischer JS, Goodkin DE, Granger CV, Simon JH, Alam JJ, Bartoszak DM, Bourdette DN, Braiman J, Brownscheidle CM, Coats ME, Cohan SL, Dougherty DS, Kinkel RP, Mass MK, Munschauer FE 3rd, Priore RL, Pullicino PM, Scherokman BJ, Whitham RH,et al:Intramuscular interferon beta-1a for disease progression in relapsing multiple sclerosis. The Multiple Sclerosis Collaborative Research Group (MSCRG).Ann Neurol1996, 39:285–294.
35. PRISMS (Prevention of Relapses and Disability by Interferon Beta-1a Subcutaneously in Multiple Sclerosis) Study Group:Randomised double-blind placebo-controlled study of interferon beta-1a in relapsing/ remitting multiple sclerosis.Lancet1998,352:1498–1504.
36. Runkel L, deDios C, Karpusas M, Betzenhauser M, Muldowney C, Zafari M, Benjamin CD, Miller S, Hochman PS, Whitty A:Systematic mutational mapping of sites on human interferon-beta-1a that are important for receptor binding and functional activity.Biochemistry2000,39:2538–2551. 37. Baker DP, Pepinsky RB, Brickelmaier M, Gronke RS, Hu X, Olivier K, Lerner M,
Miller L, Crossman M, Nestorov I, Subramanyam M, Hitchman S, Glick G, Richman S, Liu S, Zhu Y, Panzara MA, Davar G:PEGylated interferon beta-1a: meeting an unmet medical need in the treatment of relapsing multiple sclerosis.J Interferon Cytokine Res2010,30:777–785.
doi:10.1186/1756-0500-6-8
Cite this article as:Allaireet al.:Optimization of a high-throughput whole blood expression profiling methodology and its application to assess the pharmacodynamics of interferon (IFN) beta-1a or polyethylene glycol-conjugated IFN beta-1a in healthy clinical trial subjects.BMC Research Notes20136:8.
Submit your next manuscript to BioMed Central and take full advantage of:
• Convenient online submission
• Thorough peer review
• No space constraints or color figure charges
• Immediate publication on acceptance
• Inclusion in PubMed, CAS, Scopus and Google Scholar
• Research which is freely available for redistribution