Image analysis framework with focus evaluation for in situ
characterisation of particle size and shape attributes
q
Javier Cardona
a, Carla Ferreira
b,c, John McGinty
b,c, Andrew Hamilton
a, Okpeafoh S. Agimelen
b,
Alison Cleary
a, Robert Atkinson
a, Craig Michie
a, Stephen Marshall
a, Yi-Chieh Chen
b, Jan Sefcik
b,
Ivan Andonovic
a, Christos Tachtatzis
a,⇑a
Department of Electronic and Electrical Engineering, University of Strathclyde, Glasgow G1 1XW, Scotland, UK b
Department of Chemical and Process Engineering, University of Strathclyde, Glasgow G1 1XJ, Scotland, UK c
EPSRC Centre for Innovative Manufacturing in Continuous Manufacturing and Crystallisation, University of Strathclyde, Glasgow G1 1RD, Scotland, UK
h i g h l i g h t s
Image analysis framework for particle size and shape characterisation from in-line imaging sensors.
Representative particle size and shape statistics by discarding partially out-of-focus objects.
Evaluation of the image analysis framework against standard spherical and elongated particles.
a r t i c l e
i n f o
Article history:
Received 3 April 2018
Received in revised form 31 May 2018 Accepted 24 June 2018
Available online 25 June 2018
Keywords:
Particle sizing In-line monitoring Particle attributes Size and shape distributions Imaging
Forward model Focus
a b s t r a c t
Particle processing industries, such as pharmaceutical, food processing and consumer goods sectors, increasingly require strategies to control and engineer particle attributes. In both traditional batch and continuous processes, particle size and shape need to be effectively monitored through in-line measure-ments from Process Analytical Technologies. However, obtaining quantitative information from these measurements has proven to be challenging and in-line imaging techniques are primarily used for qual-itative purposes. Two key challenges are: (1) the presence of out-of-focus objects and (2) images only represent 2D projections of three-dimensional objects. In this work, a novel framework to process frames from in-line imaging probes incorporates a focus evaluation step in order to extract meaningful quanti-tative shape and size information through rejection of out-of-focus particles. Furthermore, a model is proposed that simulates the 2D projection of three-dimensional particles onto the focal plane and com-putes the corresponding size and shape distributions. The framework is quantified and evaluated against standard particles of well-defined size and shape such as polystyrene microspheres and needle-like cuboid silicon particles.
Ó2018 The Authors. Published by Elsevier Ltd. This is an open access article under the CC BY license (http:// creativecommons.org/licenses/by/4.0/).
1. Introduction
1.1. Background on of particle size and shape characterisation
The monitoring and control of manufacturing processes requires the use of in-line instrumentation and measurements to track the state of the system in situ and at any given instant. This allows to act timely on any deviation from the product
specification altering the operating conditions. In the field of particle processing, the development of Process Analytical Technologies (PAT) in pharmaceutical, food, environmental, oil and gas and other sectors (Yu et al., 2004; Rathore and Winkle, 2009; Vardoulakis et al., 2003; Schümann et al., 2015) has made available a range of tools to monitor the process in-line without need of sampling or process disruptions such as bypass or dilution loops. The ability to extract real-time information has attracted the attention in pharmaceutical manufacturing within a recent movement from traditional discon-tinuous or batch processing towards condiscon-tinuous manufacturing (Plumb, 2005; Mascia et al., 2013; Baxendale et al., 2014; Page et al., 2014), with the aim to automate and optimise production processes.
https://doi.org/10.1016/j.ces.2018.06.067
0009-2509/Ó2018 The Authors. Published by Elsevier Ltd.
This is an open access article under the CC BY license (http://creativecommons.org/licenses/by/4.0/).
qAll data underpinning this publication are openly available from the
University of Strathclyde at http://dx.doi.org/10.15129/99c4558f-f59e-4be8-80e2-b0425178332b.
⇑Corresponding author.
E-mail address:[email protected](C. Tachtatzis).
Contents lists available atScienceDirect
Chemical Engineering Science
The particle size and shape distributions are crucial quality attributes of particulate products and have a significant influence on the performance of downstream processes (e.g. granulation, suspension and powder treatments, drying) (Sun and Grant, 2001; Hagrasy et al., 2013; Fonteyne et al., 2014) and direct impact on the characteristics of the final product (e.g. uniformity, dissolution, and stability) (Davey and Garside, 2000; Wang et al., 2008; Blagden et al., 2007; Gratton et al., 2008). In a different context, oil/water emulsions are present when oil is extracted and transported through pipelines. The characteristics of droplet distributions in these emulsions influence transport properties and the performance of downstream separation processes (Khatibi, 2013; Schümann et al., 2015). Therefore, an accurate characterisation of particle or droplet size and shape distributions is critical to allow for appropriate monitoring and control of multiphase processes.
The most common source of information regarding particle size and shape comes from off-line measurements based on sieve anal-ysis, laser diffraction or imaging. Although off-line measurements are well-established in batch processing for product characterisa-tion and quality control, they are not suitable for real-time monitoring and control of neither batch nor continuous processes. Off-line techniques generally require sampling which needs to be representative and sample handling may alter the particle charac-teristics and requires additional facilities and processing time. In-line techniques have the potential to eliminate the associated issues with sampling and handling, while providing real-time data. In recent years, imaging techniques are gaining importance within the wide range of PAT available (Wang et al., 2008; Ma et al., 2016). In-line imaging techniques, such as Mettler Toledo PVM (Particle Vision and Measurement), have mostly been used as a way to monitor processes qualitatively and to help to interpret information extracted from other methods (Barrett and Glennon, 2002; Kougoulos et al., 2005; Sun et al., 2009; Zidan et al., 2010; Xalter and Mulhaupt, 2010; Liu et al., 2011; Hao et al., 2012; Yang and Rasmuson, 2012; Simon et al., 2012; Luo et al., 2013; Liu et al., 2013; Jiang et al., 2014; Xu and Liu, 2015; Simone et al., 2015a,b; Klapwijk et al., 2016; Abioye et al., 2016). However, in order to extract meaningful and reliable quantitative informa-tion from in-line images, limitainforma-tions in the quality of the images must be overcome. In recent work, this group has used quantitative morphological information extracted from in-line PVM images combined with chord length distribution (CLD) measurements from Focused Beam Reflectance Measurement (FBRM) probes, to inform inversion algorithms that transform CLD into PSD (Agimelen et al., 2016). Several real-time image analysis algo-rithms have been developed in the past for monitoring crystallisa-tion of (L)-glutamic acid (Calderon De Anda et al., 2005,; Wang et al., 2007) and monosodium glutamate (Zhou et al., 2009, 2011) and to study the effect of impurities (Borsos et al., 2016) and additives (Simone et al., 2017) in the pharmaceutical industry, as well as for the characterisation of droplets in oil/water emul-sions (Khatibi, 2013; Schorsch et al., 2014; Schümann et al., 2015). The ability to process particle attributes extracted from in-line images in real time has also induced the incorporation of this data stream into feedback control systems (Borsos et al., 2017). The particle size information obtained from images, which represent the 2D projections of 3D objects, is closer to a real PSD than the one provided by other techniques, particularly for elon-gated objects. However, partially detected particles often skew the obtained 2D shape and size distributions and results of the in-line image analysis are generally corroborated by offline mea-surements. Therefore, two challenges remain: the exclusion of out-of-focus particles when determining particle statistics and the fact that images only provide two-dimensional views of 3D objects and consequently the corresponding particle size and
shape distributions are not representative of the 3D object for non-spherical particles.
1.2. Focus evaluation
When using off-line image-based techniques, the focus level does not represent a significant problem since objects are placed at or close to the focal length of the instrument and remain static during image acquisition. However, a common challenge for in-line image-based measurements is that particles are not con-strained in the movement relative to the field of view of the probe and only a small fraction can be considered to be in focus. Particles that are out-of-focus will bias size and shape distributions since their outlines are less defined. The general effect is to overestimate particle size and introduce an error in the feature estimation such as shape and size, both of which are critical in evaluating processes such as crystal growth. It is therefore essential to exclude out-of-focus particles that may impact on the crystal characterisation. One approach, is to devise rigs where product slurry is forced through a flow cell (Kempkes et al., 2010; Borchert et al., 2014) or stop-flow cell (Patience and Rawlings, 2001). Nevertheless, implementations in large scale manufacturing processes is prob-lematic due to complexity and the risk of blockages. Alternative methods that do not use a flow cell are based on the use of particle shape models to complement the features extracted from images (Chen and Wang, 2005; Larsen et al., 2006; Schorsch et al., 2014). After particles have been detected, multiple approaches have been proposed for their classification (Zhang and Lu, 2004; Calderon De Anda et al., 2005; Huo et al., 2016). Chen and Wang (2005)has employed wavelets for image segmentation and the curvature of the objects to detect circles.Larsen et al. (2006)has utilised line fit-ting to extract needle-like particles from noisy images. More recently, some works have examined image restoration to elimi-nate motion blur (Liu et al., 2017). However, the primary factor of incorrect particle detection remains the focus of particles. El Arnaout et al. (2016) attempts to address and compensate for uneven image illumination and reject or correct out-of-focus parti-cles using a rolling ball background subtraction and a sliding para-boloid of rotation. This is similar to our approach, however, instead of directly adjusting a threshold on a focus measure, the free parameter that controls the focus sensitivity is the rolling ball radius. This radius must be set to at least the size of the largest object, which may not be known a priori.Sarkar et al. (2009) and Zhou et al. (2009)proposed object filtering techniques to mitigate partially detected objects using morphological features and they quantify the measurements using manually annotated particle masks. Although their approaches increase confidence in in-line imaging techniques, their particle filtering may not hold in systems with evolving or mixed shapes.
1.3. Real vs. projected particle size
2012; Borchert et al., 2014; Zhang et al., 2015; Kempkes et al., 2010; Schorsch et al., 2012, 2014, 2015; Ochsenbein et al., 2015; Rajagopalan et al., 2017; Zhang et al., 2017). However, the adoption of this technique remains limited for in-line measurements due to the more complicated setups involved and the restricted perfor-mance for highly concentrated systems where overlaps can play a major role. An alternative approach is to simulate particles in random 3D orientations and compute their 2D projections to build a library of size and shape distributions (forward transformation). Subsequently, the output of the imaging sensor could be compared against the library of distributions and select the forward transfor-mation with the closest similarity; in this work this is shown for cuboid-like particles. A similar approach was shown byRuf et al. (2000)to estimate the expected CLDs of a number of predefined shapes through forward transformation of PSDs. This approach has recently been improved and implemented for in-line model predictive control using FBRM probes (Szilágyi et al., 2018). In terms of imaging, this method can also be applied in population balance modelling (Wang et al., 2008; Ma et al., 2016).
1.4. Paper structure
In this work, a novel framework is developed to extract quan-titative information from in-line imaging techniques which incorporates a particle filter to discard out-of-focus, less defined particles from the reported statistics. The manuscript is organised as follows. In Section 2, details are provided on the experimental setup and the materials used in this work. The main features of the image analysis framework are described in Section3. In Section4, the proposed system is evaluated for standard particulate systems of various sizes: polystyrene micro-spheres and silicon needle-like particles. The performance and limitations of the particle characterisation framework are illustrated and demonstrate the effectiveness of the out-of-focus filter to extract meaningful shape and size information. In the case of elongated particles, the output of the image analysis framework is compared with expected projected distri-butions of 3D cuboids generated through simulations. Section5 summarizes the main findings of this work.
2. Methods and materials
2.1. Experimental setup
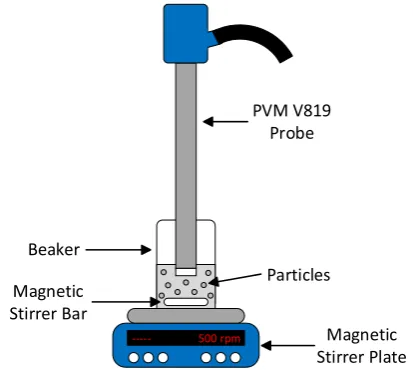
Fig. 1shows a representation of the experimental setup. The standard particles were suspended in a solvent using a magnetic stirrer to homogenise the solution. The Mettler Toledo Particle Vision and Measurement (PVM) probe was introduced in the solution to acquire in-line images of the particles. The PVM V819 model used in this work captures greyscale images with an image resolution of 13601024 pixels and has a field of view of 1075825
l
m, which translates into a pixel size of approxi-mately 0.8l
m. The probe was placed just below the liquid level in order to minimise its influence on the mixing pattern within the beaker. The beaker was then covered to avoid solvent evapo-ration and external contamination of the sample during the experiment. Once all the elements of the experimental setup were in place, magnetic stirring and image acquisition were initi-ated simultaneously. The experiment duration was a function of particle size and concentration and was selected in order to ensure a sufficient number of objects was detected to consider the results statistically meaningful. For the systems analysed in this work, ISO Standards on particle size determination through image analysis methods (ISO 13222-1:2014 ISO 13322-1:2014,) recommend to consider a minimum of approximately 500representative samples in order to obtain distribution medians within 5% error. The experiments were designed in such a way that, even for the more challenging conditions, at least 1000 rep-resentative objects (i.e. in focus) were collected. The experimental data that form the base of the results presented in this paper are available inCardona et al. (2018).
2.2. Samples
2.2.1. Standard polystyrene microspheres
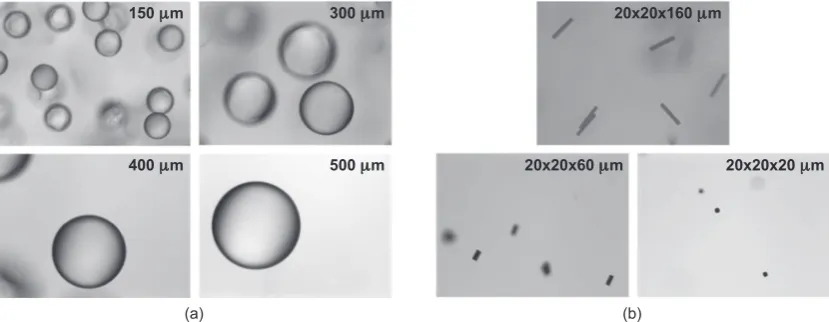
Duke standard polystyrene (PS) microspheres with NIST trace-able mean diameter of four different nominal sizes (150;300;400, 500
l
m) are used to evaluate the accuracy of the image analysis algorithm (seeFig. 2a). These systems are charac-terised by very narrow size distributions and are expressly devel-oped for the calibration of size measuring instruments. The smaller microspheres (150l
m) were purchased from Sigma-Aldrich while the remaining particles were obtained from Thermo Fisher ScientificTM.Table 1shows the mean and standard deviation of each particle size distribution as specified by the manufacturers. Initially, 1 g of polystyrene microspheres was suspended in water at a stirring speed of 350–550 rpm, depending on the size of the particles. Then, the solution was subsequently diluted in various steps to study the effect of solid loading in a range of 1–5 wt.%. Beakers of 50–250 ml were used to accommodate the increasing volume of solution. The polystyrene microspheres were suspended in water to avoid particle swelling, characteristic in other solvents such as alcohols (Lok and Ober, 1985).2.2.2. Standard silicon particles
[image:3.595.323.530.66.252.2]Standard elongated particles with rigorous particle size cali-bration are not easily accessible. In order to study the response of the image analysis framework to particles of non-spherical shape, silicon particles of three different elongations were pur-chased from Kelvin Nanotechnology Ltd. As shown in Fig. 2b, these unique samples are of cuboid shape. They share two dimen-sions but differ in length: 2020160
l
m, 202060l
m and 202020l
m. The particles were inspected by the manufac-turer through calibrated optical microscopy and were shown to have a particle size deviation of less than 1l
m. Silicon particles are not susceptible to swelling and they were suspended in 50 ml of isopropanol (IPA) at a stirring speed of 500 rpm to facilitate their dispersion.3. The image analysis framework
The developed image analysis workflow, shown inFig. 3, com-bines standard image processing steps with an additional focus evaluation stage that precedes the determination of particle prop-erties. The PVM V819 instrument collects 8-bit greyscale images using a laser source at 808 nm as illumination. The first step of the image processing algorithm consists of a two dimensional median filter (Lim, 1990) to eliminate noise from the camera sen-sor. The larger the size of the filter window, the smoother the fil-tered image however at the expense of edge clarity. Once the
[image:4.595.95.510.68.229.2]raw image has been smoothed, a Laplacian of Gaussian filter (Lindeberg, 1994, 1998) is applied to facilitate edge detection. Ini-tially, a two-dimensional Gaussian function of specific window size and standard deviation is used to convolve the image. Then, the Laplacian operator, which computes the second spatial derivative of the image, is applied to this convolution. Through this approach, regions of the image where the pixel intensity varies (i.e. edges) show a sharp change of the Laplacian. As a result, the application of this filter provides an image with sharper edges. A threshold is then applied to this enhanced image to separate actual particles from the underlying background. The output of this operation is a binary image containing all the objects detected in the frame. The following step consists of filling the possible holes present in the detected objects using a disk of specific radius as structural ele-ment. This process is necessary based on observational data that show crystalline structures do not present gaps although these might seem to be present in a binary representation due to the transparency of the material. An additional situation that needs
[image:4.595.42.294.286.318.2]Fig. 2.PVM images of the standard particles used for evaluation of the image analysis framework: (a) polystyrene microspheres, and (b) elongated silicon particles.
Table 1
Polystyrene microspheres specifications.
Nominal size (lm) 150 300 400 500 Mean size (lm) 153.0 298.0 398.0 500.0 Standard deviation (lm) 2.1 13.0 12.7 25.5
[image:4.595.125.483.471.736.2]to be addressed is that of objects which fall onto the boundary of the image frame. Unless the particle shape is known a priori, it is not possible to establish the dimensions of the part of the object situated outside the field of view of the camera. Therefore, it has been decided to discard all objects that fall on the image edges (in accordance with ISO 13222-1:2014ISO 13322-1:2014,). Finally, the framework offers the possibility to implement a size threshold to reject objects of small projected area that are not adequately resolved at the corresponding image resolution. In order to ascer-tain the existence of an object within the sensor viewfinder, the particle has to occupy a certain number of pixels to provide the ability to measure its size and shape. Accepting the fact that smal-ler objects may exist in the slurry which will not be detected, the avoidance of quantisation noise (3:3% for a square particle) is considered more crucial. For instruments with higher resolution the size threshold can be reduced to utilise the improved image quality. All the parameters mentioned in this description are con-figurable within the image analysis framework. The default values used in this work are summarised inTable A.2inAppendix A.
As mentioned in the introduction, in-line imaging techniques are particularly susceptible to the presence of out-of-focus objects which properties do not represent the actual particles present in the system. Therefore, the rejection of these elements is essential to obtain an accurate characterisation of the system. Numerous techniques exist that can be used to determine the focus of an object through filtering and evaluation of gradient changes (Pertuz et al., 2013). However, these methods have not commonly been applied to the analysis of in-line imaging for particle technol-ogy applications. The proposed framework incorporates several of these features: GDER: Gaussian Derivative (Geusebroek et al., 2000), HISR: Histogram range (Firestone et al., 1991), LAPD: Diag-onal Laplacian-based (Thelen et al., 2009), SFIL: Steerable filters (Minhas et al., 2009), WAVR: Ratio of Wavelet coefficients (Xie et al., 2006), and WAVS: Sum of Wavelet coefficients (Yang and Nelson, 2003). The work presented here incorporates a focus filter based on the first order Gaussian derivative (GDER). However, the framework could operate with other focus measures. Selecting an appropriate focus threshold based on these parameters is key to obtain realistic size and shape distributions, as shown in Sections 4.1.3 and 4.2.3.
In the final step of the image analysis framework, the objects that have overcome the different filters mentioned above are char-acterised through a number of particle size and shape attributes. This procedure is well established and standardised (ISO 9276-6:2008, 1998) and has previously been implemented in a variety of off-line imaging techniques (e.g Malvern Morphologi G3, Sym-patec QICPIC). The regionprops function in MATLABÒ (The Mathworks, 2017) was used to determine particle characteristics such as area, perimeter, circularity, convexity and solidity for every object. A more detailed definition of these terms can be found in Appendix A. However, the determination of additional attributes such as particle lengths and aspect ratio requires further
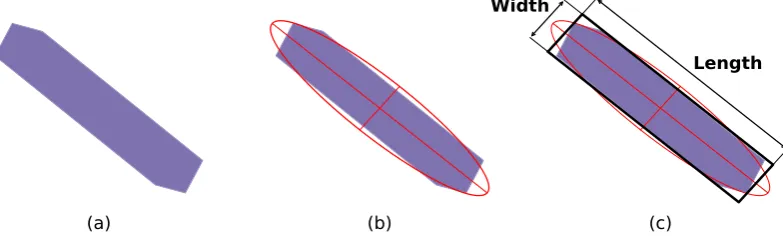
treat-ment. A graphical description of the method employed is shown inFig. 4. It consists of producing an ellipse fit to the particle by evaluating the ellipse that has the same normalised second central moments as the object. This method is commonly used in image processing as the evaluation of central moments can be achieved rapidly using the binary matrix that depicts the image (ISO 9276-6:2008, 1998). The resulting ellipse is defined by three parameters: major axis length, minor axis length, and orientation of the major axis with respect to the horizontal axis. Other meth-ods use directly the major and minor axis lengths obtained from the ellipse fit as a measure of particle length. Although, an accurate result would be obtained for objects of ellipsoidal projection, this would not provide satisfactory results for shapes with sharp edges. In these cases, the axis of the ellipse will be longer than that of the original particle (seeFig. 4). An alternative method generates a bounding box around the particle which orientation is determined by the orientation of the major axis of the ellipse. The length and width of the particle correspond to the longer and shorter sides of the bounding box, respectively. Finally, the aspect ratio of the particle is derived as the ratio of width to length.
A software that incorporates all the features described above is available for download in Cardona and Tachtatzis (2018). The framework has been tested on an IntelÒCoreTMi7-6700HQ CPU @ 2.60 GHz processor with 16 GB RAM and is able to analyse every image in a time scale of seconds to tenths of seconds depending on the concentration of particles in the image.
4. Evaluation of the image analysis framework
The performance of the image analysis framework is evaluated using standard spherical and needle-like particles of known dimensions. For the spherical particles, the results are validated against size distributions provided by the manufacturers. For the needle-like particles, the specifications of the manufacturer refer to the 3D characteristics of the particles (i.e. length, width and thickness). However, as mentioned previously, only 2D projections of these particles are accessible within images. In this case, valida-tion is performed through Monte Carlo simulavalida-tions to estimate the expected 2D projected distributions of size and aspect ratio from randomly oriented 3D objects. This method is described in Sec-tion4.2.1. Finally, the effects of focus, size and solid loading are demonstrated throughout the results. In this work, the framework is evaluated on images acquired with the PVM V819 probe. How-ever, the same procedure could be applied to images obtained from other sources.
4.1. Standard spherical particles
[image:5.595.95.487.623.741.2]Spheres have the particular characteristic that their 2D projection observed in PVM images corresponds to a circle which diameter is equivalent to the diameter of the spherical object. Only in this particular case, the projected particle size distribution fully
represents the actual 3D PSD of the system. This section shows the importance of excluding out-of-focus particles from the analysis to obtain representative results, and explores the influence of the size of the particles on PSD and aspect ratio distributions extracted from PVM images.
4.1.1. Expected particle size and shape distributions
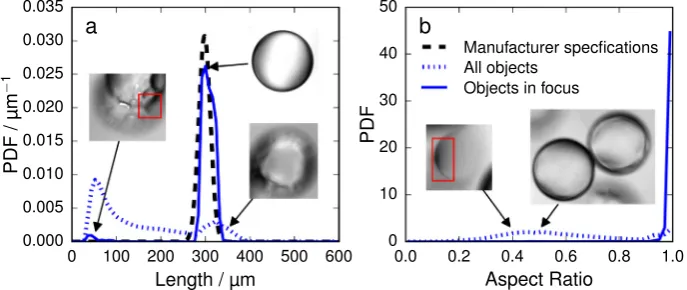
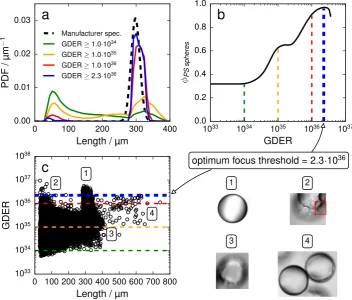
The manufacturer of the standard spherical particles used in this work guarantees their size to a level of uncertainty given by their standard deviation (seeTable 1). The expected PSD is illus-trated as a Gaussian distribution centered at the expected size and spread according to the corresponding standard deviation. The distributions obtained in this work are shown as number-based discrete probability density functions (PDF). For example, the dashed line inFig. 5a shows the PSD provided by the manufac-turer for spheres with nominal size of 300
l
m. The expected aspect ratio for spherical particles is 1.4.1.2. Raw data from image analysis without focus filter
The output of the image analysis framework is a set of size and shape descriptors for every object detected in the images. Using the projected length of the particle as a representation of the par-ticle size, the blue dotted line inFig. 5a shows the PSD obtained for spheres with nominal size of 300
l
m. Similarly, the blue dotted1 line inFig. 5b shows the corresponding aspect ratio distribution (ARD). These ‘‘raw” size and shape distributions include the contri-bution of both objects in and out-of-focus. Large deviation are observed in the PSD and ARD results with respect to the expected distributions. Although a weak contribution is observed around 300l
m in the PSD and at aspect ratios close to 1 in the ARD, one would not be able to distinguish the actual spherical particles if their size and shape were not known a priori. In fact, the most significant mode in the PSD corresponds to objects of 30–100l
m, and the pres-ence of elongated objects, as opposed to the expected circular parti-cles, is clearly visible in the ARD. Indeed, this can be attributed to the inclusion of partially detected objects in the measurement results. If however, a filter is applied to discard particles which are out-of-focus, the obtained measurement results improve significantly; solid line inFig. 5a and b. The selection of the focus filter is not straight-forward and it depends on the particulate system.4.1.3. Focus evaluation
One of the factors that has a bigger influence on the final results is the level of focus of the objects considered in the analysis. The
algorithm implemented in this work offers the possibility to impose a focus threshold based on one of different focus measure-ments calculated during image processing (see Section 3). This gives the opportunity to discard objects that are out-of-focus and could potentially lead to a misinterpretation of the actual particle size and shape distributions. However, as mentioned above, setting this threshold is not always straightforward, and the automation of this selection is object of future research. With the data currently available, the Gaussian derivative (GDER) focus measurement has shown to be the most sensitive parameter for focus evaluation. The result of implementing a focus threshold based on the GDER parameter for the particular case of polystyrene microspheres with a nominal size of 300
l
m is presented inFig. 6.Fig. 6a shows the effect of the focus threshold on the PSD. The more strict the focus filter, the more the measured PSD approaches the expected distri-bution. The peak near 30–100l
m reduces dramatically and the contribution of objects with a particle size of approximately 300l
m becomes predominant. However, increasing the focus thresh-old indefinitely does not provide the best estimate of the PSD. Fig. 6b shows the effect of the focus filter on the fraction/PS spheresof detected objects that can be considered as actual PS micro-spheres. This fraction is calculated as the area under the peak of the PDF in the region corresponding to the expected mode at 300
l
m (i.e. 198–398l
m, seeFig. 6a). The initial rise until a value of GDER of approximately 1035 corresponds to the rejection of small objects, as shown inFig. 6c. These objects are mainly pieces of actual particles which are out-of-focus but have been captured by the algorithm. An example is shown in the sample image 2 in Fig. 6c. As the value of GDER continues to increase, larger objects that correspond to overlapping particles (sample image 4) are also discarded and the PSD tends to center around the expected particle size. However, it becomes evident that after a certain value (GDER¼2:31036) the fraction of actual individual microspheres drops (seeFig. 6b). When the optimum focus threshold is reached, most overlaps have been discarded. Rising the focus threshold after this point results in a larger number of actual particles being filtered out with respect to the remaining smaller objects, as shown in Fig. 6c. Thus, the relative contribution of the main mode decreases. The final focus threshold is therefore selected as the one that pro-vides the largest fraction of particles corresponding to the expected mode.
[image:6.595.130.474.68.213.2]The selection of the criterion used to determine the most appro-priate focus threshold depends on the knowledge available on the system. For well-characterised systems such as the polystyrene microspheres used in this work, this selection is straightforward. However, when the characteristics of the system are unknown a priori, the decision can be more challenging. In those cases,
Fig. 5.Effect of focus evaluation on (a) particle size distribution and (b) aspect ratio distribution of standard polystyrene microspheres (298 ± 13lm, 1 wt.%). The images within the figure correspond to representative samples explaining different features observed in the distributions.
1
preliminary experiments might be required to identify the targeted windows of particle size and shape. Representations equivalent to Fig. 6a and c, can be utilised to identify the regions of interest within the population. Alternatively, the information provided by other sensors such as the FBRM probe could inform this choice. This strategy is particularly suited for time-varying systems.
The current procedure has been applied for a range of solid loadings (1–5 wt.%) for spherical particles of different sizes (150;300;400, 500
l
m), with similar results (see Fig. B.12 in Appendix B). Fig. 7 summarizes the most appropriate focusthresholds obtained for these systems. The resulting particle size and aspect ratio distributions obtained for these systems after the application of the focus filter are shown in Fig. B.14 in Appendix B(equivalent toFig. 5a).
[image:7.595.115.468.68.368.2]ObservingFig. 7, the size of the particles seems to have a strong influence on the focus threshold for particles smaller than 400
l
m. As observed inFig. 2a, at a fixed weight-based solid loading, the number of particles visible within the image frame is significantly larger for small particles and, therefore, the presence of particle overlaps is more probable. Generally, the standards on particle siz-ing through image analysis (i.e. ISO 13222-1:2014 (ISO 13322-1:2014,) and ISO 13222-2:2006 ISO 13322-2:2006,) recommend to discard overlapping particles from the analysis. However, these same standards acknowledge that this approach is challenging and not always possible, particularly for in-line image analysis, and suggest to investigate the influence of overlapping particles exper-imentally. The implementation of the focus threshold suggested in this work offers the possibility to discard overlaps in in-line imag-ing since these objects are generally less in focus. In fact, the higher focus thresholds required for smaller particles are a consequence of the rejection of overlapping particles. Additionally, particle over-laps are less problematic for larger particles. The closer they are to the dimensions of the image frame, the more chances exist for any overlap of these particles to fall on the edges of the frame and be automatically discarded. This explains the low variation between the focus thresholds of particles of 400 and 500l
m. Within the range of solid loadings analysed in this work, the concentration does not have a strong effect on the focus threshold. Consequently, when the approximate particle size range and solid loading are known (i.e. through preliminary experiments or other PAT), the appropriate focus threshold could be selected with the aid ofFig. 7.Fig. 7.Effect of solid loading on the optimal focus threshold for standard polystyrene microspheres of different sizes.
[image:7.595.65.252.561.730.2]4.1.4. Effect of particle size on PSD and ARD
Maintaining the accuracy in the estimation of PSD and ARD over the range of sizes accessible to the measuring instrument is key to the applicability of the image analysis framework developed in this work.Fig. 8a and b show the PSDs and ARDs of standard polystyr-ene microspheres of different sizes at a solid loading of 5 wt.%. Generally, once the focus filter is implemented, a good estimate of the expected PSDs is achieved by the image analysis algorithm for all the particle sizes included in this study. Additionally, the ARDs show the expected predominance of spherical objects of aspect ratio close to 1 in all cases. The consistent results observed at this particular solid loading are maintained for more dilute solu-tions as shown inFig. B.15inAppendix B.
A feature distinguishable in all PSDs inFig. 8a is the presence of a mode at small sizes (i.e. 30–100
l
m). As described previously in Section4.1.2, this contribution corresponds to a situation where objects that are out-of-focus have small parts within them that are considered to be in focus. The effect seems to become more sig-nificant as the size of the particles increases. The finite size of the PVM frames (1075825l
m, for the PVM V819 probe) is at the origin of this feature. As the particles become larger, their projec-tion has more chances to fall onto the edge of the image frame and be discarded. This generates a raise in the relative contribution of artefacts of small size, that have less chances to fall into the boundary of the image frame than the actual large particles, and can constitute an important bias for even larger particles.Different representations, such as volume-based distributions, emphasise the presence of larger particles and can be used when the detection of small objects is not essential. In this representa-tion, the contribution of every individual particle is weighted according to the volume of an ellipsoid with a major axis and two equal minor axes which lengths are approximated by the 2D length and width determined by the image analysis framework, respectively. The volume-based distributions are shown in Fig. B.16where the contribution of small artefacts is attenuated and the presence of larger particles becomes more evident with respect toFig. 8. It is always instructive to compare number and volume-based distributions because each of them provide valuable information. However, care has to be taken when using volume-based distributions since they have the potential to magnify the presence of agglomerates and overlaps that are larger than the actual particles, or to mask the existence of fines that can be critical in processes relying on secondary nucleation. Another option would be to apply a size filter to discard small objects. This can be a good solution when the characteristics of the particulate sys-tem are known a priori and the size of the particles of interest is always above the set threshold. However, when information on
the properties of the system is not available, a more careful analy-sis has to be carried out. Although these considerations can be important for other systems, the polystyrene microspheres anal-ysed in this work are well characterised using number-based dis-tributions since the main modes of the expected disdis-tributions are clearly identified in all cases.
In summary, the implementation of the focus filter results in more representative PSDs and ARDs. With this feature, the image analysis framework provides accurate estimation of particle size and shape distributions of polystyrene microspheres in the range 150–500
l
m and for solid loadings between 1 and 5 wt.%.4.2. Standard elongated particles
Having verified the results obtained for spherical objects of dif-ferent sizes and at difdif-ferent solid loadings, the next step is to expand the study to other particle shapes commonly found in crys-tallisation processes. In particular, this section analyses the particle size and shape distributions of model silicon microparticles of cuboid shape of different aspect ratios (see Fig. 2b). Systems formed by stable and well characterised elongated particles are rarely available. This unique set of standard particles provides the opportunity to address some of the challenges associated to the characterisation of elongated particles through imaging tech-niques. The experimental data for this system are made freely available (Cardona et al., 2018).
4.2.1. Expected particle size and shape distributions from 2D projections
The detected objects observed on the images obtained through in-line imaging techniques represent two-dimensional projections of three-dimensional particles. The orientation of the particles rel-ative to the focal plane plays an important role on the size and shape of the detected blobs. For non-spherical particles, even when the particle population consists of a single shape and size, the observed 2D projections will result in a distribution of sizes and aspect ratios. The spread of the observed distributions is a result of the particle orientations.
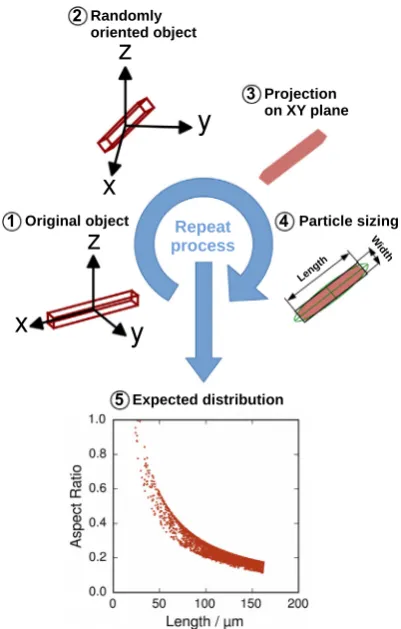
[image:8.595.132.476.574.723.2]In order to establish the projected particle size and aspect ratio distributions, a procedure based on Monte Carlo simulations can be utilised. Random rotations of the particles in the 3D space ensure the coverage of all possible projections. The method, based on Euler angles (Euler, 1776), assumes that particles have cuboid shape and that they do not have a preferred orientation with respect to the focus plane of the camera (i.e. the particles are ran-domly oriented).Fig. 9summarizes the methodology which obeys the following steps:
1. Select the three dimensions (length, width and thickness) of the cuboid representing the particle and position the cuboid along the x axis, centred at the origin of the coordinate system (x = 0, y = 0, z = 0).
2. Randomly select three Euler orientation angles (
u
;h;w) and rotate the original object by means of the following rotation matrix:This matrix performs three consecutive rotations: 1) around the z axis by an angle
u
, 2) around the x axis by an angleh, 3) again around the z axis by an angle w. This transformation can be expressed as C¼RC0, with C0 being a matrix representing the initial position of the vertices of the cuboid andC corre-sponding to the position of the rotated object.3. Once the final position is achieved, project the vertices of the cuboid onto a fixed 2D plane (e.g. XY plane in our case). 4. Follow the particle sizing procedure described in Section3:
Perform an ellipse fit around the projection.
Draw a bounding box around the object with the same ori-entation as the ellipse.
The longer and shorter sides of the bounding box are the length and width of the projection of the object, respectively.
Calculate aspect ratio of the projection as the ratio of width to length.
5. By repeating this procedure a sufficient number of times (106 times is sufficient in our case as shown inFig. C.17inAppendix C), an accurate representation of the expected particle size and shape distributions is obtained.
An example of the application of this method for cuboid parti-cles of 2020160
l
m is presented inFig. 9. The expected parti-cle size and shape distributions are shown as a scatter plot of aspect ratio and length where every data point corresponds to a different orientation of the particle. In this representation, a char-acteristic pattern is observed where most projections tend to clus-ter around a size of 160l
m and an aspect ratio of 0:175. However, a long tail, that corresponds to projections of decreasing probabil-ity, spreads until reaching the very unlikely possibility of having a particle in an orientation completely perpendicular to the focal plane of the camera. The non-uniform distribution of the cosine and sine functions contained in the rotation matrixRexplains this behaviour since longer projections are favoured on a linear scale. The expected distributions for particles of 202020l
m and 202060l
m can be found inFig. C.18a and b inAppendix C, respectively. The results from the Monte Carlo simulation demon-strate the ramifications of projecting 3D particles to a 2D plane only and do not consider image noise, out-of-focus and other experimental effects, and provide a benchmark for comparison of the image analysis framework outputs for elongated particles, as presented in Sections4.2.2 and 4.2.3.4.2.2. Raw data from image analysis without focus filter
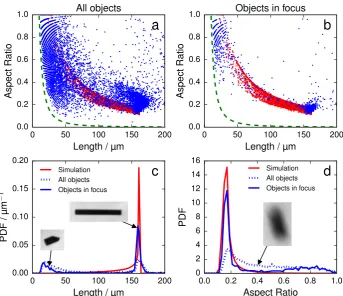
The particle size and aspect ratio distributions obtained apply-ing the image analysis framework without focus filter on experi-mental results generated using standard silicon particles of 2020160
l
m are shown inFig. 10a. The scatter plot in the fig-ure shows in blue the combination of length and aspect ratio of the detected object. In this case, no focus filter has been applied and the minimum area threshold is set to 100l
m2. This filter imposes a detection boundary and implies that objects with a given length and aspect ratio will be excluded explicitly. This threshold depends on the resolution limits of the imaging sensor and could allow smaller particles for instruments with enhanced image resolution. The boundary is illustrated in the figure with the green dashed line.The distribution of 2D projections when only random orientations are considered, i.e. without image noise, out-of-focus and other experimental effects, are shown in red1.Fig. 10b represents the length-aspect ratio scatter plot after the focus filter has been applied which will be discussed in Section4.2.3.
InFig. 10a, although a large number of data points (blue points) form a cluster near the high density region obtained from simula-tions (red points), with length approximately 160
l
m and aspect ratio 0:175, the dispersion is larger than expected. These features can also be observed inFig. 10c and d of the one dimensional PSD and ARD (dotted lines), respectively. As shown in the inset images of these figures, both partially out-of-focus objects and small fragments of particles contribute to the spread of the distri-butions. Unfortunately, a certain degree of particle breakage could R¼cosð
u
ÞcosðwÞ cosðhÞsinðu
ÞsinðwÞ cosðu
ÞsinðwÞ cosðhÞcosðwÞsinðu
Þ sinðu
ÞsinðhÞ cosðwÞsinðu
Þ þcosðu
ÞcosðhÞsinðwÞ cosðu
ÞcosðhÞcosðwÞ sinðu
ÞsinðwÞ cosðu
ÞsinðhÞsinðhÞsinðwÞ cosðwÞsinðhÞ cosðhÞ 2
64
[image:9.595.58.259.65.380.2]3 75
not be avoided in this experiment and small pieces of particles were detected by the algorithm (see fines in inset image of Fig. 10c).
Nevertheless, the initial estimates without focus filter are slightly better than the ones obtained for polystyrene micro-spheres (seeFig. 5). The position of the prominent modes according to the Monte Carlo simulations (red lines inFig. 10c and d) are reproduced by the image analysis framework even in the absence of a focus filter. The opaque nature of the silicon particles, at the wavelength of the light emitted by the PVM source, make them easier to detect by the image analysis compared to the transparent polystyrene microspheres. The intensity of the main modes, how-ever, is still underestimated due to the presence of out-of-focus particles that spread the distributions. Similar results are obtained for particles of 202020
l
m and 202060l
m as shown in Figs. C.19 and C.20, respectively. As it was the case for polystyrene microspheres, the implementation of a focus filter improves signif-icantly the estimation of particle size and shape distributions (Fig. 10b and solid blue line inFig. 10c and d) and is discussed fur-ther in the following section.4.2.3. Focus evaluation
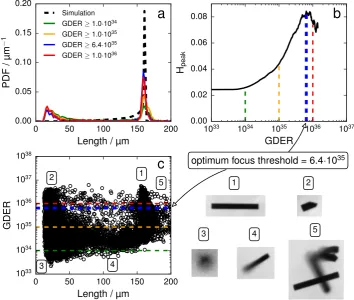
In previous Section4.1, the area under the curve of the PSD was used as a metric to evaluate the most appropriate focus threshold. This is a good metric to evaluate the performance of the focus filter for narrow monodispersed distributions. However, the broad shape of the PSD in elongated particles makes it ineffective. The presence of unwanted contributions, such as the fines observed for 2020160
l
m particles (seeFig. 10c), would contribute to that area under the PSD and bias the optimisation process. To avoidbias, it was decided to use the intensity of the main mode of the distribution (Hpeak) instead.
As mentioned previously in Section4.1.3, the selection of the criterion that determines the most appropriate focus threshold is not straightforward. For example, in other scenarios, such as pro-cesses where secondary nucleation is critical, detecting and quan-tifying the mode corresponding to the fines inFig. 10c would be essential. A metric that captures the bimodal nature of the system would be necessary. Hence, the user must be mindful of metrics used to select the focus threshold. In the case of the 2020160
l
m silicon particles, visual inspection (see Fig. 10c) identified particle fragments which are not of interest in this work and consequently the focus threshold evaluation metrics selected ignores the size range of the fines.discarded which have a wide range of sizes and the remaining objects form two main clusters; the fines (0–50
l
m) and the actual particles (160l
m). Objects even larger than 160l
m are mainly particle overlaps (e.g. image 5 inFig. 11c) and their contribution is insignificant. The most appropriate focus threshold is reached when the proportion of actual particles that are discarded by the filter exceeds that of the particle fragments and other artefacts.The effect of the focus evaluation parameter GDER in isolation (i.e. without the effects of unintended breakage and fines) can be observed more clearly in Figs. C.21 and C.22 for sizes 202020
l
m and 202060l
m respectively. In these cases, very limited breakage was observed and therefore the effect of fines is not significant. The initial deviations in particle size and shape distributions with respect to the simulations are mainly due to out-of-focus particles. Fig. C.21c is a perfect example of how discarding blurry out-of-focus objects reduces gradually the size of the particles toward the expected value. It should be noted that in both of these cases the optimal GDER parameter reported does not occur at the maximum value of the main mode of the PSD in Figs. C.21b and C.22b. In both of these cases, in order to ensure that the distributions have adequate population of particles (a minimum of 500 objects) and reliable statistics, the optimisation procedure is stopped before the maximum is reached. In order to observe the decreasing trend in the Hpeak, a larger number ofimages would be required.
However, the improvement of the performance of the image analysis framework, once the optimised focus filter is applied, is clearly visible in all cases.Fig. 10b (in the previous section), shows the particles that remain after the focus filter is implemented (blue
points) using the optimal GDER of 6:41035and how the population of detected objects concentrates around the expected values. When only objects in focus are considered, both one-dimensional PSD and ARD narrow down around the expected values to provide remark-able estimates of these distributions (see solid blue line in Fig. 10c and d, respectively). The presence of pieces of broken par-ticles explains the reminiscence of small objects of rather high aspect ratios and the slight underprediction of the expected posi-tion of the main mode of the PSD. An addiposi-tional feature to note is the underestimation of the contribution of intermediate sizes. This phenomenon can be attributed to the tendency of tilted objects to produce projections that appear partially out-of-focus (e.g. image 4 inFig. 11c) and which are therefore rejected by the focus filter.
[image:11.595.114.469.68.368.2]Despite these issues, the PSD and ARD determined by the image analysis framework for elongated particles are outstanding in the context of in-line imaging. The implementation of the focus filter yields an even more significant improvement for 202020
l
m and, particularly for 202060l
m silicon particles, as shown inFigs. C.19 and C.20, respectively. Although a small shift to larger sizes than expected is observed in both cases, this is jus-tified by the low availability of samples due to the more dilute nat-ure of these systems. As shown inFigs. C.21b andC.22b, it is not possible to reach the absolute optimal focus threshold while main-taining the statistical accuracy of the results by using at least 500 objects in the analysis. However, a larger availability of samples is expected to result in more accurate determination of the main modes of the PSD and the ARD for these systems. Furthermore, the main mode of the distributions is closer to the nominal size and shape of the 3D particles due to the rejection of the projectionsfrom tilted objects (image 4 inFig. 11c) which favours objects that align with the focal plane of the camera.
5. Conclusions
The evolution of the pharmaceutical and fine chemicals indus-tries towards a better control of particle attributes has generated a need for technologies that provide accurate in situ information on the state of the process. Several measurement techniques are being considered for this task, among which image-based tech-nologies have a great potential. They are able to provide two-dimensional information on size and shape of particles, in contrast to other monitoring techniques that rely on one-dimensional infor-mation. Algorithms to determine these particle attributes from images are well-established for off-line measurements. However, extracting information from in-line image-based measurements is still challenging. The main obstacles to overcome are that, as opposed to off-line techniques, objects are not necessarily always in focus and the possibility of overlaps is significantly higher. Addi-tionally, and although 2D characteristics extracted from images are closer to the true 3D particle attributes, they can still show signif-icant differences, particularly for needle-like particles.
In this context, this work develops an image analysis framework to extract accurate information from in-line images. The frame-work is based on digital image processing techniques and incorpo-rates usual features such as noise removal, object segmentation and the generation of size and shape descriptors. An adjustable minimum area threshold filters and rejects smaller sized objects according to the resolution limits of the imaging sensor. In addi-tion, the framework provides the option to implement a focus filter to discard objects that are out-of-focus and have a significant influ-ence on the final particle size and shape distributions. The image analysis framework is evaluated using in-line images of standard particles of known size and shape distributions captured by the PVM probe, although it could be applied to other imaging systems. Initially, polystyrene microspheres of various sizes are analysed. Spheres are the only shape for which the 2D features extracted from images match the true 3D particle attributes. The results show the importance of the implementation of a focus filter in order to obtain representative particle size and shape distributions. The optimal focus threshold is size-dependent and more restrictive thresholds are necessary for smaller particles for which the pres-ence of overlaps within the image frame is more significant. For larger particles, overlaps are more likely to fall onto the edge of the image frame and are automatically discarded from the analysis without the need for focus discrimination. Taking this into account, our approach shows to be consistent across the range of sizes (150–500
l
m) and solid loadings (1–5 wt.%) included in this work. The image analysis framework was also evaluated using more challenging systems such as model silicon particles of elongated cuboid shape. In this case, the characteristics extracted from the images are no longer equivalent to the 3D particle attributes, as it was the case for spherical particles. Therefore, it is necessary to determine the expected particle size and shape distributions through simulations of the 2D projections of 3D cuboids. Using these distributions as a base for comparison, the results show once again the significant improvement obtained by discarding out-of-focus particles from the analysis. This was evident for the three sets of silicon particles analysed in this work (202020l
m, 202060l
m and 2020160l
m). In all cases, the particle size and shape distributions extracted from the images narrowed down around the expected output when an optimised focus filter was applied. Additionally, for the longer particles, some degree ofparticle breakage occurred during the experiments. This was clearly detected by the image analysis algorithm, showing the abil-ity of the framework to track processes occurring at different size scales.
The selection criterion used to determine the most appropriate focus threshold is not always straightforward. When approximate knowledge of the expected particle size and shape is available, as it was the case for the systems studied in this work, the selection is simpler. However, for systems of unknown characteristics, the decision can be more challenging. The data generated by the image analysis framework is a good source of information and can aid the user to select the appropriate focus threshold. In practice, the com-bination of imaging with other PAT, such as FBRM could be employed to complement and potentially automate the selection of this paremeter. Complex systems characterised by multimodal distributions or time-varying processes will certainly benefit from this data fusion.
The image analysis framework has been implemented into a software which is made available in Cardona and Tachtatzis (2018). This software has already been used by this group to quan-titatively monitor realistic scenarios such as the wet milling of benzoic acid, paracetamol and metformin using in-line imaging techniques (Agimelen et al., 2017). This approach allows real-time characterisation and monitoring of particle attributes in pro-cesses involving evolution of particle attributes with time, with the ultimate goal of implementing the algorithm as part of control sys-tems in manufacturing processes.
Acknowledgments
This work was performed within the UK EPSRC funded project (EP/K014250/1) ‘Intelligent Decision Support and Control Tech-nologies for Continuous Manufacturing and Crystallisation of Phar-maceuticals and Fine Chemicals’(ICT-CMAC). The authors would like to acknowledge financial support from EPSRC, AstraZeneca and GSK. The authors are also grateful for useful discussions with industrial partners from AstraZeneca, GSK, Mettler-Toledo, Percep-tive Engineering and Process Systems Enterprise. The authors would also like to thank Kelvin Nanotechnology for assistance relating to particle fabrication and handling.
Appendix A. The image analysis framework
[image:12.595.353.523.618.732.2]A.1. Parameters of the image analysis framework
Table A.2.
Table A.2
Adjustable parameters of the image analysis framework and their default values.
Parameter Default value Noise removal - Median filter
Filter window size (pixels) 55 Laplacian of Gaussian filter
Filter window size (pixels) 101101
Standard deviation 0.23327 Edge detection
Threshold (on a 0–255 scale) 251 Object closing
Radius of disk (pixels) 8 Small objects filter
A.2. Definition of particle attributes
Area. Area is assessed by counting the total number of pixels that depicts an individual object and correlating this to real measurement dimensions.
Convex Area. Area of the convex hull of the object. It is evalu-ated by means of the same process used to determine the Area but applied to the smallest convex polygon that contains the object.
Perimeter. Obtained by adding up the distances between successive pixels that form the outer boundary of the original object.
Convex Perimeter. Perimeter of the convex hull of the object. It is evaluated by means of the same process used to determine the Perimeterbut applied to the smallest convex polygon that contains the object.
Circularity. Indicates the similarity to a circle and is calculated as:
Circularity¼
ffiffiffiffiffiffiffiffiffiffiffiffiffiffiffiffiffiffiffiffiffiffiffiffiffiffiffiffiffiffiffi 4
p
FilledArea Perimeter2 sðA:1Þ
where FilledArea represents the area of the original object with any existing holes filled in. The term under the square root is called Form Factor.
Convexity. Ratio of convex perimeter to perimeter. It gives an indication of the surface roughness.
Solidity. Ratio of area to convex area. It indicates the level of concavity within the particle.
Length. Longer side of bounding box. Width. Shorter side of bounding box. Aspect Ratio. Ratio ofWidthtoLength.
Eccentricity. Ratio of the foci of the ellipse to its semimajor axis length. It gives an indication of the elongation of the particle (0 for circles, 1 for line segments).
[image:13.595.69.470.263.605.2]Appendix B. Additional results for polystyrene microspheres
Figs. B.12–B.16.
Fig. B.15.Number-based particle size and aspect ratio distributions of standard polystyrene microspheres of different sizes at different solid loadings: 1 wt.% (a and b), 2 wt.% (c and d), 2.5 wt.% (e and f), and 3.3 wt.% (g and h). Dashed lines represent the expected particle size distributions as a Gaussian distribution with mean and standard deviation provided inTable 1. Solid lines correspond to the results obtained through the analysis of PVM images.
[image:18.595.125.478.572.722.2]Appendix C. Additional results for silicon particles
Figs. C.17–C.22.
[image:19.595.120.469.361.531.2]Fig. C.17.Effect of the number of iterations in the simulation of the 2D projection of randomly oriented cuboids of 2020160lm on (a) the particle size distribution, and (b) the intensity of the main mode of the distribution.
Fig. C.19.Effect of focus evaluation for silicon particles of 202020lm.
[image:20.595.130.477.413.713.2]Fig. C.21.Focus threshold selection for silicon particles of 202020lm.
[image:21.595.118.468.412.710.2]References
Abioye, A.O., Chi, G.T., Simone, E., Nagy, Z., 2016. Real-time monitoring of the mechanism of ibuprofen-cationic dextran crystanule formation using crystallization process informatics system (cryprins). Int. J. Pharm. 509 (1), 264–278. https://doi.org/10.1016/j.ijpharm.2016.05.066. URL
<http://www.sciencedirect.com/science/article/pii/S0378517316304562>. Agimelen, O.S., Jawor-Baczynska, A., McGinty, J., Dziewierz, J., Tachtatzis, C., Cleary,
A., Haley, I., Michie, C., Andonovic, I., Sefcik, J., Mulholland, A.J., 2016. Integration of in situ imaging and chord length distribution measurements for estimation of particle size and shape. Chem. Eng. Sci. 144, 87–100.https://doi.org/10.1016/j. ces.2016.01.007. URL <http://www.sciencedirect.com/science/article/pii/ S0009250916000087?via%3Dihub>.
Agimelen, O.S., Svoboda, V., Ahmed, B., Cardona, J., Dziewierz, J., Brown, C.J., McGlone, T., Cleary, A., Tachtatzis, C., Michie, C., Florence, A.J., Andonovic, I., Mulholland, A.J., Sefcik, J., Monitoring crystal breakage in wet milling processes using inline imaging and chord length distribution measurements. arXiv.org. URL<https://arxiv.org/abs/1703.09186>.
Barrett, P., Glennon, B., 2002. Characterizing the metastable zone width and solubility curve using lasentec FBRM and PVM. Chem. Eng. Res. Des. 80 (7), 799–805. https://doi.org/10.1205/026387602320776876. URL <http:// www.sciencedirect.com/science/article/pii/S0263876202722521?via%3Dihub>. Baxendale, I.R., Braatz, R.D., Hodnett, B.K., Jensen, K.F., Johnson, M.D., Sharratt, P., Sherlock, J.-P., Florence, A.J., 2014. Achieving continuous manufacturing: technologies and approaches for synthesis, workup, and isolation of drug substance. may 20-21, 2014 continuous manufacturing symposium. J. Pharm. Sci. 104 (3), 781–791.https://doi.org/10.1002/jps.24252. arXiv: URL <https:// onlinelibrary.wiley.com/doi/pdf/10.1002/jps.24252> <https://onlinelibrary. wiley.com/doi/abs/10.1002/jps.24252>.
Blagden, N., de Matas, M., Gavan, P., York, P., 2007. Crystal engineering of active pharmaceutical ingredients to improve solubility and dissolution rates. Adv. Drug Deliv. Rev. 59 (7), 617–630.https://doi.org/10.1016/j.addr.2007.05.011. drug Solubility: How to Measure it, How to Improve it. URL <http:// www.sciencedirect.com/science/article/pii/S0169409X07000828>.
Borchert, C., Temmel, E., Eisenschmidt, H., Lorenz, H., Seidel-Morgenstern, A., Sundmacher, K., 2014. Image-based in situ identification of face specific crystal growth rates from crystal populations. Cryst. Growth Des. 14, 952–971.https:// doi.org/10.1021/cg401098x.
Borsos, A., Majumder, A., Nagy, Z.K., 2016. Multi-impurity adsorption model for modeling crystal purity and shape evolution during crystallization processes in impure media. Cryst. Growth Des. 16 (2), 555–568.https://doi.org/10.1021/acs. cgd.5b00320.
Borsos, Á., Szilágyi, B., Agachi, P.Sß., Nagy, Z.K., 2017. Real-time image processing based online feedback control system for cooling batch crystallization. Org. Process Res. Dev. 21 (4), 511–519.https://doi.org/10.1021/acs.oprd.6b00242. Bujak, B., Bottlinger, M., 2008. Three-dimensional measurement of particle shape.
Part. Part. Syst. Charact. 25 (4), 293–297. https://doi.org/10.1002/ ppsc.200800027.
Calderon De Anda, J., Wang, X.Z., Roberts, K.J., 2005. Multi-scale segmentation image analysis for the in-process monitoring of particle shape with batch crystallisers. Chem. Eng. Sci. 60 (4), 1053–1065. https://doi.org/10.1016/j. ces.2004.09.068. URL <http://www.sciencedirect.com/science/article/pii/ S0009250904007316?via%3Dihub>.
Calderon De Anda, J., Wang, X.Z., Lai, X., Roberts, K.J., Jennings, K.H., Wilkinson, M.J., Watson, D., Roberts, D., 2005. Real-time product morphology monitoring in crystallization using imaging technique. AIChE J. 51 (5), 1406–1414.https://doi. org/10.1002/aic.10410. URL <http://onlinelibrary.wiley.com/doi/10.1002/aic. 10410/full>.
Calderon De Anda, J., Wang, X.Z., Lai, X., Roberts, K.J., 2005. Classifying organic crystals via in-process image analysis and the use of monitoring charts to follow polymorphic and morphological changes. J. Process Control 15 (7), 785–797.https://doi.org/10.1016/j.jprocont.2005.02.002. URL <http:// www.sciencedirect.com/science/article/pii/S0959152405000302>.
Cardona, J., Tachtatzis, C., 2018. Imagingapp: image analysis framework for particle size and shape characterisation. <https://doi.org/10.15129/99c4558f-f59e-4be8-80e2-b0425178332b>.
Cardona, J., Ferreira, C., McGinty, J., Hamilton, A., Agimelen, O.S., Cleary, A., Atkinson, R., Michie, C., Chen, Y.-C., Sefcik, J., Andonovic, I., Tachtatzis, C., 2018. Data for: Image analysis framework with focus evaluation for in situ characterisation of particle size and shape attributes (sample). https://doi.org/10.15129/b38fa44b-8d12-46ff-ae59-d6b31e6602a0. URL <https://doi.org/10.15129/b38fa44b-8d12-46ff-ae59-d6b31e6602a0>.
Chen, J., Wang, X.Z., 2005. A wavelet method for analysis of droplet and particle images for monitoring heterogeneous processes. Chem. Eng. Commun. 192 (4), 499–515.https://doi.org/10.1080/00986440590477908.
Davey, R., Garside, J., 2000. From Molecules to Crystallizers - An Introduction to Crystallization, vol. 86. Oxford Science Publications. URL <https://global. oup.com/academic/product/from-molecules-to-crystallizers-9780198504894>. El Arnaout, T., Cullen, P., Sullivan, C., 2016. A novel backlight fiber optical probe and
image algorithms for real time size-shape analysis during crystallization. Chem. Eng. Sci. 149, 42–50.https://doi.org/10.1016/j.ces.2016.04.025. URL <http:// www.sciencedirect.com/science/article/pii/S0009250916301889>.
Euler, L., 1776. Formulae generales pro translatione quacunque corporum rigidorum. Novi Commentarii academiae scientiarum Petropolitanae 20, 189– 207. URL <http://eulerarchive.maa.org//docs/originals/E478.pdf>.
Firestone, L., Cook, K., Culp, K., Talsania, N., Preston, K., 1991. Comparison of autofocus methods for automated microscopy. Cytometry 12 (3), 195–206.
https://doi.org/10.1002/cyto.990120302.
Fonteyne, M., Wickström, H., Peeters, E., Vercruysse, J., Ehlers, H., Peters, B.-H., Remon, J.P., Vervaet, C., Ketolainen, J., Sandler, N., Rantanen, J., Naelapää, K., Beer, T.D., 2014. Influence of raw material properties upon critical quality attributes of continuously produced granules and tablets. Eur. J. Pharm. Biopharm. 87 (2), 252–263. https://doi.org/10.1016/j.ejpb.2014.02.011. URL
<http://www.sciencedirect.com/science/article/pii/S093964111400071X>. Geusebroek, J.M., Cornelissen, F., Smeulders, A.W.M., Geerts, H., 2000. Robust
autofocusing in microscopy. Cytometry 39 (1), 1–9.https://doi.org/10.1002/ (SICI)1097-0320(20000101)39:1<1::AID-CYTO2>3.0.CO;2-J. URL <http:// onlinelibrary.wiley.com/doi/10.1002/(SICI)1097-0320(20000101)39:1%3C1:: AID-CYTO2%3E3.0.CO;2-J/full>.
Gratton, S.E.A., Ropp, P.A., Pohlhaus, P.D., Luft, J.C., Madden, V.J., Napier, M.E., DeSimone, J.M., 2008. The effect of particle design on cellular internalization pathways. Proc. Nat. Acad. Sci. 105 (33), 11613–11618.https://doi.org/10.1073/ pnas.0801763105. URL <http://www.pnas.org/content/105/33/11613>. Hagrasy, A.E., Hennenkamp, J., Burke, M., Cartwright, J., Litster, J., 2013. Twin screw
wet granulation: influence of formulation parameters on granule properties and growth behavior. Powder Technol. 238, 108–115. https://doi.org/10.1016/j. powtec.2012.04.035. special Issue: 5th International Granulation Workshop Granulation across the length scale 2011. URL <http://www.sciencedirect. com/science/article/pii/S003259101200277X>.
Hao, H., Barrett, M., Hu, Y., Su, W., Ferguson, S., Wood, B., Glennon, B., 2012. The use of in situ tools to monitor the enantiotropic transformation of p-aminobenzoic acid polymorphs. Org. Process Res. Dev. 16 (1), 35–41.https://doi.org/10.1021/ op200141z.
Huo, Y., Liu, T., Liu, H., Ma, C.Y., Wang, X.Z., 2016. In-situ crystal morphology identification using imaging analysis with application to the L-glutamic acid crystallization. Chem. Eng. Sci. 148, 126–139. https://doi.org/10.1016/j. ces.2016.03.039. URL <http://www.sciencedirect.com/science/article/pii/ S000925091630152X?via%3Dihub>.
ISO 13322-1:2014 Particle size analysis – Image analysis methods – Part 1: Static image analysis methods. 2014. URL<https://bsol.bsigroup.com/Bibliographic/ BibliographicInfoData/000000000030232145>.
ISO 13322-2:2006 Particle size analysis – Image analysis methods – Part 2: Dynamic image analysis methods. 2006. URL <https://bsol.bsigroup.com/ Bibliographic/BibliographicInfoData/000000000030116598>.
ISO 9276-6:2008 Representation of results of particle size analysis – Part 6: Descriptive and quantitative representation of particle shape and morphology. 1998. URL <https://bsol.bsigroup.com/Bibliographic/BibliographicInfoData/ 000000000030149834>.
Jiang, M., Zhu, X., Molaro, M.C., Rasche, M.L., Zhang, H., Chadwick, K., Raimondo, D. M., Kim, K.-K.K., Zhou, L., Zhu, Z., Wong, M.H., O’Grady, D., Hebrault, D., Tedesco, J., Braatz, R.D., 2014. Modification of crystal shape through deep temperature cycling. Ind. Eng. Chem. Res. 53 (13), 5325–5336. https://doi.org/10.1021/ ie400859d.
Kempkes, M., Vetter, T., Mazzotti, M., 2010. Monitoring the particle size and shape in the crystallization of paracetamol from water. Chem. Eng. Res. Des. 88 (4), 447–454. https://doi.org/10.1016/j.cherd.2009.09.006. URL <http:// www. sciencedirect.com/science/article/pii/S0263876209002330>.
Kempkes, M., Vetter, T., Mazzotti, M., 2010. Measurement of 3d particle size distributions by stereoscopic imaging. Chem. Eng. Sci. 65 (4), 1362–1373.
https://doi.org/10.1016/j.ces.2009.10.008. URL <http://www.sciencedirect.com/ science/article/pii/S0009250909007106>.
Khatibi, M., 2013. Experimental Study on Droplet Size of Dispersed Oil-water Flow (Master’s thesis). Norwegian University of Science and Technology. URL
<https://brage.bibsys.no/xmlui/handle/11250/235167>.
Klapwijk, A.R., Simone, E., Nagy, Z.K., Wilson, C.C., 2016. Tuning crystal morphology of succinic acid using a polymer additive. Cryst. Growth Des. 16 (8), 4349–4359.
https://doi.org/10.1021/acs.cgd.6b00465.
Kougoulos, E., Jones, A., Jennings, K., Wood-Kaczmar, M., 2005. Use of focused beam reflectance measurement (FBRM) and process video imaging (PVI) in a modified mixed suspension mixed product removal (MSMPR) cooling crystallizer. J. Cryst. Growth 273 (3), 529–534. https://doi.org/10.1016/j. jcrysgro.2004.09.032. URL <http://www.sciencedirect.com/science/article/pii/ S0022024804011546>.
Larsen, P., Rawlings, J., Ferrier, N., 2006. An algorithm for analyzing noisy, in situ images of high-aspect-ratio crystals to monitor particle size distribution. Chem. Eng. Sci. 61 (16), 5236–5248. https://doi.org/10.1016/j.ces.2006.03.035. URL
<http://www.sciencedirect.com/science/article/pii/S0009250906002156>.
Lim, J.S., 1990. Two-dimensional Signal and Image Processing. Prentice-Hall, Inc., Upper Saddle River, NJ, USA, pp. 469–476 (Chapter 8).
Lindeberg, T., 1994. Scale Selection for Differential Operators, vol. 256. Springer, US, Boston, MA, pp. 317–348. https://doi.org/10.1007/978-1-4757-6465-9_13
(Chapter 13).
Lindeberg, T., 1998. Feature detection with automatic scale selection. Int. J. Comput. Vision 30 (2), 79–116.https://doi.org/10.1023/A:1008045108935.
Liu, X., Sun, D., Wang, F., Wu, Y., Chen, Y., Wang, L., 2011. Monitoring of antisolvent crystallization of sodium scutellarein by combined FBRM–PVM– NIR. J. Pharm. Sci. 100 (6), 2452–2459.https://doi.org/10.1002/jps.22439. URL
<http://www.sciencedirect.com/science/article/pii/S002235491532102X?via% 3Dihub>.