Multi-scale surface simulation of the KDP crystal fly
cutting machining
Wanqun Chena*, Yingchun Lianga, Xichun Luob, Yazhou Suna, Heran Wanga
a. Center for Precision Engineering, Harbin Institute of Technology, Harbin 150001, P. R. China b. Department of Design, Manufacture & Engineering Management, University of Strathclyde, Glasgow, G1 1XQ, UK
W. Q. Chen, Tel: 86-0451-86413840, Fax: 86-0451-86415244, E-mail: [email protected]
Abstract: The paper presents a novel approach for modelling and simulation of the surface
generation in the potassium dihydrogen phosphate (KDP) crystal fly cutting machining process in
the macro, micro and nano scales, in order for the evaluation specifications in different spatial
frequency region. The main influential factors of surface topography in different scales are
discussed and modeled by different methods. The simulations take into account all the intricate
aspects of the machining process affecting the surface topography and texture formation, such as
the straightness of the slide, the dynamic performance of the machine tool, the cutter profile.
This method can realize the machine tool performance and machining parameters optimization by
the surface prediction and detection. The numerical calculation (NC) and the finite element (FE)
method are used in the macro and micro scales. Molecular dynamics (MD) simulation is used in
the nano scale. Furthermore, the proposed systematic modelling approach is verified by cutting
trials, which provide the coincident results of the simulated surface topography.
Keywords: Multi-scale simulation; dynamic performance; surface simulation; precision
machining
1.Introduction:
the fossil fuels, such as coal, petroleum, natural gas. These non-renewable energy promote the
rapid development of society, nevertheless, they have caused the unsustainable energy crisis.
Renewable sources such as solar, photovoltaic, and wind, will play an essential role in meeting
this challenge, but most countries do not have the storage capacity or available land to meet the
majority baseload power requirements. Therefore, finding new energy sources is imperative to
human survival and development. Scientists have been recognized that fusion energy can provide
a highly attractive solution to society's demand for safe and environmentally sustainable energy, at
a scale that meets our long-term need. Many countries have carried out the research of the Laser
Inertial Fusion (LIF), such as America, France, Britain, Japan, China.
Figure 1 shows the principle of the LIF: the low-energy beam is amplified in the preamplifier
module and then in the power amplifier, the main amplifier, and again in the power amplifier
before the beam run through the switchyard and into the target chamber to achieve nuclear fusion
[1-3]. The KDP crystal is the key optical element in this system, which is used as harmonic
frequency converters in the optical path, and can make frequency multiplication and optical
switching. However, the current low laser induced damage threshold (LIDT) of the KDP crystal
has become a bottleneck, which restricts the application and development of LIF system [4,5]. In
addition to the material qualities of KDP crystal, the topographic properties of surface especially
machined surface also affects the LIDT obviously [6]. Therefore, during the KDP crystal
machining, enough attention must be paid to the surface topographic generation. In the spatial
frequency region from 3.0×10⁻² to 8.3 mm-1, we define a maximum “waviness” in terms of a power spectral density (PSD). The PSD simply represents the square of the phase noise amplitude
KDP crystal in LIF system has extremely harsh requirements of the topography. In this study, the
specific indexes for the KDP crystal are as follows: It requires roughness values of less than 3 nm
in 0.01~0.12 mm; a root mean square (RMS) no more than 4.2 nm, and a PSD2 better than 15
nm2mm in 0.12~2.5mm; a RMS of less than 6.4 nm and PSD1 better than 15 nm2mm in 2.5~33
mm; and a gradient root mean square (GRMS) better than 11 nm/cm in the range over 33 mm [7].
In addition, the sub-surface damage will affect the light transmittance, so low sub-surface damage
is also needed. The KDP crystal is hygroscopic and heat-sensitive, so that traditional lapping and
polishing methods are not applicable for processing this material [8-10]. Therefore, the final
surface quality can only be achieved by fly cutting. High frequency roughness can cause beam
divergence and reduce the surface thermal damage resistance, medium and low spatial frequency
will lead to nonlinear self-focusing and reduce the laser damage threshold of the element. In order
to investigate the influence of machine tool performance and processing parameters on the surface
generation, a multi-scale simulation model of the fly cutting machining is urgently needed.
The process of surface generation has attracted a lot of research interest. Luo et al. presented
a surface generation model, containing the dynamic cutting process and the effects of machining
process variables and tooling characteristics [11]. Lee et al. proposed an ultra-precision cutting
surface modelling and simulation method based on machine tool kinematics and cutting theory
[12]. Zhou et al. established a dynamic cutting force model and studied its impact on the
generation of surface topography and texture in nano/micro cutting [13]. Sun et al. proposed a
quasi-continuum based multi-scale simulation method to investigate the nano-metric cutting of
single crystal aluminum [14]. Wang et al. presented a novel solution to the simulation of the KDP
wavelet analysis and orthogonal design methods [15]. All of them did outstanding works.
However, the ultra-precision machining differs from conventional machining as it deals with
physical phenomenon from the micro-scale of dislocations to the macro-scale of a cutting tool [16],
and most of the works to date focused on a particular aspect of the technology, and seldom of
which link up the different length scales which affect the quality of machined surface at the
macro-, micro- and nano-levels. Especially, for the KDP crystal used in the LIF, it has harsh
requirements of not only the roughness, but also the waviness and the profile accuracy, so it needs
the full scale simulation of the surface topography generation. Therefore, a multi-scale simulation
is presented in this paper based on the machine tool performance and processing parameters.
2.Multi-scale surface simulation of the fly cutting machining
The ultra-precision fly cutting machine tool used for KDP crystal machining is illustrated in
Fig. 2. A bridge supports a vertical-axis spindle and flycutter over a horizontal-axis slide. Mounted
to the horizontal slide is a vacuum chuck that fixing the workpiece by vacuum power. The surface
to be machined lies in a horizontal plane [17]. The influence of the processing parameters and the
machine tool performance on the surface morphology, such as flatness, waveness, roughness and
subsurface damage is given in Fig.2, respectively. That is to say, while the prediction model is
established, the influential factors can be controlled intentionally in terms of the desired surface
topography. The following text will discuss the influential factors and simulate the surface in the
macro, micro and nano scales, separately.
2.1 The macro scale surface simulation
Taking into account the structure type and kinematic chain of the machine tool, it can be
the dynamic stiffness of the machine tool, the rotation speed of the spindle, squareness error
between the spindle and the slide, and the chucking deformation of the workpiece. In this study
the squareness error between the spindle and the slide is excellent after testing, and chucking
deformation of the workpiece is small due to the vacuum adsorption. Therefore, only the first
three major factors are considered in the profile accuracy simulation. The straightness of the slide
is 0.8 μm in the 415 mm processing length as shown in Fig.3. The cutter will cut more on the
peaks of straightness, forming the valleys on the workpiece surface, and the cutter will cut less on
the valleys of the straightness, forming the peaks on the workpiece surface. The profile caused by
the straightness combining with the large-period waveness together, affecting the GRMS of the
machined surface. The waveness caused by the dynamic performance of the machine tool will be
discussed in the following.
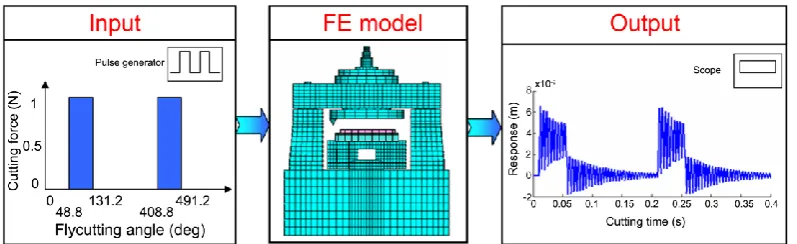
In order to gain the dynamic performance of the machine tool, an accurate FE model is built
according to the real machine model, as shown in Fig.4. The input is the periodically interrupted
cutting force and the output is the vibration of the tool which will form the waveness on the
surface. Fig.5 shows the dynamic performance of the machine tool. The relationship between the
period of the waveness and dynamic performance can be expressed by Eq. (1), which is shown
below: 0
cos
60
D nd n
T
(1)Where, d denotes the diameter of the flyhead (d=630 mm), n0 denotes the rotation speed of spindle
(n0=300 rpm),
denotes the maximum angle of the tangent direction in cutting process (
=0o),and TD denotes the period of the vertical stripes (TD =17.3 mm). According to Eq. (1), the
affects the GRMS, while the high-level frequency (larger than 300 Hz) will cause the small period
waveness (<33 mm) which affects the PSD1.
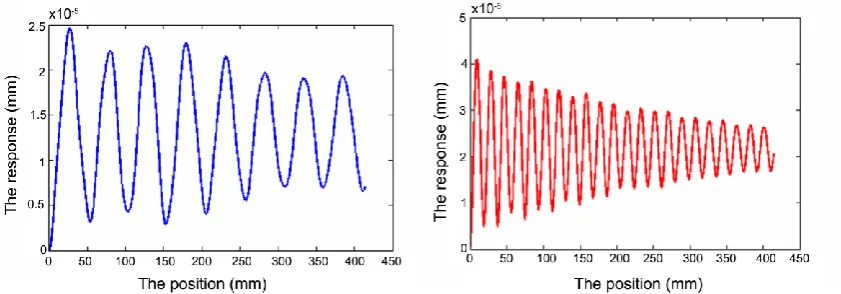
Fig. 6 shows the low and high levels frequency response of the tool tip under the cutting
force. The 3D surface is generated by combining the straightness with the dynamic response
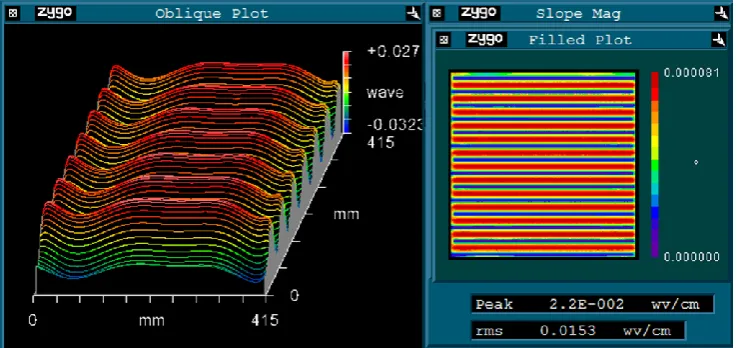
factors as shown in Fig. 7. In order to test the simulation surface by the test software Zygo, the
simulation surface results are changed into the format which can be read by Zygo. To test the
flatness index GRMS, which with only tip, tilt, and piston removed, the low pass filter is used and
the high-pass frequency is 0.0303 mm-1, the test result shows GRMS is 0.0153 wv/cm (9.685 nm/cm), as shown in Fig.8. And in order to get the PSD1 index, the band pass filter is used, the
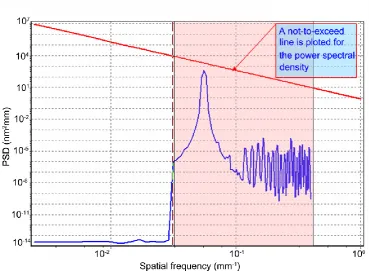
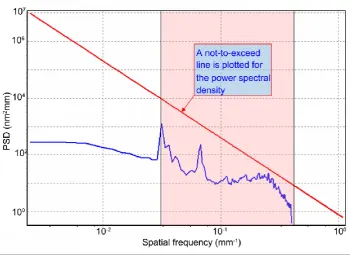
high-pass frequency is 0.4 mm-1 and the low-pass frequency is 0.0303 mm-1, the test result in this frequency region shows the RMS is 3.251 nm in Fig.9. Fig.10 shows that the PSD1 in this region
are all bellow the not-to-exceed line for the PSD.
2.2.The micro scale surface simulation
As shown in Fig.11, when the spindle is rotating, it has runout in axial and radial directions.
The runout in radial direction will affect the cutting depth, and when the feed is small, it will cause
cutting interference phenomenon [18], leading to different residual height. While the runout in
radial direction will affect the cutting area and feed per revolution. The runout of the spindle both
in axial and radial directions is tested by spindle error analyzer (Lion Precision, Automated
Quality Technologies, USA), as shown in Fig.12, the spindle runout in axial direction is 20 nm,
the spindle runout in radial direction is 30 nm. In the roughness simulation model, the spindle
runout in both axial and radial directions are considered.
are: the feed is 75 μm/s, the spindle rotation speed is 300 r/min and the nose of the cutter tool is 5
mm. The simulation result shows that the roughness of the surface is 3nm.
2.3.The nano scale surface simulation
In order to study the influence of the tool geometry on sub-surface damage of the machined
surface, the MD simulation is carried out in nano scale. In this simulation model, two cutter tools
are compared, one is straight edge, the other is circular blade. As shown in Fig.14, it can be noted
that under the same cutting parameters, such as the cutter depth and the cutting speed, the cutter
tool with circular blade will cause smaller sub-surface damage thickness, with 18 layers of atoms
compared with 20 layers of atoms caused by the cutter tool with straight edge. Although the
simulation scale is very small compared with the real situation, it can give that the cutter tool with
circular blade is qualitatively better than the cutter tool with straight edge from the sub-surface
damage point of view. Therefore, in order to get the smaller sub-surface damage, the cut tool with
circular blade should be used.
3. Experimental verification
Machining trials are carried out on the ultra precision fly cutting machine tool whose
performance is used in the simulation model to validate the model and simulation. The same
machining parameters as in the simulation are used in the processing experiments. The
experimental results are examined by a 3D rough surface tester, Wyko RST-plus (Veeco
Metrology Group, Santa Barbara, CA, USA), which has a 500mm vertical measurement range and
3 nm vertical resolution. The test result is read by the software Zygo. The measurement results
with only tip, tilt, and piston removed, are shown in Figure 15-18. It shows that the GRMS of the
RMS is 3.8 nm, the roughness is 2 nm. The test results are in good agreement with the analytical
and simulation results, which verifies the validity and reliability of the simulation model.
4.Conclusion:
To bridge the gap between the surface topography generation and the machine tool
performance, a multi-scale modelling method of the fly cutting process is presented in the macro,
micro and nano scales, with the comprehensive consideration of the machining parameters and the
performance of the machine tool. The following conclusions can be drawn.
1.The multi-sacle modelling method contributes to more comprehensive and better understanding
of the relationship between the surface generation and the machine tool performance, and realizes
the prediction of the surface morphology in different scales, which is more efficient and
economical.
2.The influential factors for different scales are discussed and used in the surface modelling. The
influence of the machining parameters on the surface in different scales is discussed. By
modelling the surface with different machining parameters, we can get different surfaces, and the
test software shows the results of the modelling surface morphology. Through this method, the
optimization of the parameters such as the spindle rotation speed and the feed speed can be
achieved.
3.The successful development of the model-based system realizes the prediction of the influence
of the machine tool performance on the surface. It can help to quantitatively analyze the influence
of machine performance indicators such as the straightness, dynamic stiffness and natural
frequency on the surfacemorphology, and lead us to a better understanding of the ultra-precision
4. These experimental tests evaluate and validate that the proposed simulation approach is
effective and efficient in multi scale surface prediction. It indicates that the proposed simulation
approach can be used as a powerful tool for the machine tool performance and machining
parameters optimization, which also enables the machining results meet the machining
requirements.
5. Acknowledgment
The authors gratefully acknowledge financial support of the National Science Fund for
Distinguished Young Scholars of China (grant number 50925521), The Sino-UK Higher
Education Research Partnership for PhD Studies program, and China Scholarship Council (CSC).
Reference
[1] E. Moses, Multi-Megajoule NIF: Ushering In A New Era in High Energy Density Science,
Proc. of SPIE 7005 (2008) 1-11.
[2] Keith Carlisle, Machine Tool Developments in Ultra Precision Manufacturing,
http://www.cern2012.euspen.eu/content/News-and-events/euspen-events/CERN%202012/Presenta
tions/B1%20Keith%20Carlisle%20-%20Machine%20Tool%20Dev.pdf
[3] https://lasers.llnl.gov/about/nif/how_nif_works/index.php
[4] M.Q. Li, M.J. Chen, C.H. An, L. Zhou, J. Cheng, Y. Xiao, W. Jiang, Mechanism of
micro-waviness induced KH2PO4 crystal laser damage and the corresponding vibration source,
Chin. Phys. B 21 (2012) 1-9.
[5] M.J. Chen, M.Q. Li, J. Cheng, Y. Xiao, Q.L. Pang, Study on the optical performance and
characterization method of texure on KH2PO4 surface processed by single point diamond turning,
[6] M.J. Chen, Q.L. Pang, J.H. Wang, K. Cheng, Analysis of 3D micro topography in machined
KDP crystal surfaces based on fractal and wavelet methods, International Journal of Machine
Tools and Manufacture 48 (2008) 905-913.
[7] M.L. Spaeth, K.R. Manes, C.C. Widmayer, The National ignition facility wavefront
requirements and optical architecture. Opt Eng 43 (2004) 2854-2865.
[8] P. Lahaye, C. Chomont, P. Dumont, J. Duchesne, G. Chabassier, Using a design of experiment
method to improve KDP crystal machining process, SPIE 3492 (1999) 814-820.
[9] Y.C. Liang, W.Q. Chen, Q.S. Bai, Y.Z. Sun, G.D. Chen, Q. Zhang, Y. Sun, Design and dynamic
optimization of an ultraprecision diamond fly cutting machine tool for large KDP crystal
machining, Int J Adv Manuf Technol (2013) 69:237–244.
[10] W.Q. Chen, Y.C. Liang, Y.Z. Sun, D.H. Huo, L.H. Lu, H.T. Liu, Design philosophy of an
ultra-precision fly cutting machine tool for KDP crystal machining and its implementation on the
structure design, Int J Adv Manuf Technol (2014) 70:429–438.
[11] X. Luo, K. Cheng, R. Ward, The effects of machining process variables and tooling
characterisation on the surface generation. Int J Adv Manuf Technol 25 (2005) 1089-1097.
[12] C.F. Cheung, W.B. Lee. Modelling and Simulation of Surface Topograhpy in Ultra-precision
Diamond Turning. Proc. IMechE Part B: J. Engineering Manufacture 214 ( 2000) 463~480.
[13] L. Zhou, K. Cheng, Dynamic cutting process modelling and its impact on the generation of
surface topography and texture in nano/micro cutting, Proc. IMechE Part B: J. Engineering
Manufacture 223 (2009) 247-265.
[14] X.Z. Sun, K. Cheng, Multi-scale simulation of the nano-metric cutting process. Int J Adv
[15] H.X.Wang, W.J. Zong, T.Sun, Q.Liu, Modification of three dimensional topography of the
machined KDP crystal surface using wavelet analysis method, Applied Surface Science 256 (2010)
5061-5068
[16] W.B. Lee, C.F. Cheung, S. To, Multi-scale modelling of surface topography in single-point
diamond turning, Journal of Achievements in Materials and Manufacturing Engineering 24 (2007)
260-266.
[17] Y.C. Liang, W.Q. Chen, Y.Z. Sun, G.D. Chen, T Wang, Y. Sun, Dynamic design approach of
an ultra-precision machine tool used for optical parts machining, Proc IMechE, Part B: J
Engineering Manufacture 226(2012) 1930-1936.
[18] C.F. Cheung, W.B. Lee. A theoretical and experimental investigation of surface roughness
formation in ultra-precision diamond turning. International Journal of Machine Tools and
Figure captions:
Fig.1 The principle of the LIF.
Fig.2 The influence of the machine tool parameters on the surface morphology.
Fig.3 The straightness of the slide.
Fig.4 The dynamic response of the machine tool.
Fig.5 The dynamic performance of the machine tool.
Fig.6 The low and high level frequency response under the cutting force.
Fig.7 The 3D simulation surface of the workpiece.
Fig.8 The simulation GRMS test result.
Fig.9 The simulation RMS test in PSD1 region.
Fig.10 The simulation PSD test in PSD1 region.
Fig.11 The spindle runout and the generation of the surface.
Fig.12 The test spindle runout in axial and radial directions.
Fig.13 The simulation result of the roughness.
Fig.14 The MD simulation for different cutter profile.
Fig.15 The test result of GRMS.
Fig.16 The test RMS result in PSD1 region.
Fig.17 The test PSD result in PSD1 region.
Fig.1 The principle of the LIF.
[image:13.595.121.514.319.556.2]Fig.3 The straightness of the slide.
Fig.4 The dynamic response of the machine tool.
[image:14.595.119.478.499.736.2]Fig.6 The low and high level frequency response under the cutting force.
[image:15.595.162.465.319.571.2]Fig.8 The simulation GRMS test result.
[image:16.595.131.498.317.480.2]Fig.10 The simulation PSD test in PSD1 region.
Fig.11 The spindle runout and the generation of the surface.
[image:17.595.115.481.561.672.2]Fig.13 The simulation result of the roughness.
[image:18.595.132.510.442.654.2]Fig.15 The test result of GRMS.
Fig.16 The test RMS result in PSD1 region.
[image:19.595.115.466.482.737.2]