Development of a Controlled Environment Near-Field Optical Microscope
for Organic Thin Film Studies
Tai-De Li,a,bAnto Regis Inigo,aWunshain Fanna,b( ),
Jonathon D. Whitec* ( ), Yi-Fang Huanga( ) and Pei-Kuen Weid( ) a
Institute of Atomic and Molecular Sciences, Academia Sinica, Taipei 106, Taiwan, R.O.C. b
Department of Physics, National Taiwan University, Taipei 106, Taiwan, R.O.C. c
Department of Photonics Engineering, Yuan Ze University, Neili, Taoyuan 320, Taiwan, R.O.C. d
Research Center for Applied Sciences, Academia Sinica, Nankang, Taipei 115, Taiwan, R.O.C.
The requirements of a microscope differ greatly from field to field and with the sample being studied. Organic thin films are highly sensitive to environmental conditions being rapidly photobleached in the presence of oxygen. In this paper we introduce the design of a low cost near field optical microscope suit-able for environmentally controlled studies. We demonstrate that reducing ambient pressure to ~10 mTorr (1.3 Pa) of nitrogen (a pressure accessible with a mechanical pump) significantly reduces photo-bleaching on a typical experimental timescale. In addition, we introduce a novel non-optical feedback control mech-anism combining a piezoelectric diaphragm with a tuning fork. The morphology of thin films of MEH-PPV spin cast from the polymer dissolved in chlorobenzene is investigated. These films are shown to be featureless on a 100 nm length scale in terms of topology, PL intensity and PL spectrum both before and during photo-bleaching. As far as we are aware these are the first reported thin films of MEH-PPV grown in which ~100 nm sized domains are absent. We believe that the ability to control environment will not only allow better optical characterization of thin films but also opens up the possibility of the production of novel two dimensional organic photonic crystals through a combination of mechanical disruption, photo-bleaching and photo-conjugation of polymers.
Keywords: Near field optical microscopy; MEH-PPV; Organic thin films; Luminescent conju-gated polymer; Controlled environment; Shear-force feedback.
INTRODUCTION
The performance of luminescent conjugated polymer light emitting devices (PLEDs) is largely determined by sample preparation. Seemingly minor modifications in pro-cessing have been observed to have a profound effect on both the resulting films’ optical properties2and charge transport (i.e. hole mobility) characteristics.3 Paradoxi-cally, charge carrier mobility has been reported to vary greatly in films of MEH-PPV (a soluble derivative of poly (phenylenevinyle) having identical (far-field) photolumi-nescence (PL) spectra.4This suggests that local morphol-ogy, in terms of sub-micron domains, may play an
impor-tant role in charge transport and photo-physics.
Efforts have been made to correlate PL and topogra-phy on the nanometer scale making use of near-field scan-ning optical microscopy (NSOM) and shear force micros-copy. In thin films of MEH-PPV, Nguyen and coworkers5 observed that topographic features (bumps) and local PL spectra were generally correlated for thin films of MEH-PPV which had been prepared from polymer dissolved in chlorobenzene (CB) and tetrahydrofuran (THF). A similar set of experiments performed by Huser and coworkers6 with toluene as the solvent did not find any correlation be-tween topography and PL intensity variations. In both
cases, the characteristic feature size was ~20 nm in height and a few hundreds of nanometers in diameter.
A difficulty faced in such studies is that organic films are very sensitive to atmospheric oxygen and light. Al-though quite stable when kept in the dark or in a nitrogen environment, rapid photo-oxidization or photo-bleaching occurs on continuous excitation under atmospheric condi-tions. Local spectroscopic experiments are thus are not re-peatable (i.e. the measurement modifies the film). While nitrogen purging offers some improvement, it is generally not sufficient to allow for an extensive investigation of ob-served features. In confocal microscopy photo-bleaching is reduced by depositing a protective layer of aluminum on top of the film being studied.7This is clearly not possible for NSOM as the tip must approach the film surface. Our earlier measurements from time-of-flight (TOF) have shown that the MEH-PPV is stable under dynamic vacuum4 sug-gesting that operating a NSOM under a controlled environ-ment may solve these problems.
The idea of operating a NSOM under non-atmo-spheric conditions is not a new idea. For example, in 1999 Gray and Hsu reported on their development of a variable cryogenic temperature near-field scanning optical micro-scope.8 In 2005, the development of a reflection mode NSOM capable of operation in an ultrahigh vacuum envi-ronment was reported9Clearly the application for which a microscope is to be used will determine its design. While the physical studies for which the above microscopes were designed require that they operate under extreme condi-tions (e.g. ultra-high vacuum, cryogenic temperatures), less stringent requirements in terms of expense, apply to studies of organic thin films. In particular, for thin film studies one must be able to:
– control and vary the pressure in a range from mTorr to atmosphere,
– control and vary the partial pressures of the sample environment,
– excite a limited region of the sample (i.e. illumina-tion not collecillumina-tion mode),
– collect photo-luminescence at a high signal to noise ratio (i.e. high numerical aperture collection optics).
In this paper we discuss the development of a con-trolled environment near-field scanning optical micro-scope that meets these requirements. In addition, the design is simple, relatively low-cost, and user-friendly (in terms of
facilitating relatively easy changing of the optical fiber). The microscope is applied to a study of MEH-PPV thin films produced using the solvent chlorobenzene. In con-trast to previously reports regarding thin films of MEH-PPV,5,6these films are topologically featureless, exhibiting identical PL intensity and PL spectrum across the surface. The placing of the NSOM in a controlled environment is shown to significantly reduce photo-bleaching on the ex-perimental time scale. However, the soft organic films are shown to be susceptible to mechanical damage. The latter effect may be useful in patterning of the conjugated sub-strate.
MICROSCOPE DESIGN
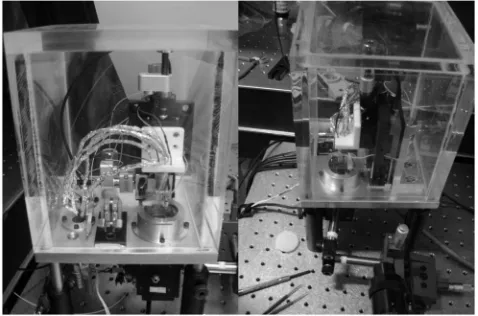
A picture of the microscope is shown in Fig. 1. The design of the microscope is comprised of three sub-tems, namely, mechanical and vacuum system, optical sys-tem, and a novel non-optical feedback control mechanism to monitor tip-sample separation. These three systems will be discussed separately.
1. Mechanical Hardware
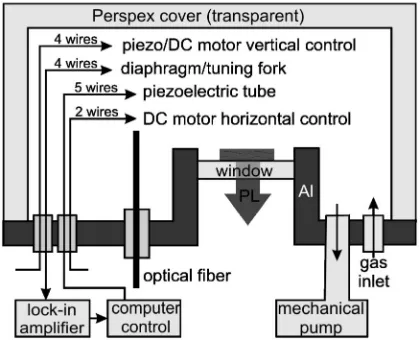
[image:2.595.306.545.523.681.2]A schematic of the mechanical system is shown in Fig. 2. The environmental chamber (17 cm´17 cm´21 cm high) was composed of an Al base (13 mm thick) and a re-movable Perspex (Lucite) cover (20 mm thick). A single O-Ring (3 mm in diameter) inserted into a groove ma-chined in the Al base seals the junction between the base and cover. The metal base had five vacuum sealed
throughs and one glass window. Two feedthroughs (Souriau) were used for electrical connections. Two feedthroughs – one connected to a gas supply and the other to a low cost mechanical vacuum pump – allow the environment and pressure within the chamber to be controlled dynamically. The transparent cover allowed the approach of the tip to be monitored by a microscope placed outside the chamber. Plastic tubes (instead of metal) were used in order to mini-mize the transmission of vibration from the mechanical pump to the chamber. In the case of the experiments being described here, the gas supply port was connected to a dry nitrogen cylinder. Before observations, the chamber was evacuated to 10 mTorr and flushed repeatedly with the dry nitrogen gas to remove any residual oxygen. Experiments were then performed after keeping the vacuum running for few hours. The remaining feedthrough was used for an op-tical fiber to couple light into the system.
Position control was accomplished using a combina-tion of manual and motor mechanisms mounted on the metal base inside the chamber. A small actuator drive stage with large horizontal displacement (New Focus Picomotor Actuator-translation stage-9065) was used to position the sample to allow various regions to be scanned. For vertical movement, a translation stage with both manual and DC motor capability (New Focus Picomotor Actuator-transla-tion stage 9065) was used to approach the tip to the sample. Before closing the system, the manual part was used to ap-proach the tip to within few hundredsmm of the sample. Once the environmental conditions at which the
experi-ment was to be conducted had been reached, the actuator is used to bring the tip to within 50mm of the sample. An ad-ditional piezoelectric driven stage (Melles Griot, 50mm Piezo range) was used to bring the sample and tip into shear force range. Actual three-dimensional scanning of the tip over the sample was performed using a segmented piezo-electric tube (Stavely Sensors, EBL piezoceramic tube, length = 0.5”, outside diameter = 0.25”, width = 0.02”).10
A total of fifteen electronic ports (grouped into two feedthroughs) were used to connect wires from inside to outside the chamber. Five wires were used to control the segmented piezoelectric tube (1 for each of the 4 segments + 1 ground). Two wires were used to vary the sample re-gions to be scanned. Four wires were used to control the DC motor (New Focus) and piezo-electric adjustable stage (Melles Griot) used for the final approach of the tip to the sample surface. The remaining four wires were used to im-plement the tip-sample control system.
The above mechanical system allowed for the envi-ronmental control and both high and low pressure opera-tion. In addition, all electrical components can be shut off as the chamber is filled and flushed with nitrogen. This is important since a short circuit may develop between the high-voltage applied to the segmented piezoelectric tube and the tuning fork. (At atmospheric pressure gases are in-sulators. The few existing free charges collide with neutral molecules before gaining sufficient energy from the elec-tric field to ionize them. However, as the pressure is low-ered, the mean free path of free charges (inversely propor-tional to the number density of gas molecules) increases and the free charges acquire sufficient energy from the electric field to ionize other molecules resulting in electri-cal breakdown. As pressure is furthered lowered (below 100 mTorr, 10 Pa), the mean free path exceeds the electrode separation (i.e. between the segmented piezoelectric tube and the tuning fork) and the free charges rarely collide with gas molecules. Electrical breakdown thus does not occur and the high voltage components can be turned on again.)
We note that operation in a sealed environment also allows for the elimination of air currents resulting in in-creased topographic resolution as has been previously ob-served.11
2. Optical System
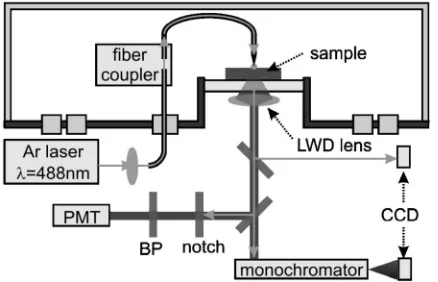
[image:3.595.65.275.518.688.2]Three kinds of light pass freely through the chamber:
the visible light that allows the sample and tip to be seen us-ing a conventional microscope, the laser light used to excite the sample, and the photoluminescence emitted by the sam-ple. The use of a Perspex cover allowed the sample to be clearly seen with visible light. Fig. 3 illustrates the optical paths of the excitation light and the emitted photolumines-cence both inside and outside of the chamber. Laser light was first coupled into a commercial fiber and a commercial fiber optic vacuum pressure feed-through (OZ Optics) was used to couple the fiber into the vacuum chamber. A fiber coupler (Thorlabs) transferred light into a short section of chemically etched and aluminum coated fiber used for the tip. This allows mounted fiber tips to be easily replaced. Light passing through or emitted from the sample (sub-strate + holder thickness = 3 mm), after passing through a window (2 mm thick, Fig. 2), was collected from the bot-tom of the vacuum chamber using a long working distance (LWD) objective lens (M-40X, Nikon, N.A. 0.5, working distance 10.1 mm). The 10.1 mm long working distance is sufficient to allow focusing on the fiber tip. We note that while it is possible to place an objective lens inside the en-vironment chamber, experience has shown that repeated cycling from high to low pressure greatly reduces the life-time of the objective. A beam splitter directs some of the light into a CCD for alignment while the remaining light was directed into either a PMT (Hamamatsu R1104P) or monochromator/CCD (Santa Barbara Instrument Group
ST-7Ei) for PL emission analysis. In the work described here, an air-cooled Ar-ion laser (Ion laser technology,l= 488 nm) was coupled into the fiber. For PL detection, a 488 nm notch filter and a band pass filter were placed before the PMT. After taking a topographical and optical image, a few points on the sample surface were selected to record the lo-cal PL spectra. Tips were prepared by chemilo-cal etching fol-lowed by Al-coating rather than the conventional pulling technique as the chemical etching technique allows for a larger apex angle at the tip. (A larger apex angle allows for better feedback stability and greater optical throughput.12)
3. Tip-sample separation control
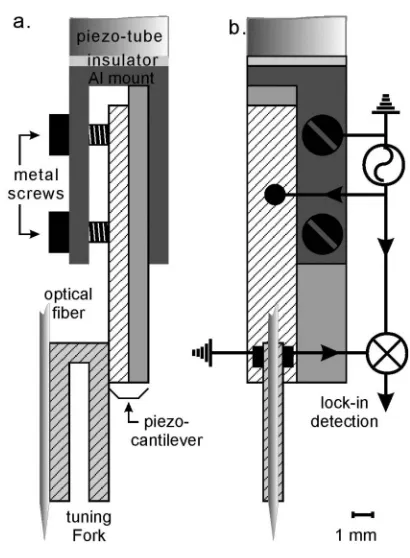
[image:4.595.62.281.496.637.2]A vital part of the NSOM system is the control of sample-tip separation. In most experiments, a NSOM is op-erated in constant separation mode using the so called “shear force” to provide information on the tip-sample sep-aration. This has the additional advantage of allowing a topographical image to be obtained simultaneously with the optical image. Generally this is accomplished by vibrat-ing the fiber (usvibrat-ing a piezo-electric material) and monitor-ing the resonance frequency of the fiber as it approaches the surface. A number of techniques have been proposed to monitor this change in resonance frequency. The first method applied in NSOM involves direct optical monitoring of the tip.13,14While possible, collection of the diffracted light is somewhat troublesome when the NSOM is placed inside a chamber.11Non-optical methods are much more conve-nient in this situation. The most common non-optical method involves exciting a tuning fork at its resonance frequency using a peizoelectric tube and then monitoring the vibra-tion of the fiber tip.15,16Unfortunately, replacing the fiber tip assembly is not a simple procedure. An alternative method, involving a single piezo-electric diaphragm17or bimorph18for both excitation and detection, has been pro-posed for shear force sensing. In this work, we employ a hybrid of the two technologies in which a piezoelectric tun-ing fork is attached to a piezoelectric diaphragm for signifi-cantly greater ease of mounting. As shown in Fig. 4(a), the optical fiber is glued onto a tuning fork which is in turn af-fixed vertically onto the piezoelectric diaphragm. As shown in Fig. 4(b), two wires are used for driving the piezoelectric diaphragm which in turn drives the piezoelectric tuning fork at its resonance frequency. The two wires attached to the tuning fork detect changes in the piezotension-induced
voltage as the tip approaches the surface. The signal was fed into the lock-in amplifier along with the original excit-ing sinusoid. The lock-in amplifier output was then fed into a computer which controlled the vertical position of the fi-ber (Fig. 2). Two screws allow the whole assembly to be firmly mounted on, and easily demounted from, the end of the piezoelectric tube. The Q of the whole assembly (with tip) was 200-400.
MICROSCOPE CHARACTERIZATION
1. Sample Preparation
Poly(2-methoxy-5-(2¢-ethylhexyloxy)-1,4-phenyl-enevinylene) (MEH-PPV) was synthesized via the Gilch method following in general the procedure reported by Wudl and coworkers.19,20The resulting polymer (Mw~ 250 kD, poly-dispersityd= 6.5 as obtained from Gel perme-ation chromatography (GPC) measurements) had a tetrahe-dral defect density of ~ 2% as obtained from NMR mea-surements. MEH-PPV was dissolved for several weeks in
chlorobenzene. During this process, the solution was kept in a dark, inert nitrogen atmosphere. The polymer solution was taken out of the nitrogen box and spin-cast onto pre-cleaned glass slides to form a 60 nm thick MEH-PPV thin film (as measured by a Dektak 3030 Surface Profiler). The spin-coated film was then placed in an inert atmosphere for six hours. The remaining solvent, along with any adsorbed oxygen, was removed by storing in high vacuum for 12 hours. Throughout processing, neither the solution nor film temperature was raised above room temperature.
2. Photo-bleaching
The key purpose for designing this microscope is to allow experiments to be performed, i.e. spectra taken, re-producibly without worrying about photobleaching. Fig. 5 compares the PL intensity as a function of time for an MEH-PPV film in air and under low pressure dynamic vac-uum (~10 mTorr nitrogen). The measurements are taken a low power in the far field to eliminate any effect due to probe-sample interaction. As seen in the figure, the PL in-tensity drops rapidly for the exposed film dropping to 80% within the first 50 s. In contrast, under dynamic vacuum, the intensity remains above 97% for over two minutes, only dropping to the 80% level after 5 minutes of continuous ex-citation. Assuming five seconds are required to take a spec-trum with a moderate quality spectrometer, it is clear that the problem of photo-bleaching has been overcome on an experimental time scale.
[image:5.595.66.271.387.666.2]3. Probe effects
Fig. 6 highlights the decay in the integrated PL
inten-Fig. 4. Schematic of the combination piezoelectric tuning fork and piezoelectric diaphragm used for reliable control of the sample-probe separa-tion. (a) Side view (oscillation direction is in the plane of the page) (b) Front view showing the electrical connections.
[image:5.595.356.496.552.656.2]sity over time with the probe in contact (shear force range) and slightly out of contact with the sample surface. With the probe withdrawn, the total PL intensity remains over 97% for over two minutes, similar to that seen in the far field. However, with shear-force feedback turned on, the situation is quite different with a 25% drop in intensity dur-ing the first 120 seconds. This drop is much more than would be expected from far field (Fig. 5) measurements. The extreme dependence of this effect on the probe-sample separation, suggests that in addition to photobleaching, an-other mechanism may be contributing to the decrease in PL intensity — either heat induced (due to the high light inten-sity near fiber tip)21-23or mechanical resulting from the shear force interaction between tip and sample.
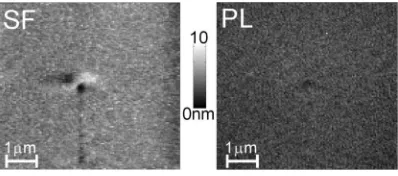
Fig. 7 (taken after recording Fig. 6) provides an in-sight into a possible mechanism. This figure shows that not only has PL intensity been reduced at point were the local PL spectra were taken (Fig. 7(b)) from ~60 to ~20 but also
that there has been topological damage to the film’s surface at the same point (Fig. 7(a)). In contrast to the flatness of the rest of the scan area, the region surrounding the point where the spectrum was taken have been disturbed, with a small depression forming where the tip interacted with the surface and a small hill has appearing to one side of this de-pression. This feature is much more consistent with the me-chanical mechanism than with an optical or thermal mecha-nism. This interpretation was checked by moving to a dif-ferent point on the film, turning the laser off to eliminate heating, while maintaining tip in shear force contact. Thirty minutes later the topographic and optical images around the point were recorded. As seen in Fig. 8(a) topographic damage is severe with a similar depression and hill. Corre-sponding contrast is seen in the PL image (Fig. 8(b)). The intensity drops from ~35 to ~20 units at the depression. The magnitude of the intensity drop is consistent with the view that the observed drop in signal results from mechanical displacement of the film rather than a heating mechanism.
[image:6.595.101.239.372.475.2]While it is tempting to contribute this decrease in sig-nal to the reduced film thickness (~25%) at the point in question, it is more likely the result of a reduced coupling efficiency of light as the probe passes over the depression. It is well known that there may be considerable coupling of topography with the optical signal in NSOM images.24 Consider, for example, collection mode NSOM: As the tip scans across the surface, what one measures is not the abso-lute value of PL emitted from the sample but rather the frac-tion collected by the tip. The latter is a convolufrac-tion of the emitted light and a spatially dependent coupling efficiency. Above small mechanical depressions, this coupling effi-ciency may be reduced, resulting in a reduction in collected
Fig. 6. Comparison of the time evolution of PL inten-sity with probe in contact and probe withdrawn slightly out of shear-force feedback range. Data is taken under low pressure (~10 mTorr nitrogen) conditions at a single point in the film under constant optical excitation at 488 nm.
[image:6.595.326.525.563.651.2]Fig. 7. Topographic (a) and optical (b) image after tak-ing the PL at one point (A in Fig. 4(a)) for 15 minutes. The scale bar in the lower right corner of the figures is 1mm in length. Scan direction is from left to right first and from bottom to top second.
[image:6.595.72.270.567.654.2]light. The reverse is true in illumination mode. Thus we be-lieve that the reduction in collected PL (relative to the un-perturbed surface) is primarily due to a reduction in cou-pling efficiency as the probe passes over the depression rather than the reduction in film thickness. In any case, this suggests that mechanical displacement of the film associ-ated with shear force feedback plays the dominate role in the decreased intensity observed.
4. Resolution
The resolution of a NSOM system is primarily de-pendent on the processing of the optical fibers rather than instrumentation. While the image in Fig. 7 suggests that the optical resolution of the system exceeds 100 nm, the FWHM of the feature in Fig. 7b is not sufficient to deter-mine the exact spatial resolution due to coupling between the spatial and optical signal channels.25Exact calibration of spatial resolution requires topographic flatness coupled with well defined optical contrast on the nanometer scale. In related work, using similar fibers and NSOM system op-erating under atmospheric conditions, we clearly achieved 100 nm resolution demonstrated using a machined 100 nm width slit.26
In summary, a low pressure condition of ~ 10 mTorr (obtainable with a simple mechanical pump), is thus suffi-cient to eliminate photo-damage. Fluorescent optical im-ages with high spatial and spectral resolution can thus be recorded. We note that the effect of the tip on the surface could be eliminated by reducing the spectrum acquisition time using a low dark count detector (i.e. a liquid nitrogen cooled CCD), or taking measurements in constant height
mode (shear-force feedback off).
APPLICATION TO ORGANIC THIN FILM CHARACTERIZATION
1. Topography
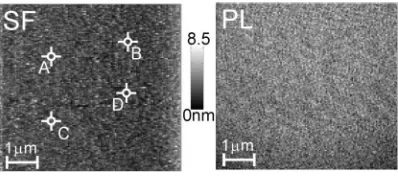
Fig. 9(a) presents the topographic image of the film as observed using shear force microscopy taken at ~10 mTorr under dynamic vacuum. The film is topographically smooth and featureless over the 36mm2region with the maximum height variation of 8 nm. In previous work, in films formed from toluene, condensed MEH-PPV phases having a height of 10-20 nm and diameters ranging from 20 to 1000 nm were clearly visible.6(Similar features have also been ob-served for films formed from chlorobenzene and tetrahy-drofuran.5) In the film investigated here there is no evi-dence of any such domains. If such domains existed near the surface, they should be clearly visible given the nano-meter sensitivity of the shear force mechanism under low pressure.11It is possible that small domains (< 10 nm in size) may lie below the surface of the 60 nm thin films and thus not be visible.
2. Photoluminescence image
Fig. 9(b) presents the photoluminescence image of same area of the MEH-PPV thin film whose topography was shown in Fig. 9(a). The image is taken in at a pressure of 10 mTorr of nitrogen. The film exhibits a uniform and featureless optical PL image. There was no significant dif-ference in optical images taken at the emission wave-lengths of 590 nm and 630 nm. On a larger scale, similar re-sults were obtained with a far-field confocal laser scanning system (350 nm resolution). While contrast, in the form of hot spots, has been seen in the PL images of thin films formed from toluene,6the absence of any such contrast in the present work suggests that the present films are quite uniform.
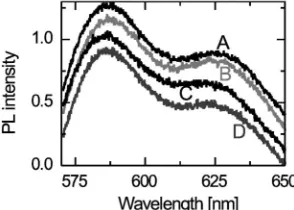
[image:7.595.71.270.547.635.2]3. Local (near field) photoluminescence spectra A final method of optically characterizing the films is to look for local variations in PL spectra that would be av-eraged out in the far field. Such local variations allow one to identify areas of the film in which emission is dominated by single chain components or interchain components.6 Fig. 10 presents the local spectra at four points (taken at
points A, B, C, and D, as identified on Fig. 9(a)). Local PL spectra taken at different locations on the sample were identical not only with each other but also with conven-tional spectral measurements taken in the far-field. This suggests that a homogeneous distribution of optically active morphological structures exists.
4. Effect of photobleaching on PL spectrum
The stability of the local PL spectrum of our films was investigated using the same low pressure dynamic vac-uum and film. Typical results are shown in Fig. 11. The lo-cal PL spectrum, integrated over a 30 second interval, is shown at 7 points in time (each separated by 2 minutes) for a continuously optically excited sample. Two things are ob-vious from the figure: there is a continuous decrease in in-tegrated PL intensity over time, and there is no change in the shape of the PL spectra – even after long exposure. Pre-vious NSOM studies of MEH-PPV in air have shown that photo-bleaching is accompanied by spectral change due to
either preferential quenching of single chain vs. aggregates or longer segments vs. short segments.5,27This is clearly not the case in the films investigated here. Taken together, the above measurements show that featureless films (in terms of topology, PL intensity, PL spectrum on the scale of 50-100 nm) of MEH-PPV can be produced using chloro-benzene as a solvent.
CONCLUSIONS
In summary, a low-cost controlled environment near-field scanning optical microscope has been developed. Op-eration in a nitrogen environment of a few mTorr is shown to significantly reduce photo-bleaching in environmentally sensitive organic films on the typical experimental time-scale. In this paper, we have reported on the first featureless films (in terms of topology, PL intensity and PL spectrum on a ~50 nm length scale) of MEH-PPV to be produced. We believe that this type of controlled environment micro-scope should facilitate environment studies on response of organic thin films to oxygen and vapor in the presence of light.
This research is supported by MOE Program for Pro-moting Academic Excellence of Universities and by Na-tional Science Council Program for Nanoscience and Nano-technology.
Received April 14, 2010.
REFERENCES
1. Wei, P. K.; Fann, W. S. Rev. Sci. Inst.1998,69, 3614-3617. 2. Chen, S. H.; Su, A. C.; Chou, H. L.; Peng, K. Y.; Chen, S. A.
Macromolecules2004,37, 167-173.
3. Inigo, A. R.; Tan, C. H.; Fann, W. S.; Huang, Y. S.; Perng, K.Y.; Chen, S. A. Adv. Mater. (Weinheim, Ger.)2001,13, 504-508.
4. Inigo, A. R.; Chiu, H. C.; Fann, W. S.; Huang, Y. S.; Jeng, U.; Lin, T. L.; Hsu, C. H.; Peng, K. Y.; Chen, S. A. Phys. Rev. B 2004,69, 075201.
5. Nguyen, T. Q.; Schwartz, B. J.; Schaller, R. D.; Johnson, J. C.; Lee, L. F.; Haber, L. H.; Saykally, R. J. J. Phys. Chem. B 2001,105, 5153-5160.
6. Huser, T.; Yan, M. Synth. Met.2001,116, 333-337. 7. Sun, W. Y.; Hsu, J. H.; Yang, S. C.; White, J. D.; Fann, W. S.
J. Lumin.2002,98, 41-44.
8. Gray, M. H.; Hsu, J. W. P. Rev. Sci. Instrum. 1999, 70, 3355-3361.
[image:8.595.96.243.382.487.2]9. Hoppe, S.; Ctistis, G.; Pagge, J. J.; Fumagalli, P. Rev. Sci. Instrum.2005,76, Art. No. 063704.
Fig. 10. Variation of local PL spectra of the MEH-PPV thin film with position. Spectra are recorded at four different points (Marked A, B, C and D in Fig. 9(a)) in the low pressure nitrogen envi-ronment. Spectra are offset for clarity (From Ref. 28, Fig. S4).
[image:8.595.96.251.555.685.2]10. Binnig, G.; Smith, D. P. E. Rev. Sci. Instrum. 1986,57, 1688-1689.
11. Polonski, V. V.; Yamamoto, Y.; White, J. D.; Kourogi, M.; Ohtsu, M. Jpn. J. Appl. Phys., Part 21999,38, L826-L829. 12. Saiki, T.; Mononobe, S.; Ohtsu, M.; Saito, N.; Kusano, J. T.
Appl. Phys. Lett.1996,68, 2612-2614.
13. Yang, Y. T.; Heh, D.; Wei, P. K.; Fann, W. S.; Gray, M. H.; Hsu, J. W. P. J. Appl. Phys.1997,81, 1623-1627.
14. Wei, P. K.; Fann, W. S. J. Appl. Phys.1998,83, 3461-3468. 15. Karrai, K.; Grober, R. D. Appl. Phys. Lett.1995,66,
1842-1844.
16. Hsu, J. W. P.; Lee, M.; Deaver, B. S. Rev. Sci. Instrum.1995,
66, 3177.
17. Bai, Y.; White, J. D.; Zhang, G.; Chen, G.; Hou, X. Appl. Phys. Lett.1999,75, 2731-2733.
18. Shang, G. Y.; Wang, C.; Wu, J.; Bai, C. L.; Lei, F. H.Rev. Sci. Instrum.2001,72, 2344-2349.
19. Askari, S. H.; Rughooputh, S. D.; Wudl, F.Synth. Met.1989,
29, E129-134.
20. Wudl, F. U.S. Patent No. 5,189,136, 1990;Chem. Abstracts 1993,118, 255575p.
21. Stähelin, M.; Bopp, M. A.; Tarrach, G.; Meixner, A. J.; Zschokke-Gränacher, I. Appl. Phys. Lett.1996,68, 2603-2605.
22. Larosa, A. H.; Yakobson, B. I.; Hallen, H. D. Appl. Phys. Lett.1995,67, 2597-2599.
23. Ambrosio, A.; Allegrini, M.; Latini, G.; Cacialli, F. Appl. Phys. Lett.2005,87, Art. No. 033109.
24. Paesler, M. A.; Moyer, P. J. Near-Field Optics: Theory, In-strumentation, and Applications; Wiley-Interscience: New York, 1996; p 197 and Fig. 8.23.
25. Hecht, B.; Bielefeldt, H.; Inouye, Y.; Pohl, D. W.; Novotny, L. J. Appl. Phys.1997,81, 2492-2498.
26. Wei, C. H.; Tsao, P. H.; Fann, W. S.; Wei, P. K.; Tegenfeldt, J. O.; Austin, R. H. J. Opt. Soc. Am. B2004,21, 1005-1025. 27. Huser, T.; Yan, M. J. Photochem. Photobiol., A2001,144,
43-51.