This is a repository copy of
The effect of acoustic diffusers on room mode decay
.
White Rose Research Online URL for this paper:
http://eprints.whiterose.ac.uk/101635/
Proceedings Paper:
Angus, J A S, Marvin, A C orcid.org/0000-0003-2590-5335, Clegg, J et al. (2 more authors)
(1995) The effect of acoustic diffusers on room mode decay. In: Audio Engineering Society
99th Convention, 6-9 October 1995, New York, USA. , pp. 1-13.
[email protected]
https://eprints.whiterose.ac.uk/
Reuse
["licenses_typename_other" not defined]
Takedown
If you consider content in White Rose Research Online to be in breach of UK law, please notify us by
The Effect of Acoustic
Diffusers
on
Room Mode Decay
J A S ANGUS, A C MARVIN, J CLEGG, J F DAWSON and A KNOBLOCH
Department of Electronics, University of York, York, England YO1 5DD
This paper discusseswhat modaldecay is,the effect of diffuserson room mode decay using a simple theoretical model, and the implications of this model on their bandwidth and decay. The theory indicates that the decay rate increases and gives a relationship between this and the diffuser order. Measurements supporting the simulated results are also presented.
0 INTRODUCTION
Studios, concert halls, control and dubbing rooms, reverberation chambers, or any place where high quality acoustics are required, need to have an even decay of reverberant sound field at all frequencies. In ord6r for this to happen the sound field, must be diffuse and the absorption in the space must be uniform at all frequencies. Traditionally, plaster mouldings, niches and other decorative surface irregularities have been used to provide diffusion in an "ad hoc" manner. More recently diffusion structures based on patterns of wells whose depths are formally defined by an appropriate mathematical sequence have been proposed and used. [1-7].
However, in many practical applications the acoustic designer is faced with small rooms in which to work. In these rooms modal behaviour at low frequencies significantly affects the quality of the reverberant decay. This is because the modes tend to decay more slowly, due to their non-diffuse nature compared with other frequencies. Diffusion seems to help and diffusers may be a useful way of improving the low frequency performance of such rooms. However to do this we need to understand more fully the effect of _tiffusers in rooms, particularly at the lower frequencies where modal behaviour becomes significant.
The purpose of this paper is to discuss the effect of diffusers on room mode decay. The paper will first discuss what is meant by modal decay. It will then discuss the effect of diffusers on room mode decay using a simple theoretical model. We will then discuss the implications of this model on the bandwidth and decay of room modes. The theoretical model indicates that the modal decay rate increases and gives a relationship between the diffuser order and the decay. We will present measurements on an electromagnetic scale model of a reverberant room which show the beneficial effect of diffusers on room decay.
Angus, J. A. S.; Marvin, A. C.; Clegg, J.; Dawson, J. F. & Knobloch, A. , "The effect of Acoustic Diffusers on Room Mode Decay" , Audio Engineering Society 99th Convention , 1-13 , October 1995.
I WHAT DO WE MEAN BY MODAL DECAY?
When a room is excited by an impulse the sound energy is reflected from its surfaces. At each reflection some of the sound is absorbed and therefore the sound energy decays exponentially. Ideally the sound should be reflected from each surface with equal probability, forming a diffuse field. This results in a single exponential decay with a time constant proportional to the average absorption in the room, However in practice not all the energy is reflected in a random fashion. Instead some energy is reflected in coherent cyclic paths which form standing waves in the room. These standing waves have pressure and velocity distributions which are spatially static and so behave differently to the rest of the sound in the room in the following ways:
· They do not visit each surface with equal probability. Instead a subset of the surfaces are involved.
· They do not strike these surfaces with random incidence. Instead a particular angle of incidence is involved in the reflection of the standing
wave.
· They require a coherent return of energy back to an original surface, a cyclic path. This is of necessity strongly frequency dependent and so these paths only exist for discrete frequencies which are determined by the room geometry.
This different behaviour has the following consequences:
· The standing wave is not absorbed as strongly as sound which visits all surfaces. This is due to both the reduction in the number of surfaces visited and the change in absorption due to non-random incidence.
· This reduction in absorption is strongly frequency dependent and results in less absorption and therefore a longer decay time at the frequencies at which standing waves occur. These are known as the modal frequencies. · The decay of sound energy in the room is no longer a single exponential
decay with a time constant proportional to the average absorption in the room. Instead there are several decay times. The shortest one tends to be due to the diffuse sound field whereas the longer ones tend to be due to the modes in the room. This results in excess energy at those frequencies which the attendant degradation of the sound in the room
Figure 1 A Modal System
2 THE EFFECT OF DIFFUSION ON MODES
This section presents a simple model of the effect of diffusion on room modes and then discusses the implications of the model.
2.1 A Simple Model of the Effect of Diffusion
Consider the following situation, two parallel reflecting surfaces separated by a distance L metres (see figure 1):
If we consider the impulse response of this arrangement we see that it is a regular train of impulses separated by 2/, seconds. This gives us a frequency
C
response consisting of a infinite set of resonances with zero bandwidth at frequencies given by:
/'lC
-- where n=l,2 ... (1) 2L
Now suppose that the reflectors only reflect part I of their energy back in the
N
normal direction the rest being scattered away from this cavity. So after n reflections the energy (e) shuttling between the reflectors is given by:
£ = e 0 (2)
The time taken for this is given by:
nL
t=--
(3)
so
tc
n=-- (4)
L
thus the energy after n reflections can be rewritten as: tc
This can be converted into the more convenient form:
(t(C)ln(1))
E L N
-- =e (6)
E0
which can be rewritten as:
E -tCln(N)
-- = e L (7)
E0
which we can compare to: t
E
----=e * (8)
E0
the equation for a simple exponential decay.
Thus the model shows that the effect of diffusion on a given modal structure is similar to that of absorption. That is the energy within the modal structure decays exponentially with a time constant 'cwhich depends on the amount of energy lost to the modal system via either diffusion or absorption.
2.2 Implications
Equation (8) shows that the effect of scattering energy from a modal structure is similar to that of absorption as far as that particular modal structure is concerned. That is energy trapped in a particular cyclic path decays exponentially. However unlike absorption the energy is not lost instead it is scattered and so is available to either:
· Be reflected in a random manner around the room and thus form part of the diffuse field.
In both cases the sound energy is more likely to visit all surfaces with a variety of angles of incidence. This will have the following beneficial effects on modal energy:
· It will visit all surfaces instead of just a subset and the probability that a given surface is visited will become more equal to the other surfaces. · It will strike these surfaces with 'angles of incidence which are more
random as opposed to the particular angles of incidence associated with a given mode.
· There will be a reduced cyclic retum of coherent energy back to an original surface.
This will have the following consequences:
· The standing wave will tend to be absorbed as strongly as sound which visits all surfaces. This is due to both the increase in the number of surfaces visited and the change in absorption due to more random incidence.
· The decay of sound energy in the room will be closer to a single exponential decay with a time constant proportional to the average absorption in the room, instead of several decay times. This will result in less excess energy at modal frequencies with an attendant improvement of the sound in the room.
Thus the overall effect will be to smooth the decay of sound energy in the room as a function of both time and frequency.
We can also predict that the effect of diffusion would be to broaden the mode bandwidth, assuming none of the scattered energy returns coherently. This is because the energy scattered from a particular modal path is equivalent to a loss for that particular one. From equations (7) and (8) we can show that:
L
*=-- (9)
c In(N)
and from this we can say that the effective bandwidth of the mode is given by
Bw = c ln(N) (10)
ltl
we can use this bandwidth to define the "Q" of the lowest mode in a given modal structure, the higher order modes will have a higher "Q" because the bandwidth is constant. This "Q" is given by:
2_r
"Q"=-- (11)
for reasonable ratios (say 7) this gives a "Q" of about 3.
2.3 Discussion
The above analysis must be treated with some caution because it assumes that the scattered energy does not return to the modal system coherently. Unfortunately as the energy is still trapped in the room it may well return coherently thus causing a mode. However, the likelihood is that the path of the energy return will be much longer and thus act as if it comes from a larger room so providing a higher mode density.
2.4 Summary
The effect of diffusion on modes is two-fold.
· The decay time of the modes become similar to that of the rest of the frequency range.
· The effective bandwidth of the mode is increased.
3 EXPERIMENTAL RESULTS
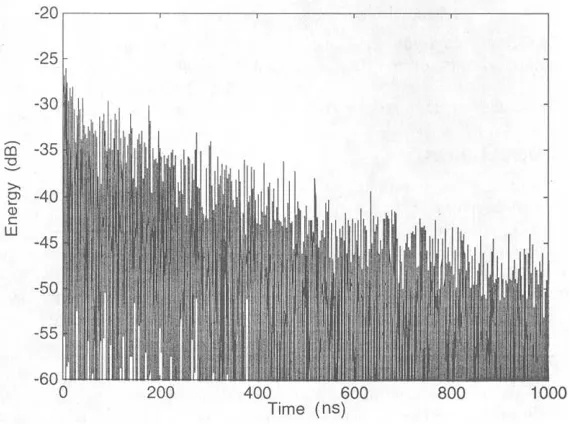
To test the above ideas we measured an electromagnetic model of a reverberant room in the frequency range 0 - 3GHz. For ease of construction and simulation we used two level pseudo-random sequences. These are less than ideal as they have a restricted frequency range of approximately one octave. However, they should give us some idea of room mode decay over the range in which they work. The box simulated was 0.9m by 0.45m by 0.45m with treatment on all the walls and ceiling but not the floor. This is a less than ideal set of room dimensions as they are all commensurate. The sequences were all bi-level and were all parts of the same sequence. The sequence depth was 0.045m which corresponds to a design frequency (_/{4)of 1666MHz. Two conditions were measured. The first was that of a completely empty box. The second was the same box but with a pseudorandom sequence on only one of the long walls. The reflected energy, over a frequency range of 0 - 3000MHz, for both the untreated and the treated boxes respectively. This is equivalent to measuring the received energy from a co-located source and receiver. The measurements were carried out in the frequency domain using a network analyser and then were converted into time domain responses using the FFT algorithms present in MATLAB. The results are shown in figures 1, 2, 5, 7 and 9 for the empty box and figures 3, 4, 6, 8, and 10 for the box with one treated wall.
has been informally observed by Peter D'Antonio [8], in some of the studios in which he has installed low frequency diffusion structures.
The remaining figures show the spectrum of the decaying energy in the empty room (figures 5, 7 and 9) and the treated room (figures 6, 8, and 10). These spectra were derived from the impulse response of the room by performing a fourier transform on a portion of the impulse response that was after the initial rapid decay, that is after about 500ns. Figures 5 to 8 used a rectangular window whereas figures 9 and 10 used a Hann!ng window.
Figures 5 and 6 compare the broadband decaying spectrum for the empty and treated box respectively and from them one can see two things.
· The presence of more modes in the treated box this is especially noticeable between 1000MHz and 1500MHz (the design frequency of the diffuser is
1666MHz). There also seems to be some mode splitting of the lowest modes.
· A reduction in the peak to peak spectral variation for the treated room compared to the untreated room.
Both the above effect are indications of improved diffusion in the box after treatment.
Figures 7 and 8 show the spectra with higher resolution in the range 1500MHz to 1700MHz which is around the design frequency of the diffuser. Again these show the presence of additional modes in the treated box. They also seem tO indicate that the bandwidth of the modes are higher in the treated box.
The final two figures ( 9 and 10) show the same spectrum derived using a Hanning window on the impulse response this has the effect of smoothing the spectra obtained. Again these spectra confirm that the effect of the diffuser is to both increase the number of modes and to reduce the spectral variation.
4 CONCLUSION
We have presented an analysis of the effect of diffusers on room mode decay which demonstrates that they are effective in .both improving the decay and increasing the effective modal bandwidth. This should have the effect of reducing the spectral variation and the diffuse field in a room. Measurements on an electromagnetic scale model confirm these hypotheses and also indicate an improvement in the mode density. These results augur well for the development of techniques to improve the low frequency behaviour of rooms.
5 ACKNOWLEDGEMENTS
6. REFERENCES
[1] Schroeder, M R, "Diffuse Sound Reflection by Maximum-Length Sequences." Journal of the Acoustical Society of America, 57, January 1975.
[2] Schroeder, M R. "Progress in Architectural Acoustics and Artificial Reverberation: Concert Hall Acoustics and Number Theory," Journal of the Audio Engineering Society, 32, No 4, April 1984, pp 194-203.
[3] D'Antonio, P and Konnert, J H, "The Reflection Phase Grating Diffusor: Design Theory and Application," Journal of the Audio Engineering Society, 32, 4, April 1984, pp 228-236.
[4] D'Antonio, P and Konnert, J H, "The QRD Diffractal: A New One- or Two-Dimensional Fractal Sound Diffusor," Journal of the Audio Engineering Society, 40, 3, April 1992, pp 117-129.
[5] Angus, J A S, "Alternative Diffuser Sequences," Proceedings of the Institute of Acoustics, 14, part 5, October 1992, pp 193-202.
[6] Angus, J A S, "Sound Diffusers using Reactive Absorption Gratings",
Audio Engineering Society 98th Convention, 25-28 February 1995, Paris, preprint #3953
[7] Angus, J A S, "Large Area Diffusers using Modulated Phase Reflection Gratings", Audio Engineering Society 98th Convention, 25-28 February 1995, Paris, preprint #3954
Figure 1 Energy time curve of the empty box
[image:10.386.53.342.297.510.2]Figure 3 Energy time curve of the treated box
[
[image:11.386.61.346.302.514.2]Figure 5 Broadband energy decay spectrum of the empty box
[image:12.387.40.320.318.519.2]120 · 0 'o
c_ -5
E
I
-10
-15
-20
-25
-30
'35500 1550 16'00 16'50 1700
[image:13.387.50.332.65.268.2]Frequency (MHz)
Figure 7 High resolution energy decay spectrum of the empty box
5
o
-10 l
-15
-20
-25
-30
~315500 1550 16'00 1650 1700
Frequency (MHz)
[image:13.387.52.334.313.519.2]0
'O
'" -10
..t=
Q,..
E '< -20
-30
-40 I
-60
'7105'00 1550 1600 1650 700
Frequency (MHz)
Figure 9 Hanning windowed energy decay spectrum of the empty box
0
-10
1000 1550 1600 1650 1700 Frequency (MHz)