ISSN Online: 2327-5227 ISSN Print: 2327-5219
DOI: 10.4236/jcc.2018.65007 May 29, 2018 83 Journal of Computer and Communications
Distributed Cluster Based 3D Model Retrieval
with Map-Reduce
Xiaohong Liu, Dechao Wu, Yuhang Chen, Panjing Li, Zhijian Qu
*School of Computer Science and Technology, Shandong University of Technology, Zibo, China
Abstract
View-based 3D model retrieval methods are attracted intensive research at-tentions due to the high expression and stable features. In the paper, the bag-of-words (BOW) standardization based SIFT feature were extracted from three projection views of a 3D model, and then the distributed K-means clus-ter algorithm based on a Hadoop platform was employed to compute feature vectors and cluster 3D models. In order to get precise initial cluster center, the maximum and minimum principle based Canopy algorithm was also pre-sented. The similarity of models was determined by the distance between the query model and each cluster center, and the cluster which nearest to the query model will be return as retrieval results. The simulations indicated that the proposed method had good results in terms of 3D model retrieval accura-cy and retrieval time efficienaccura-cy.
Keywords
Map-Reduce, 3D Model Retrieval, K-Means, Feature Extraction
1. Introduction
With the development of 3D modeling technology and computing techniques, 3D models have been widely used in many fields such as virtual reality, 3D
mov-ies, 3D games, computer aided design (CAD) and so on [1]. The demand for
high-quality 3D models is growing every day. However, to construct a new com-plicatedly model is an extremely time-consuming process. If the existing 3D models could be retrieved efficiently from database, the work efficiency in re-lated fields will be improved dramatically by reusing the model. There are two different ways to search 3D models from database. One is key-word based
me-thod, and the other is content based method [2]. However, each method has
*Corresponding author. How to cite this paper: Liu, X.H., Wu,
D.C., Chen, Y.H., Li, P.J. and Qu, Z.J. (2018) Distributed Cluster Based 3D Model Retrieval with Map-Reduce. Journal of Computer and Communications, 6, 83-93. https://doi.org/10.4236/jcc.2018.65007
Received: April 16, 2018 Accepted: May 26, 2018 Published: May 29, 2018
Copyright © 2018 by authors and Scientific Research Publishing Inc. This work is licensed under the Creative Commons Attribution International License (CC BY 4.0).
DOI: 10.4236/jcc.2018.65007 84 Journal of Computer and Communications some problems in getting a desired model form a given mass 3D model database.
For the key-word based way, it is hard to correctly and uniformly describe all 3D models in the database due to the diversity of 3D model gesture and the dif-ferent understanding of 3D models. For the content based way, feature vector should be extracted from each 3D model, and the similarity between 3D models should be calculated according to the feature. However, how to extract strong expression feature from 3D model and reduce the processing time are the main challenges, there are many kinds of content based 3D model retrieval methods. According to the types of features vector, existing 3D model retrieval techniques can be classified into four categories: geometry-based [3], graph-based [4], view-based [5], and hybrid-techniques [6]. In the geometry-based approach, the 3D models are represented by the visual similarity and the feature vector is ex-tracted from the shape or the topology of 3D model. In graph-based approach, it attempts to extract a geometric meaning from a 3D model using a graph show-ing how shape components are linked together. These above two 3D model re-trieval algorithms approach also can be treated as in one category named mod-el-based methods. In the view-based approach, 3D models are represented by a group of 2D views from different directions. So, the views can contain the spatial and structure information of 3D models. As a 3D model can be represented by a set of multiple views, some existing image processing methods can be employed. The hybrid-techniques based method will comprehensive use of the above me-thods.
In this paper, we will address to the view-based method. The view-based 3D model retrieval process can be defined as follows: given one query 3D model and then to find all similar objects from the 3D models database under the view-based representation. The view-based representation can be extracted from one or several views of 3D models. Feature extraction is an important step for 3D model retrieval.
Recently, the bag-of-words (BOW) feature was employed to represent 3D model. This method was first used in view-based 3D model retrieval by Takahi-ko et al. [7]. In this method, it can generate a BOW feature. The scale-invariant feature transform (SIFT) features are extracted from different views of one 3D model. The distance between two BOW features is measured to match 3D mod-els. The BOW feature is robust to variances in occlusions, viewpoints, illumina-tion, scale, and backgrounds.
In this paper, the BOW feature is employed to represent 3D model. The dis-tribute K-means and canopy algorithms are used to classify 3D models. In addi-tion, the Map-Reduce process of Hadoop platform is presented to accelerate the feature clustering and the 3D model matching calculation.
DOI: 10.4236/jcc.2018.65007 85 Journal of Computer and Communications
2. Related Work
In this Section, we will briefly review the works about view-based 3D model re-trieval. Recently, view-based methods attracted much more attention due to it independent of 3D models, and can be realized simply with multi-view repre-sentation of models [8]. Typically, there are two key steps in this technology. Firstly, the feature vector should be extracted from one or more views of 3D models. Then the feature vectors should be employed to calculate the similarity of 3D models. Hang [9] et al. presented convolutional neural networks (CNN) architecture to recognize 3D models from multiple views. They found that a set of 2D views can be highly informative for 3D shape recognition. Sichen [10] et al. employed multigraph learning as a feature fusion method for view-based 3D model retrieval. The weights of each graph are optimized automatically. Gao
[11]et al. presented a solution can jointly learn the visual features from multiple views of a 3D model and optimize the model retrieval task. For the machine leaning based method, the large number of labeled training samples is required. However, the training samples in 3D datasets are very small, so that it will be difficult to train a learning model. Tabia [12] et al. presented a new compact shape signature that is built from multiple vocabulary. They also proposed a mechanism for reducing the impact of vocabulary correlation and the signature size to benefit the view-based method. Cao [13]et al. extracted SIFT feature to represent the visual appearance of 2D view images for each 3D models, and then the high-level and discriminative representation from SIFT feature for individual 3D model is gotten via learning. Bai [14] et al. designed a real-time 3D shape search engine based on the projective images of 3D shapes. They employed GPU to accelerate the projection and view feature extraction. The first inverted file is utilized to speed up the multi-view matching procedure.
In summary, to get strong expression feature and develop some ways for ac-celerating the processing speed of view-based 3D model retrieval task is worth further study.
3. The Proposed Method
3.1. View Feature Extraction and Standardization
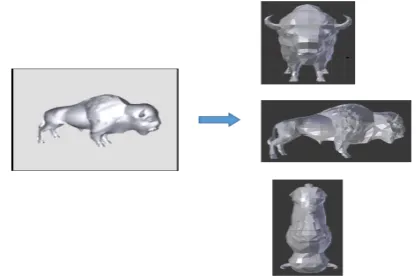
3D models are composed by some points, lines and planes in the three-dimensional space. So, the views of a 3D model can obtain from XOY, XOZ, YOZ planes projection in a space coordinate system. A projection sample of a 3D model is shown in Figure 1.
af-DOI: 10.4236/jcc.2018.65007 86 Journal of Computer and Communications fect the quality of model features and the final retrieval accuracy. In order to get strong expression feature from 3D model, the BOW paradigm is employed to standardize the SIFT feature points.
For the BOW based SIFT feature standardization paradigm, each 2D view of a model is treated as a text. The SIFT features which extracted from each view are treated as vocabulary. Then the synonymous features are clustered and the K
clusters are obtained. So, the K-dimension feature vector of each view can be gotten by word frequency analysis. The feature standardization process is shown in Figure 2.
3.2. K-Means and Canopy Algorithm Based on Map-Reduce
From the above description, we can see that there has a clustering calculation in feature extraction stage. Obviously, clustering calculation is time-consuming es-pecially in big data set. In the paper, the K-means algorithm which can run on the Hadoop platform is employed to get feature vector. Moreover, in order to improve the clustering accuracy, the Canopy algorithm is employed to confirm the K value and the K initial cluster centers. For the Canopy algorithm, the threshold T1 and T2 are determined by the maximum and minimum principle.
According to the maximum and minimum principle, when the first n Canopy
center have been confirmed, the n + 1th Canopy center should choose the point which have the maximum distance in the set of minimum distance. This set is composed by the minimum distances between all candidate points and the first
[image:4.595.268.477.431.569.2]n center.
Figure 1. Three-view projection illustration.
[image:4.595.207.533.601.707.2]DOI: 10.4236/jcc.2018.65007 87 Journal of Computer and Communications
The mathematical expression of determining the n+1th Canopy center is
shown as Formula (1) and (2).
(
)
(
)
{
}
DistList= min distance ,x xi (1)
here i = 1, 2, …, n
(
)
{
}
DistMin n+ =1 max DistList (2)
In Formula (1), x represents one of candidate points, xi represent the ith Ca-nopy center, DistList represents the minimum distance set between all candidate points and first n Canopy center. In Formula (2), DistMin represents the n+1th center point we obtained. According to the maximum and minimum principle, if the Canopy center points amount is smaller or bigger than the fact, the para-meter DistMin (n + 1) will have a small change. If the amount is near to the fact, DistMin (n + 1) will have a big change. In order to determine the best cluster amount and the value of T1, the depth indicators Depth(i) is introduced into the algorithm to express the change magnitude. It is defined as Formula (3).
( )
( )
(
)
(
)
( )
Depth k = DistMin k −DistMin k− +1 DistMin k+ −1 DistMin k (3)
when k value is near to the real cluster amount, Depth(k) can get the maximum value. So, in order to get the best cluster result, we can set T1 = DistMin (k), and
T2 = T1/2.
In the paper, the K-means and Canopy algorithm will be executed in Hadoop platform. The cluster task will be divided into several subtasks, so that it can sig-nificantly improve the algorithms efficiency. The processes of the K-means and Canopy algorithm based on map-reduce is shown in Figure 3.
4. Experimental Results and Analysis
In the paper, the experimental data are gotten from the Computational Vision and Geometry Lab of Stanford University
(http://cvgl.stanford.edu/projects/pascal3d.html). The experimental
environ-ment is shown as following: CPU: Intel(R) Core(TM) i5-8250U 8 core 3.10 GHz; RAM: 8 GB; Ubuntu 12.04 LTS; Hadoop 2.6.0; IntelliJ IDEA Community Edi-tion 2017.3.1; JetBrains PyCharm Community EdiEdi-tion 2017.3.1; python 2.7, in-clude blender_python_api, OpenCV-Python.
4.1. Time Efficiency Analysis
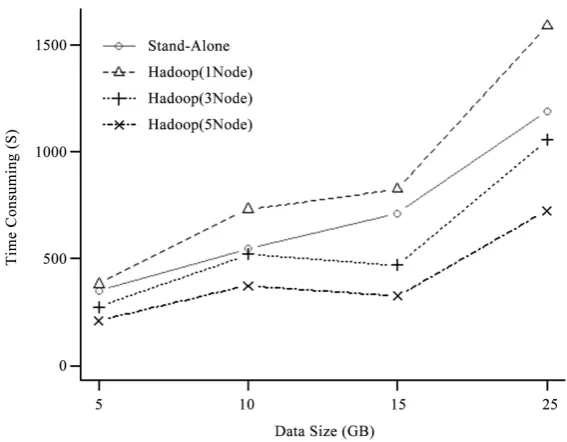
In order to analyze the time efficiency, we compared the processing time of dif-ferent computing models under difdif-ferent data size. The computing models con-tain one-node, three-nodes and five-nodes Hadoop and the Stand-Alone model. The comparison results are shown in Figure 4.
From Figure 4 we can know that the one-node Hadoop model will consume
DOI: 10.4236/jcc.2018.65007 88 Journal of Computer and Communications
Figure 3. Illustration of the K-means and Canopy algorithm with map-reduce.
Figure 4. Time consuming of different compute modes.
than Stan-Alone model, especially in the case of processing big data size. The reason is that the Hadoop model will spend some times in internal document processing. But, with the nodes amount increasing in Hadoop model, the ad-vantages of computational efficiency begin to show. Note that, when the data size is less than 10 GB, the processing time of 3-nodes Hadoop is similar with Stan-Alone model. When the data size is more than 10 GB, the advantages of Multi-node Hadoop model is shown. It is indicated that Multi-node Hadoop model have better time performance in processing big data size than Stan-Alone model. Although the internal document processing and transmission time cost should be payed, the benefit is more than the cast. In the paper, we will use the 5-nodes Hadoop model to compute the feature vectors and match models.
4.2. Retrieval Performance Analysis
[image:6.595.231.515.201.422.2]DOI: 10.4236/jcc.2018.65007 89 Journal of Computer and Communications Then the K-means algorithm was employed to cluster the SIFT feature according to the initial cluster center. The data size of SIFT feature is 10 GB, and the
K-means algorithm was executed 5 times on a 5-nodes Hadoop platform. The
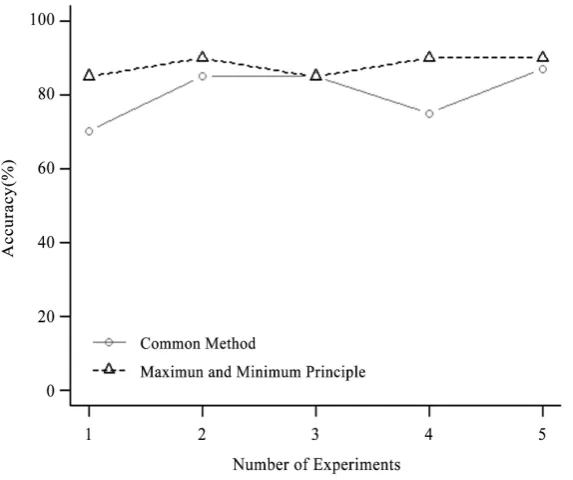
clustering results of each time about different method are compared and shown in Figure 5. Here, the clustering accuracy rate is calculated by this way: ran-domly selecting one cluster from the clustering results, then determining the la-bel by analyzing the data in this cluster. At last, randomly selecting 50 items from the cluster and calculating the proportion of the correct items.
Form Figure 5 we can know the clustering accuracy rate of the common me-thod cannot exceed the maximum and minimum principle based meme-thod every time. The average clustering accuracy rate of the maximum and minimum prin-ciple based method can achieve 88%, higher than the 80.4% of the common me-thod. It is means that the maximum and minimum principle based Canopy al-gorithm can avoid falling into the local optimum and get better initial cluster center. The better initial cluster center will benefit for the K-means algorithm to get more accurate clustering. Obviously, the accurate clustering will improve the 3D model retrieval performance.
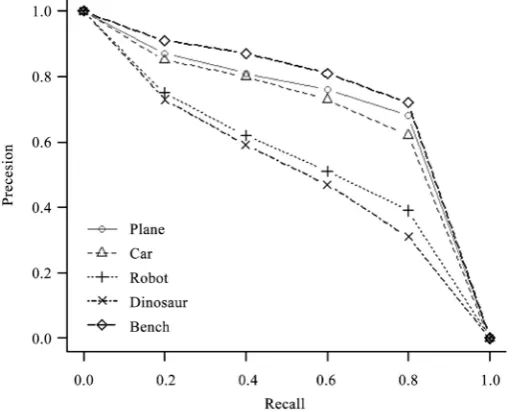
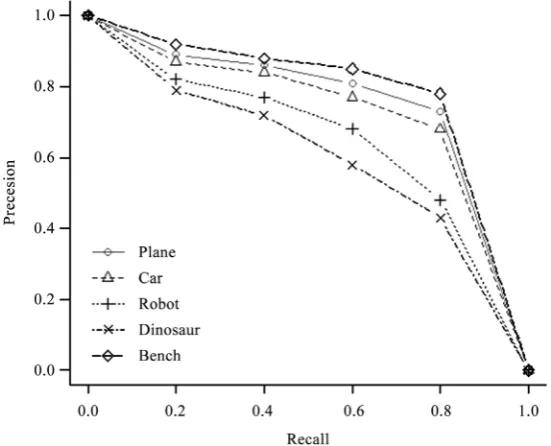
Here we will compare the 3D model retrieval performance. We used the pre-cession-recall graph to evaluate the retrieval performance. Precision is to meas-ure the accuracy of the relevant models among the top n ranking results, while recall is the percentage of the relevant class that has been retrieved in the top n
results [6]. We get two classes SIFT feature of each 3D model. One is BOW processed normalization feature and the other is the normal SIFT feature. We
use the K-means cluster algorithm and the maximum and minimum principle
[image:7.595.232.519.468.708.2]based Canopy algorithm to compute the feature vector. Based on these two classes feature, the retrieval performances are compared.
DOI: 10.4236/jcc.2018.65007 90 Journal of Computer and Communications To retrieval 3D models, a query model will be input into the retrieval system, and then the feature vector will be calculated. The Euclidean distance between the query model and the K cluster centers are calculated. According to the distance, the clustering whose center is nearest to the input model will be return as the re-trieval results. All the above clustering algorithms and matching calculations are executed in a 5-nodes Hadoop platform. Note that, there are so many model classes in a model database, so it is hard to display all the retrieval results. Here, we give 5 model classes retrieval results in Figure 6, Figure 7 and Figure 8.
Figure 6 shows a part of retrieval results. In the experiment, the SIFT features are not BOW standardized. Figure 7 shows a part of retrieval results. In the ex-periment, the SIFT features are not BOW standardized.
In particular, it should be noted that for some model classes, such as dinosaur or bench, the retrieval performances are improved dramatically after BOW standardization. This is because, there are exist lots of low contrast and unstable edge SIFT feature points in 3D model. If the low contrast and unstable edge SIFT feature are filtered out without BOW standardization, the features of each 3D model will be processed into uniform feature. According to the uniform fea-ture, we will get different retrieval performance in different model categories. It is not a stable feature for all models. It means that some categories may get a better retrieval results, but most categories cannot get some acceptable perfor-mance. The retrieval results almost depend on the quality of the view feature points. On the other hand, if lots of representative SIFT features are processed into a unified feature, it will lead to lose feature information and affect the fea-tures characterization ability.
The BOW feature standardization can get feature vector by clustering the SIFT feature points of each view, so that every SIFT feature points have contri-bution in generating feature vector. The stronger expression feature can help to get better retrieval performance.
DOI: 10.4236/jcc.2018.65007 91 Journal of Computer and Communications
[image:9.595.236.511.330.550.2]Figure 7. Retrieval results after BOW standardization.
Figure 8. Average retrieval results of different method.
Figure 8 shows the average retrieval performances of different SIFT feature processing methods. We can know that the average retrieval results of all model classes of BOW standardization based SIFT feature method is better than the other method. So, the view SIFT feature which standardized by BOW can im-prove the view-based 3D model retrieval performance.
5. Conclusion
DOI: 10.4236/jcc.2018.65007 92 Journal of Computer and Communications models. Firstly, a 3D model was transformed into multi-view 2D images and the SIFT features was extracted from each 2D view. Secondly, the SIFT features were normalized by employing the bag-of-words model which have been presented in the field of natural language processing to reduce the noise points influence on 3D model features. Thirdly, a distributed K-means clustering algorithm was performed on a 5-nodes Hadoop platform to obtained 3D model feature, and a maximum-minimization principle based Canopy algorithm was also employed to optimize the K-means clustering algorithm. At last, the experimental results indicated that the presented 3D model retrieval method had better performances in both the computational speed and the retrieval efficiency.
Acknowledgements
This work was supported by Natural Science Foundation of Shandong Province (NO. ZR2016FM18); A Project of Shandong Province Higher Education Science and Technology Program (NO. J16LN20).
References
[1] Gao, Y. and Dai, Q.H. (2014) View-Based 3D Object Retrieval: Challenges and Ap-proaches. IEEE Multimedia, 21, 52-57. https://doi.org/10.1109/MMUL.2014.20 [2] Cugini, J.V., Laskowski, S. and Sebrechts, M.M. (2000) Design of 3D Visualization
of Search Results: Evolution and Evaluation. In:Erbacher, R.F., Chen, P.C., Roberts, J.C. and Wittenbrink, C.M., Eds., Proceedings Volume 3960, Visual Data Explora-tion and Analysis VII, Society of Photo-Optical Instrumentation Engineers (SPIE), San Jose, 198-211.
https://www.spiedigitallibrary.org/conference-proceedings-of-spie/3960/0000/Desig n-of-3D-visualization-of-search-results--evolution-and/10.1117/12.378896.short [3] Eitz, M., Richter, R., Boubekeur, T., Hildebrand, K., and Alexa, M. (2012)
Sketch-Based Shape Retrieval. ACM Transactions on Graphics, 31, Article No. 31. https://doi.org/10.1145/2185520.2185527
[4] Liu, A., Wang, Z., Nie, W. and Su, Y. (2015) Graph-Based Characteristic View Set Extraction and Matching for 3D Model Retrieval. Information Sciences, 320, 429-442. https://doi.org/10.1016/j.ins.2015.04.042
[5] Liu, A.A., Nie, W.Z., Gao, Y. and Su, Y.T. (2016) Multi-Modal Clique-Graph Matching for View-Based 3D Model Retrieval. IEEE Transactions on Image Processing, 25, 2103-2116. https://doi.org/10.1109/TIP.2016.2540802
[6] Li, B. and Johan, H. (2013) 3D Model Retrieval Using Hybrid Features and Class Information. Multimedia Tools and Applications, 62, 821-846.
https://doi.org/10.1007/s11042-011-0873-3
[7] Laga, H., Schreck, T., Ferreira, A., Godil, A., Pratikakis, I. and Veltkamp, R. (2011) Bag of Words and Local Spectral Descriptor for 3D Partial Shape Retrieval. Pro-ceedings of the Eurographics Workshop on 3D Object Retrieval (3DOR’11), Llan-dudno, 10 April 2011, 41-48.
[8] Li, H., Zhao, T., Li, N., Cai, Q. and Du, J. (2017) Feature Matching of Multi-View 3D Models Based on Hash Binary Encoding. Neural Network World, 27, 95-106. https://doi.org/10.14311/NNW.2017.27.005
Inter-DOI: 10.4236/jcc.2018.65007 93 Journal of Computer and Communications national Conference on Computer Vision, Washington DC, 7-13 December 2015, 945-953.
[10] Zhao, S., Yao, H., Zhang, Y., Wang, Y. and Liu, S. (2015) View-Based 3D Object Retrieval via Multi-Modal Graph Learning. Signal Processing, 112, 110-118. https://doi.org/10.1016/j.sigpro.2014.09.038
[11] Gao, Z., Wang, D., He, X. and Zhang, H. (2018) Group-Pair Convolutional Neural Networks for Multi-View Based 3D Object Retrieval.
https://pdfs.semanticscholar.org/01db/ad99b2ba449f0103e97f5bae6bb5caf287fb.pdf [12] Tabia, H. and Laga, H. (2017) Multiple Vocabulary Coding for 3D Shape Retrieval
Using Bag of Covariances. Pattern Recognition Letters, 95, 78-84.
https://doi.org/10.1016/j.patrec.2017.06.007
[13] Cao, Q., An, Y., Shi, Y. and Zhu, X. (2017) Sparse Representation-Based 3D Model Retrieval. Multimedia Tools and Applications, 76, 20069-20079.
https://doi.org/10.1007/s11042-016-4238-9