This is a repository copy of VRU-TOO: variable road user traffic observation and optimisation, Drive II Project V2005..
White Rose Research Online URL for this paper: http://eprints.whiterose.ac.uk/2144/
Monograph:
Institute of Transport Studies, The (1995) VRU-TOO: variable road user traffic observation and optimisation, Drive II Project V2005. Working Paper. Institute of Transport Studies, University of Leeds , Leeds, UK.
Working Paper 439
[email protected] https://eprints.whiterose.ac.uk/
Reuse
Unless indicated otherwise, fulltext items are protected by copyright with all rights reserved. The copyright exception in section 29 of the Copyright, Designs and Patents Act 1988 allows the making of a single copy solely for the purpose of non-commercial research or private study within the limits of fair dealing. The publisher or other rights-holder may allow further reproduction and re-use of this version - refer to the White Rose Research Online record for this item. Where records identify the publisher as the copyright holder, users can verify any specific terms of use on the publisher’s website.
Takedown
If you consider content in White Rose Research Online to be in breach of UK law, please notify us by
White Rose Research Online
http://eprints.whiterose.ac.uk/
Institute of Transport Studies
University of Leeds
This is an ITS Working Paper produced and published by the University of Leeds. ITS Working Papers are intended to provide information and encourage discussion on a topic in advance of formal publication. They represent only the views of the authors, and do not necessarily reflect the views or approval of the sponsors.
White Rose Repository URL for this paper: http://eprints.whiterose.ac.uk/2144/
Published paper
Institute of Transport Studies (1995) VRU-TOO: Variable Road User Traffic Observation and Optimisation, Drive II Project V2005. Final Report. University of Leeds, Working Paper 439
VRU-TOO
Vulnerable Road User Traffic Observation and Optimization
DRIVE
I1
Project V2005
Final
Report
Institute for Transport Studies, University of Leeds
Deliverable type: P
Contract date: February 1995 Submission date: August 1995
ITS
Working Paper: 439Commission of the European Communities
-
R&D programme Telematics
The research reported herein was conducted under the European Community DRIVE
II
Programme. The project is being carried out by
a
consortium comprising: Institute for Transport Studies, University of Leeds; West Yorkshire Highways Engineering and Technical Services; Traffic Research Centre, University of Groningen; Department of Traffic Planning and Engineering, Lund Institute of Technology; FCTUC, University of Coimbra; FEUP-DEC, University of Porto; and TRENDS (Transport Environment Development Systems). The opinions, findings and conclusions expressed in this report are those of the authors alone and do not necessarily reflect those of the EC or of any organization involved in the project.O 1995 Institute for Transport Studies, The University of Leeds
DRIVE U Project VZO35 VRU-TOO Final Report
TABLE OF CONTENTS
2OBJECTIVES
. . .
23 TECHNICAL DESCRIPTION OF THE PROJECT
. . .
3. . .
3.1 PILOT PROJECT WORK AREA 3 3.2 COMPUTER MODELLING WORK AREA. . .
83.3 BEHAVIOURAL STUDIES WORK AREA
. . .
114ACHIEVEMENTS
. . .
164.1 PILOT PROJECT WORK AREA
. . .
164.2 COMPUTER MODELLING WORK AREA
. . .
204.3 BEHAVIOURAL STUDIES WORK AREA
. . .
247 PUBLIC DELIVERABLES AND GENERAL PUBLICATIONS
. . .
35. . .
7.1 PUBLIC DELIVERABLES 35
. . .
7.2 GENERAL PUBLICATIONS 35
. . .
APPENDIX 1: END PRODUCTS 37
. . .
DRIVE ll Pmiect VUX)S VRU-TOO
1 EXECUTIVE SUMMARY
The VRU-TOO project has been unique in DRIVE I1 in that it has been the only project applying transport telematics specifically to reducing risk and minimizing delay to vulnerable road users. To achieve this the project has carried out further development of the signal systems that had been tested in DRIVE I bv V1031. An Intelligent Traffic Svstem for Vulnerable Road Users. These signals are able to register pedestrian de-d autornatiEally and to use that registration to provide pedestrians with signal timings that
are
better adapted to their actual needs. Alterations in signal & i n g have included both pre-arrival detection to provide instantaneous green on arrival atthe kerb and green extension when demand is large. The signal systems have been implemented in varied traffic environments in the UK, Portugal and Greece.In addition to this development and implementation work, the project has continued work on the pedestrian route choice simulation model WLCAN and has carried out detailed studies of pedestrian behaviour and risk in four European countries at two types of location, signalized and unsignalized junctions.
DRIVE n Pmject VUX)S VRU-TOO
2 OBJECTIVES
The work in VRU-TOO has been targeted specifically at the reduction of risk and minimization of delay to vulnerable road users, namely pedestrians with as little inconvenience to motorised traffic as possible. To achieve this, the project has linked practical implementations in three countries with behavioural studies of the micro-level interaction of pedestrians and vehicles and the development of computer simulation models.
The implementations have taken the form of pilot projects in cities in both northern and southern Europe. Work in DRIVE I confirmed that, by incorporating passive detection of pedestrians in signalized crossings, pedestrian comfort and safety could be improved. The new schemes applied advanced detector systems to improve conditions for pedestrians, at signalized junctions and crossings on main roads. The UK implementation, in Leeds, involved the application of these techniques to a large city-centre scheme, where pedestrian needs can conflict with those of vehicle traffic. The systems have been being designed in such a way as to improve safety for VRUs, with as little inconvenience to motorized traffic as possible. This implementation was linked to an Urban Traffic Control (UTC) system.
Two smaller implementations have been made at urban locations in Portugal (Porto) and Greece (Elefsina), where once again it is difficult to satisfy both the needs of pedestrians and those of vehicles. This work is verifying the applicability of the same detection techniques in different environments.
At the same time, the project has carried out the necessary behavioural work to create detailed rules for the normal (safe) and abnormal (unsafe) interaction of pedestrians and vehicles. These rules have been developed independently of the pilot project locations, but the rules were applied in the behavioural evaluation of the pilot projects. This was intended to make it possible to go beyond the normal assessment of such schemes in terms of success or failure, by obtaining an understanding of how the behaviour of pedestrians and vehicle drivers was affected by the schemes and therefore of what the requirements for success
are.
This work was intended to permit the generalization of project results to other locations and the future implementation of new schemes thatare
even better tuned to the needs of pedestrians.The computer modelling work has been aimed at the further development of the WLCANl (Vulnerable Road Users Can be Assigned to Networks) model developed by DRIVE I project
V1031. This model takes as input a pedestrian origin-destination matrix for
a
small road network, and predicts pedestrian crossing flows at different locations. The flows are affected by the nature of the facilities provided and the consequent delay to pedestrians. Based on the flows,a
safety prediction can be made for the network. The further development has aimed to improve the route choice model in WLCAN with the effect of improving the accuracy of its predictions.DRNE n Project VUX)S VRU-TOO
3 TECHNICAL DESCRIPTION OF THE PROJECT
3.1 PILOT PROJECT WORK AREA
3.1.1 Background
The principal objective of the work in this work area was to formulate ways to reduce the risk to vulnerable road users, namely pedestrians, in urban situations. The work would follow on from that commenced in DRIVE I, where different types of pedestrian facilities at signalised locations were introduced at different locations within nolfhem Euroue. These trials showed that it was possible to make the signals more responsive to the needs of pedestrians and that by the intelligent implementation of such systems there would be an improvement in safety and a reduction in delay fo; pedestrians.
In DRIVE I there were two projects 011031-An Intelligent Traffic System for Vulnerable Road Users and V1061-PUSSYCATS) in which different techniques for the detection of pedestrians who wanted to cross the road were used. The results from this DRIVE I work showed clearly that by using technological advances it was possible to make alterations to the response of the signals to the needs of pedestrians and thus improve their safety and mobility. Hence the first part of the work within this work
area
was to cany out an extensive examination of all the existing techniques available for detecting pedestrians wishing to crossa
road at a signalised location and then determine what techniques would be most suitable for use at the particular locations to be used in the planned pilot trials.3.1.2 Detection Technology
As
a
result of these examinations it was decided by the project that it would be most appropriate, in all three cases, to use microwave detectors. The advantages of using such detectors are that they can be easily attached to signal poles and that the signal from the detectors can be transmitted through the signal controller to amend the timings of the signals in an intelligent manner. As implemented, theVRU-TOO
system applied detection of pedestrians approachinga
signalized crossing so that, when possible, they could be given a green at the moment of reaching the -Lrb. The concept is illustrated in Figure
VRU-TOO
DRNE Il hoject VZWS VRU-TOO Final Repart
already been used for the detection of motor vehicles in urban areas; the only major alteration that was required was that the sensitivity of the instruments had to be adjusted so that slower moving objects (i.e. pedestrians) would be detected. The "system" is described in more detail in Appendix 2.
Figure 2 shows how the microwave detectors were affixed to the signal poles in one particular location.
3.1.3 Pilot Trials
The major task of the work area was to carry out trials in three different locations through Europe (Greece, Portugal and United Kingdom) to show that by the installation of microwave detectors at appropriate locations the mobility and safety of pedestrians at signalised crossings in urban situations could be improved. In all three cases the sites identified were in situations where there was
a
significant flow of pedestrians wishing to cross the road and that the requirement to provide time for pedestrians to cross the road was in conflict with the need to maintain the flow of vehicular traffic. In this set of trials there was a requirement to try andimprove the conditions for pedestrians
Figure
2: Miwowave detectors mounted on trawIcwithout making the situation significantly signal worse for the vehicular traffic.
In all the three sites the crossing points were already fitted with push-buttons which would signify to the signal control system that there was a demand, the programme within the controller would then process this demand and then allocate a fked amount of time for the pedestrian to cross the road. In the feasibility stage the project examined many of the simple altematives that could be used to make this operation more responsive to the needs of the pedestrians and to the requirements of any given situation. The advantage of using the concept of detecting pedestrians as they approached a particular crossing point was that even within this very simple sounding concept there
are
very many alternatives that can be used to make the system more responsive. Thus the system, whilst being a "standard system", would also have the in-built flexibility to accommodate both national rules and local conditions. Therefore within the confines of the three trials the project has been able to combine the options and tailor them to the precise needs of the particular locations.DRIVE n Project Vm05 VRU-TOO Final Repxi
1. Triggering of the pedestrian demand to cross, before the pedestrian actually reaches the crossing point.
2. Extending the length of the pedestrian green time if pedestrians are still approaching the cmssing point
3. Extending the length of the crossing time if the occupancy of the crossing is above a specified level.
4. Extending the length of the crossing time if any pedestrians are still on the crossing.
5 . Bringing the pedestrian green time forward when pedestrian demand is above a certain level.
6 . Reducing the pedestrian green time if no crossing pedestrians are detected.
It should also be noted that there was also a need to show that using such a pedestrian detection system could be incorporated within the existing situation in different countries within Europe. This requirement had two distinct phases: first of all it meant that the manipulations and alterations that were to be made to the signal timings should not conflict with the national signal regulations of the country within which the trial was being carried out. Secondly the response from the detector should be accepted and be in a form which can be used by the existing signal and signal control systems which are common in the country of the trial. In the case of VRU-TOO the trials were carried out in Greece, Portugal and United Kingdom and there was absolutely no problem in being able to meet these requirements.
In order to ensure that the work carried out on the t h e trials could be compared not only on a before and after basis on the same site but also between sites it was important that the evaluation be done on a similar basis. As far as possible the before and after periods for each site were chosen so as to be as similar as possible with regards to conditions, time, etc. The number of data values recorded at each site were related to that number need to obtain a valid result. Consequently the type of data and the means by which it was collected was specified so that it was as similar as could be arranged and that the definitions of the variables were consistent.
Examples of the data fields that were collected during the three trials so as to evaluate whether the specific objectives of the trials had been achieved include:
1.
The number of pedestrians who crossed the road at all light settings were recorded from video records for specified periods of time.2. The number of vehicles that passed the different cmssing facilities at all signal settings were recorded from
a
video recording.DRIVE I1 Project V2005 VRU-TOO Pioat Report
4. In one site,
a
manual record of the time taken for a sample of vehicles to pass through thefull
length of the section was collected at different times of the day using registration plate matching. In another site, the moving observer method was used to collect this type of information.5. Queue lengths for the various streams of motorised traffic passing through the pedestrian facilities were obtained from video.
6 . A manual record of the number of vehicles that violated the red lights was made throughout different periods of the trials.
The above data collection exercises were undertaken solely to address the question as to whether the specific objectives of the
trial
have been achieved. However, in addition, other data collection exercises were undertaken by the behavioural work area team to build up knowledge on pedestrian behaviour and to examine the differenceslsimilarities between the trials.The data collection was carried out in an identical manner (as far as was practical) on
a
before and after basis. Also every attempt was made to ensure that all other conditions remained the same in the before and after period. A period of at least three weeks was allowed after implementation, but before data collection, to allow the situation to settle down; during this time some ad-hoc measurements were taken to check what was happening, but this was not part of the formal evaluation process.The number of pedestrians crossing the road was counted for at least a total of twenty-four hours. This time covered both peak and off-peak weekday periods and all of the signalised crossing points. For each of these periods the actions of the pedestrians were recorded together with the signal settings at the salient times during their movement. This recording was be carried out by video wherever possible and the settings of the signals were transmitted directly to the input channel in the recorder using a specially made piece of equipment involving sensors on the signal lights. One of the crossing points had to be covered by manual counts. The signal settings over an extended period were recorded, this allowed for reference to be made with regards to the proportion of time allowed to pedestrians and main road traffic.
The number of vehicles going through the signals was recorded from the video together with their movement and the setting of the signals at that time. A vehicle registration plate check was carried out at both ends of the length under consideration in Leeds to check the time taken to travel along the length. This work was done for 10 minute intervals in each hour covering the full working day. At least four such records were collected. In Porto, the moving observer method was used to obtain travel times.
DRIVE I1 Project V2005 VRU-TOO
The Sites
GREECE
Location
The site is at a recently installed signalised junction with standard pedestrian facilities (i.e. push button calling the pedestrian phase). This junction is on the main road which runs directly through the city of Elefsina, across which there is an established pedestrian route for workers and shoppers. Since there is also a by-pass around the city, queues of motorised traffic on the road are not considered to be
a
major problem, and in fact there is a desire to encourage more through traffic to use the by-pass route. The signals were installed in November 1993. F o l l o ~ ~ ~ g this, the junction was allowed to settle down and the timings of the signals were adjusted to reflect local best practise. Then all the before data was collected and the microwave detection devices were installed on the existing signal poles. The enhanced system became operational in March 1994.Response from detectors
At this location the detectors on either side of the minor junction were used in a different fashion. On the western side of the iunction, the detectors detected ~edestrians as they a ~ ~ r o a c h e d
- - -
the crossing point, whereas on the eastern side of the junction t i e Greek Ministry of Transport had requested that the detectors be used to identify pedestrians who were on the crossing. The response from the microwave detection devices was then used to amend the signal timings. In this particular case this means that there was a dual response from the detectors: on the western side of the junction, when pedestrians were detected approaching the crossing then the procedure for changing the lights to givea
green light for pedestrians was immediately started, thus advancing the change to and reducing pedestrian waiting time green by up to 4 seconds. On the eastern side the detectors were used to detect pedestrians while crossing and to extend the green time for pedestrians to allow the pedestrians to complete their crossing (although this is not strictly part of the VRU-TOO implementation).PORTUGAL
Location
The site is a signalised intersection on a major dual carriageway acting as radial route to and from Porto. The signals are situated outside a school which means that there is a constant flow of pedestrians throughout the day, with heavy concentrations of pedestrians for short periods during the day. There was an existing safety problem relating to children travelling to and from the school. (For more details see Deliverable 1).
Response from detection
DRIVE n Project V'2005 VRU-TOO Final Report
r n E D KINGDOM
Location
Leeds City Council are installing a one-way city centre loop (CCL) around the central shopping area as part of their strategy for controlling vehicles within the city centre. One feature of the CCL is that, although it has been designed so as to allow cars to travel around the central area,
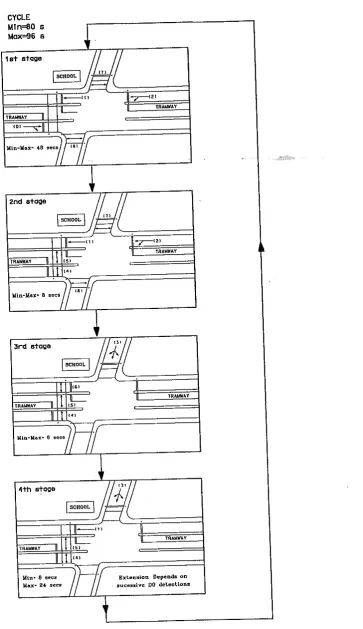
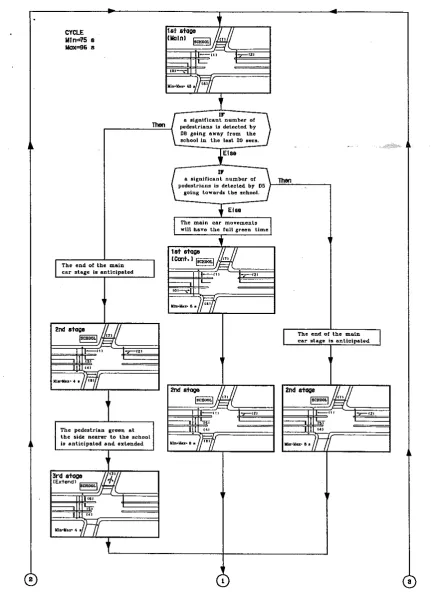
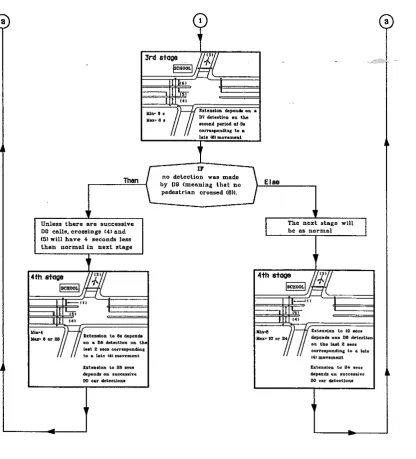
there is still the need for pedestrians to cross this road at street level. Therefore it has been accepted that the pedestrian facilities provided should be efficient as possible so as to allow the signal settings to be responsive to the needs of all road users. The CCL is being installed in four phases so as to minimise the overall disruption to the city centre. The work of the pilot trial is involved in Phase 2. This stretch goes essentially along one main street of length ii.6km. This stretch includes two signal controlled junctions and three other signalled controlled pedestrian crossing facilities. There is strong pedestrian demand to cross this road, but this is mainly in a direction perpendicular to the CCL and is thus very localised. The signalization of the CCL is run under a series of fixed time plans with various cycle times. The A l T measures have been attached to three of the signalised crossings.
Res~onse from detection
The effect of the detection at the signalised locations was three-fold:
1. It triggered the pedestrian demand irrespective of whether the pedestrian button is pressed (with the exception of the peak periods at Merrion Street, when there was a permanent demand).
2. It prevented the situation of a pedestrian just missing the time window when approaching the crossing.
3. If a pedestrian approached the crossing at the end of the green man period, this period can be extended.
3.2 COMPUTER MODELLING WORK AREA
Computer modelling in VRU-TOO has focused upon two issues:
Further development of the WLCAN pedestrian assignment model The transferability of Northern European modelling work to Portugal
3.2.1 Overview of
VULCAN
VULCAN is a flow-based simulation of pedestrian movement on an urban street, concerned primarily with estimating where pedestrians will cross the street. It is described fully in
VRU-
TOO Deliverable 7 "Final Version of Pedestrian Meso Model" (Bmdell-Freij and Timms, 1993).
WLCAN is typically to be used for
a
length of street with about three road junctions on it, and is intended to help the engineer plan crossing facilities for pedestrians. It requiresas
input:D R N E I1 Project V2005 VRU-TOO Pinal Repnt
A description of the network in terms of types of crossing facility and signal timings
Counts of car flows through the network
Parameters for route choice and accident models, although default values are given which
are taken from empirical results in the UK
It outputs estimates on pedestrian flow and pedestrian accidents at crossing points. Such estimates
are useful for the following situations:
1. Deciding on the benefit to be obtained by installing
a
pedestrian facility, suck as a pelican crossing. The model will estimate both the number of pedestrians who will use sucha
facility and the aggregate safety benefit (over the whole network) that might be obtained.
2. Predicting the effect of changes in signal timing (such as those obtained with pedestrian detection systems) on pedestrian movement and safety. New signal timings will alter car flow and thus affect both pedestrian delay (and hence route choice) and pedestrian safety.
At the heart of VLnCAN is
a
pedestrian route choice model described in 3.2.2 below. Delay is clearly an important factor in pedestrian route choice, and is calculated by a formula dependent on car flow. This is discussed in 3.2.3 below.3.2.2 Pedestrian Route Choice
The WLCAN nested logit route choice model has been fully documented by Brundell-Freij and Timms (1993). The &fault hierarchical choice structure is shown in Figure 3.
CHOICE LEVEL:
Inters
I
I
I
I
c
A B D
[image:14.595.128.475.472.680.2]DRIVE Il Pmjen VZOO.5 VRU-TOO
Each crossing alternative has a "generalised delay" term given by:
Final Report
(2.3)
where:
Di is the expected delay in seconds (for the complete route through the network) associated
with crossing opportunity i
Z,,'s are dummy variables (taking the values 0 or 1) dependent upon attributes of the crossing alternative i (such as whether it is signalised etc)
a's are parameters giving the relative weights between &lay and dummy variables (so that we can make statements such as "a pedestrian will accept up to five seconds delay in order to use a pelican")
At any decision point (as to whether or not to cross), the decision is based upon the generalised delays of the different available routes (i.e. the generalised delay is summed over
all
the places that a route crosses either the main road or a "side-street").It was considered important in VRU-TOO to compare parameter values derived in Portugal with those derived in England. Hence, on a site in Coimbra (Portugal) the crossing behaviour of 277 pedestrians was observed over three days within the period 8.45 to 17.15. Part of the data was observed directly: namely the routes chosen by pedestrians, the signal stage at their arrival at a crossing, pedestrian classification and the time of observation. Recordings made by two video cameras (which covered the site) enabled the remaining data, namely pedestrian delay and vehicle flows, to be transcribed later in the laboratory. This data was used to calibrate a new pedestrian route choice model.
3.2.3 Pedestrian Delay I
Car
Flow RelationshipsAs stated above, estimates of delay are central to the W A N route choice model. In VRU-TOO Deliverable 7 (Brun&ll-Freij and Timms, 1993), it is explained why modelled estimates of delay are used rather than observed estimates.
The models of midblock and zebra crossing delay assume that a pedestrian arrives at the kerbside and expects to be delayed for time D. D is assumed to have an exponential distribution with mean E@) given by:
where $, y~ and
w
are parameters calculated from empirical resultsQ is the car flow conflicting with the pedestrian crossing movement1
DRNE I1 Raject VuX)5 VRU-MO Final Repat
The transferability of this type of relationship (and in particular the parameter values) was checked in VRU-TOO. To do so, data was collected data from four crossings in Coimbra, two of the "mid-block" type and two at "zebras".
Work in VRU-TOO developed formulae for the (truncated) expected delays of pedestrians arriving at
a
signalised crossing duringa
particular stage of the cycle, so that the overall expected delay is given by:where Di is the (truncated) expected delay if arriving during stage i si is the length of stage i
c is the signal cycle time
3.2.4 Use of SATURN
The main emphasis of modelling work in VRU-TOO has been on pedestrians. However, it is recognised that it is important to try to predict the effect on cars of pedestrian-oriented policies. With this objective, an exercise was carried out in V1031 to assess the effects on road traffic of pedestrian-friendly policies in Leeds, England, using the motorised vehicle model SATURN (Van Vliet, 1982). The results of this exercise were reported by Timms and Carvalho (1991). It was decided that a similar exercise should be carried out in VRU-TOO, this time testing the effects of pedestrian-friendly policies in Coimbra in order to examine whether there were any significant problems of technology transfer from UK to Portugal.
3.3 BEHAVIOURAL STUDIES WORK AREA
The behavioural studies have focused on three major objectives. The first was to identify relevant behavioural indicators of pedestrian safety and comfort at crossings. The second was to provide rule specifications for pedestrian interactions and conflicts. The behaviour-safety relations serve as
a
basis for the development of a safety model. On the basis of these preliminary activities, a framework for behavioural and safety evaluation of pedestrian detection systems was devised and applied in the pilot implementations that were realised in Leeds (UK), Elefsina (GR) and Porto (P).3.3.1 Behavioural data collection protoeol
The general aim of the activity was to define and quantify behavioural variables related to the safety and comfort of pedestrians.
DRIVE I1 Project VU)05 VRU-TOO Final Report
preceding interactions leading to a conflict could not be deduced. Consequently, relationships between pedestrian behaviour and safety could not be quantified. Nonetheless, a preliminary list of relevant behavioural variables could be construed. Furthermore,
a
data collection protocol was formulated that could be used for further work.This protocol can be summarised as describing crossing behaviour in three stages:
1. approach phase: starting at a distance of about 3 meters away from the point where the pedestrian leaves the kerb and ending at the kerb.
2. first half crossing phase: starting at the point where the pedestrian leaves the kerb and ending at the middle of the road.
3. second half crossing phase: starting at the middle of the road and ending a the point where the pedestrian reaches the opposite kerb.
Within these
three
phases the following independent variables were scored: CourseVisual orientation
In addition to these variables, the following characteristics of the pedestrian and the traffic situation were scored:
Personal variables
SociaYsituational variables Traffic variables
Conflicts between pedestrians and motorised traffic were scored in accord with the Swedish Traffic Conflicts Technique developed by the University of Lund (Hyden, 1987). The Traffic Conflicts Technique is a complementary technique to accident analysis for safety assessment. The basic concept is that there is a relationship between serious conflicts and injury accidents. These accident comparable events called serious conflicts, are recorded by human observers. A serious conflict is
a
conflict with a small margin. The margin is set by the TA-value (time to accident value) and the initial speed. The TA-value is the time from the moment when one road user starts an avoidance action to the momenta
collision would have occurred if no evasive action had been undertaken. The border line which distinguishes serious conflicts from non-serious conflicts represents the time margin necessary for braking plus 0.5 seconds.To validate the preliminary selection of critical variables and to quantify behaviour-safety relationships em&cally, an observation study was carried out. Two different types of intersections were identified: signalised and non-signalised intersections. One intersection of each type was selected in the UK,
6,
P, and S. To increase comparability of the intersections, several criteria with regard to situational characteristics such as road lay-out and traffic flows were applied.The objective of the study was to investigate which crossing behaviour could explain conflict occurrence. Therefore, a novel approach had to be adopted involving simultaneous behaviour observation, recorded on videotape, and conflict observation on the spot, thus allowing comparison of behaviour that was conflict-related with behaviour in similar situations that did not lead to a conflict. For this purpose "encounters" were defined as interactions between pedestrians and vehicular traffic that did not lead to conflicts. Four types of encounter were identified:
DRNE n Roject VXOS VRU-TOO Final Re@
type B: The pedestrian stops or slows down at the kerb to allow a vehicle driving on the far-side lane to pass and crosses behind that vehicle.
type C: The pedestrian meets a vehicle driving on the near-side lane and crosses in front of that vehicle
type D: The pedestrian, while crossing the first half, meets a vehicle on the far-side lane and crossing behind that vehicle.
type E: The pedestrian, while crossing the first half, meets a vehicle driving on the far-side lane and crosses in front of that vehicle.
Observations were carried out for 50 hours at each location. Conflicts scored during the observations were identified on videotape and the behaviour preceding the conflict analyzed. In addition, samples of videotape recording were used to analyse non-conflictuous behaviour. Thus, behaviour of pedestrians preceding conflictuous and non-conflictuous interactions could be identified.
3.3.2 Rule specifications for pedestrian interactions and conflicts
The objectives of the work were to quantify and formulate logical rules to describe the empirically found relationships between situational characteristics, the behaviour of the pedestrians, and road user interactions and conflicts. For this purpose, a reliability check of the conflict data, a decision tree analysis, and a reanalysis of the observational data was carried out that allow the calculation of conflict-encounter ratios.
The objectives of the reliability test of the conflict observations was twofold. Firstly, the test served to check the observers' judgement of the basic parameters, i.e. speed and time to accident, and secondly the test served to check whether the database included events other than serious conflicts. The objective of the decision tree analysis was to provide a quantitative description of the relative risk of specific pedestrian crossing behaviour strategies. The objective of the reanalysis of the observational data was to allow the description of conflict-encounter ratios in quantitative terms and to allow the testing of a number of hypotheses that were formulated on the basis of earlier stages of the work.
The analysis followed a step-wise approach. In the first step a reliability test of the conflict studies was carried out to check for errors due to observer variability. This was considered necessary, as the conflict observations in the different countries were carried out by different observers. Although all observers had followed
a
formal training in conflict observation, differences in the subjective judgement of the seriousness of conflict could not be ruled out. It would also be possible that the observers judgements with regard to the severity of the conflicts would drift over time, especially at locations where few conflicts would be observed. The method followed was to check the original conflict observations against the video observation material that was recorded at the time of the conflict observations.A random selection of 20 conflicts per country (10 from the signalised and 10 from the non- signalised intersection) was made and the conflicts, 60 in total, were analyzed on video by an
DRIVE U Pmjen V2005 VRU-TOO Final Report
accident (TA) was carried out as well as a general judgement whether the event
was
a conflict or not.In the second step a decision tree analysis of crossing behaviour was made. For this purpose the database produced in an earlier stage of the project was used. This database contains a very detailed description of the pedestrian behaviour in relation to approaching traffic. Earlier analyses had considered the behaviour elements separately. This allowed the formulation of behavioural strategies for which a conflict-encounter ratio could be calculated. These conflict-encounter ratios
are used as an indication of the relative dangerousness of the different strategies used by pedestrians.
In the third step the original data were reanalysed to allow calculation of the conflict-encounter ratios in absolute terms. For this purpose, 5 minute periods of videotape were scored on the number and type of encounters occurring. Subsequently, a number of hypotheses were formulated and tested. Further data analysis included logistic regression analyses for modelling pedestrian behaviour in encounters.
3.3.3 Behavioural and conflict evaluation of pilot project implementations
The objective of the study is to assess the effects of the pilot project implementations on the micro-level behaviour of pedestrians and to assess the effects of these implementations on the occurrence of conflicts between pedestrians and motorised traffic. The implementations involve the application of advanced pedestrian detector systems at signalised crossings in Elefsina (Greece), Porto (Portugal) and Leeds
(UK).
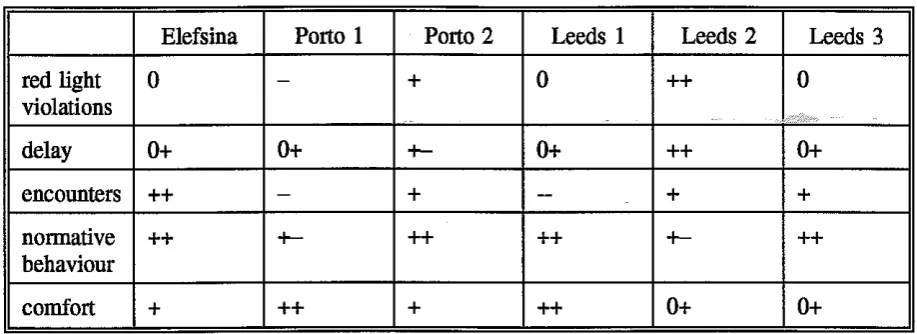
The technical description of these applications and the description of the implementation sites is provided in section 3.1.3 of this report. [image:19.595.72.417.544.680.2]The assessment indicators were selected on the basis of the results of the work described in the preceding paragraphs. Specifically, the study focused on the behavioural parameters shown in Table 1.
Table 1: Behavioural Criteria and Indicators
The behaviour of the pedestrians was recorded both before and after the pilot implementations for a period of at least five working days. At least two weeks elapsed after implementation before
"after"
recordings were made. Recording hours were chosen such that both peak and off-peak14 Behavioural Criteria
safety
comfort
Indicators
red light violations
number of pedestrianlvehicle encounters
pedestrians' normative behaviour
waiting time before crossing
DRIVE U Project VUX)S VRU-TOO Final Report
period were included. Recordings were made on videotape which also registered a time-frame and the pedestrian and main vehicle stream traffic light signal stages. Pedestrian behaviour was scored from these videotape recordings using the parameters defined in the earlier stages of the project. Variables that were scored included: 1) general information; 2) pedestrian characteristics; 3)
situational characteristics; 4) traffic light stages; 5) pedestrian's course of crossing; 6) timing of crossing; 7) head movements; 8) presence of other pedestrians and 9) description of encounters that occufied.
DRIVE I1 Roject VuX)5 VRU-TOO
4
ACHIEVEMENTS
4.1 PILOT PROJECT WORK AREA
The primary objective of this work area was to carry out three major pilot trials at sites in urban areas where there was an existing problem relating to the needs of pedestrians wishing to cross a major trafficked route. In the three cases selected there were existing safety and mobility problems that could not be solved by the usual radical solution of complete segregation (either by banning vehicles or by diverting pedestrians over or under the road). Thus the introduction of intelligent crossings was seen as providing one more tool for highway engineers to improve conditions for pedestrians in urban areas. At the feasibility stage of the project it was discovered that at one of the sites the setting of the signals was not at its optimum positions, and therefore it was still possible that further improvements could be achieved with existing technology. Therefore the workings of that location were improved to the level of best practise before the actual trial began. This process was followed at the two other sites where no signal settings were introduced prior to the trial. Thus the data collected during the before period at each site was as for best practise for existing technologies. During the life of the project much of the effort within this work area was concentrated upon the designing and implementation of the pilot trials in the three countries and the organisation and collection of all the relevant data so that the results from the trials can be accurately evaluated. Time and effort was also spent in ensuring that the coordination and cooperation with the relevant national and local highway agencies was maintained so that the trials could be implemented. In addition this meant discussions with various commercial firms regarding the supply and modification of equipment needed to carry out the trials. At the times of the trials press releases and other publicity attractions were devised so as to widen the press exposure to the innovative nature of the new measures that were to be installed.
All
of the trials and the associated data collection exercises were completed, as per programme.In order to assess whether the trials had been successful the project, at its very beginning specified at set of overall objectives that it wished to see achieved and a set of specific objectives for each trail site. It would be against these pre-determined objectives that the success or failure of the trials would be determined.
The overall objectives of the project that were used in the design of the trial were:
a) To improve the safety and mobility of pedestrians, especially children, without significantly worsening conditions for motorists.
b) To show that the results obtained from the trial are consistent with those obtained in Northern Europe, especially from DRlVE I project V1031.
DRIVE n Pmjen VUX)S VRU-TOO Pinal Repon
Each of the sites is discussed separately below. The behavioural evaluations of the implementations, including the conflict studies, are presented in greater detail in section 4.3.3.
4.1.1 Elefsina, Greece
In the case of Elefsina the overall objectives were translated into the following specific objectives:
a) There should be a significant reduction in the number of pedestrians who have to wait for more than 10 seconds before crossing the main road.
b) There should be
a
reduction in the number of serious conflicts between mGn road traffic and pedestrians.An analysis of the results shows that:
There has been a 22% overall reduction in the number of serious conflicts (a 51% reduction on the "VRU-TOO side with pre-arrival detection, a 10% increase on the "Ministry" side with green extension).
There has been a small reduction in the overall pedestrian delay, from
a
mean of 18.5 secs to 17 secs. This has been most marked in the proportion of pedestrians who wait for more than 30 seconds, where there has been a decrease from 28 percent to 18 percent.There has been an increase in the proportion of pedestrians who arrive at the crossing on a green signal from 5 percent to 9 percent.
There was a slight reduction in the number of vehicles who violated the red light on the main road from 7 to 5 vehicles per hour.
There was no increase in the length of the vehicle queues (a slight reduction was observed, but it was not statistically significant).
In addition to the above main trial specified above, additional work was carried out in Elefsina to apply microwave detection to build up a long-term pedestrian movement profile. This test was intended to confirm that the information from the detector could be extended to indicate quantity of flows. In the Greek situation, such information on flow could assist in setting up and implementing signal plans in a fixed-plan type UTC. In order to assist with this work, a small additional test was set up at a site with a particular pedestrian demand so that the pedestrian demand profile over
a
long time period (at least one month) could be monitored and evaluated.Conclusions
DRNE I1 Rojed VuX)5 VRU-TOO Final Re@
4.1.2 Porto, Portugal
In the case of Porto the overall objectives were translated into the following specific objectives:
a) There should be a reduction of at least 10% in the number of children who cross the road against a red light.
b) There should be a significant reduction in the number of serious conflicts between main road traffic and child pedestrians.
c) There should be no increase in the number of vehicles going through red lights.
d) There should be no significant increase in the maximum queue lengths for vehicles on the main road.
The results were as follows:
There was a reduction in the number of pedestrians who waited longer than 20 seconds. There was also a reduction in the number of children who waited for this time but the difference was not significant.
There was no significant change in the number of pedestrian red light violations by adults or children, although there were variations in the effects on different sides of the dual carriageway.
.
There was a slight overall reduction of 2% in the number of serious conflicts but this was not statistically significant.There has been no increase in the observed traffic queue lengths and also no significant increase in the length of the stated vehicular journey times..
These results have been slightly complicated by the fact that there was a 6% reduction in the total traffic flows across the pedestrian crossing, between the before and after data collection phases, probably due to other temporary road works which took place on another section of the main radial route. There was no overall change in the number of pedestrians crossing the road.
Conclusions
DRIVE n Prajea V2005 VRU-TOO Final Re@
4.1.3 Leeds, United Kingdom
In the case of Leeds, the overall objectives were translated into the following specific objectives:
a) There should be a reduction in the number of pedestrians who cross the road against a red light.
b) There should be a reduction in the number of pedestrians who wait for longer than 20 seconds.
C) There should be a reduction in the number of serious conflicts between m&ii load traffic and pedestrians. (Due to the restricted time for evaluation, direct comparisons of injury accidents is not possible)
d) There should he no increase in the number of vehicles going through red lights.
e) There should be no significant increase in the total time for vehicles to travel through the length of the main road under consideration.
The specific objectives recorded above relate to the whole length of the CCL under consideration.
The data collected was aggregated so as to assess whether each objective has been obtained;
however obviously note has been taken of the results at each individual location. In theory objectives (a) through (d) could have been achieved at each of the locations individually, but because of the limitations on the amount of data that can be collected and the timescale which has been involved in this effort, it was not possible to statistically confirm the results at each individual location. Therefore in some instances the data will be aggregated.
The results from this trial show the following:
There has been a reduction in the number of pedestrians who crossed the road whilst the signals were green for vehicles.
There was a 17% reduction in the number of serious conflicts at the major crossing point along the length, but this was not statistically significant. At the other two crossing points, the original level of conflicts was much lower. At one there was a significant (p=.09) reduction from 4 to 1, and at the other there was no change from the initial 10 conflicts. The overall reduction in conflicts was 18%, which is significant at the .10 level.
There was a slight reduction in the number of pedestrians who waited for more than 20 seconds.
There was no increase in the number of vehicle red light violations.
There was no increase in any of the queue lengths but the survey has shown some increase
DRNE I1 Project V2005 VRU-TOO Final Repat
Conclusions
The results of this trial showed that it was possible to incorporate such intelligent pedestrian facilities into a City Centre traffic management scheme and obtain benefits for pedestrians without undue problems for vehicles.
4.1.4 Overall Conclusions
In the cases of each of the trials the higher level overall objectives were translated into more specific aims which could be accurately judged by means of analysing the data that had been collected. Although these specific aims varied in degree from site to site, their undcibing themes were common and thus the results can be summarised under the following headings.
Pedestrian Safety
In all three locations there was an overall reduction in the number of serious conflicts between pedestrians and other vehicles. There were however considerable variations between the sites and even between different carriageways on the same site.
There were no increases in the number of vehicles going through red lights.
Pedesbian Mobility
There was a reduction in the average length of time pedestrians had to wait at the kerb edge.
There was an overall increase in the number of pedestrians who arrived at their crossing point to a green signal, this increase was greater than would have been expected from the actual increase in pedestrian green time on the signals.
Tramc Flows
There was no significant increase in vehicle queue length at the individual sites although there was a slight increase in overall journey time over the length in Leeds (UK).
In addition to the factors above which showed that the objectives of the trials were achieved it should also be noted that the equipment proved itself to be reliable throughout all the trials with very little need for adjustment. In addition an extra check was carried out in Leeds to confirm that all pedestrians were detected and that there were no spurious detections that would cause false green time. This check confirmed the efficiency and reliability of the equipment.
4.2 COMPUTER MODELLING WORK AREA
4.2.1 Pedestrian Delay
I
Car Flow RelationshipsDRIVE I1 Project VUMS VRU-TOO Final Report
I
-
Reg-Equation0.00
4
I0 200 400 600 800 1000 1200 1400 1600 1800
[image:26.602.52.548.80.345.2]Vehicle Flows (vehlh)
Figure 4: Pedestrian delay I car flow relationships at midblock crossings
be seen that there is a great similarity between the two regression equations, with an almost constant shift towards reduction of delay (whatever the flow level) in the Poltuguese situation. This could suggest either that there is a higher level of risk-taking in the Portuguese pedestrian population or that there is a greater level of courtesy from Portuguese drivers.
0.00
4
I400 600 800 1000 1200 1400 1600
Vehicle Flows (vehlh)
[image:26.602.46.529.484.710.2]DRIVE U Pmject VZOO5 VRU-TOO Final Report
Figure 5 shows the relationship between car flows and pedestrian delay at zebra crossings. Unfortunately (from a modelling point of view), the relationship was found to be quite different at the two sites sampled in Coimbra ("Site 10" and "Site 20"). At Site 20, pedestrian delay was found to be virtually insensitive to car flow. Hence Figure 5 gives two relationships:
"
Regr-CrosslO" and "Regr-Cross20", corresponding to these two sites. As with the midblock results, both relationships are compared with the London results obtained by Goldschmidt. Two comments can be made about these results:
(i) The Coimbra relationships give smaller values of delay than the Goldschmidt relationship at all levels of car flow. This result is similar to the midblock case and similar possible conclusions can be drawn.
(ii) Differing pedestrian behaviour at zebras was not discussed in Goldschmidt's work. It is thought that it can be explained by two factors: differences in pedestrian flow (much higher at Site 20) and in vehicle speed (higher at Site 10).
4.2.2 Pedestrian Route Choice
The nested logit model structure, used to describe route choice in WLCAN, is very flexible.
Given a network of the WLCAN-type the model contains enough parameters to adapt to very large variations in observed route choice, which implies a good transferability.
However, there was a difficulty in testing the transferability of model formulation because of the impossibility of finding a "similar" site to the Bradford site where the original nested logit model was calibrated: sites in Coimbra that were similar for most purposes all had "middle is&ds" in
the road. This leads to increased complexity of the network (and hence sets of crossing choices). It followed that the amount of data that was collected in Bradford (and which was sufficient to create a statistically good nested logit structure) was not sufficient to create stable and statistically significant results in Coimbra.
In order to apply transferability tests of parameter estimates a non-nested multinominal model was constructed. In spite of the disappointment about not being to test model formulation directly, it should be pointed out that this multinomial model was far superior in terms of behavioural sophistication to the simple binomial model produced in DRIVE I (see Brundell-Freij and Timms (1993) for details of the latter).
Table 2 summarizes estimates of
a
values for five sets of variables ("Coimbra 1" to "Coimbra 5") for the non-nested multinomial model for Coimbra, together with the corresponding Bradford ("Default") values. The data set that is most comparable with the default values is "Coimbra 5": the only different variable between the two models is 'Walking middle island". The comparisons given below thus concentrate on these two sets of estimates.DRIVE Il Projen VU)o5 VRU-TOO Final Report
It can be seen that pelicans are attractive in both locations, scoring relatively high positive values. Comparing the attractiveness of both pelicans and signals between Bradford and Coimbra, we find surprisingly similar results for people under the age of 65. For the elderly, however, there is a striking difference between the two locations. For example, men over 65 in Bradford would accept a delay of up to 38 seconds ( (3.12+2.26)/0.14 ) at a pelican to avoid an unsignalized crossing place, whilst the equivalent group in Bradford would only accept
a
delay of up to 4 seconds ( (1.38-0.40)/0.23 ). In fact, the estimates show that the Coimbra pelican is less attractive to older people than to younger people. As above,a
possible explanation for the difference between Bradford and Coimbra is to do with the difference between city centre and residential area: the over 65's in a residential area would be likely to be older, and hence more cautious, than those found in a city centre area. [image:28.595.76.525.363.762.2]In general, Table 2 indicates many similarities and a few dissimilarities. Since there is the possibility that dissimilarities could be explained by the difference between residential and city centre locations, it would appear that the transfer of parameter values was a far smaller problem than might have been expected.
DRNE I1 Rojeet VZI05 VRU-TOO
4.2.3 Use of SATURN
The exercise using SATURN to assess the effects on cars of pedestrian-friendly policies in Coimbra has been fully documented by Godoy (1992). The main conclusions were as follows:
The SATURN programme has a large number of options and parameters that can be set by the user. In a purely programming sense it is straightforward to transfer it from
UK
to Portugal and change values for parameters such as gap acceptance, give way rules, traffic signal standards, average vehicle length, saturation flows and whether there is right or left hand drive.
However, there is a potential problem in Portugal of lack of availability of "standard" values of many parameters. Thus, estimates of such values rely more upon the experience of the engineer using the model than would be the case in the UK. It follows that, at present, the programme needs to be
run
by more experienced users (in terms of traffic knowledge) in Portugal.There was a problem "fitting together" the car network with
a
pedestrian network, in view'
of the more complex behaviour of pedestrians. This was
a
result found also in the "parallel" study in Leeds (Carvalho, 1990) and so is not essentially a transferability issue.4.3 BEHAVIOURAL STUDIES WORK AREA
4.3.1 Reliability of conflicts
The reliability check of the conflict observations produced a comparison between the selected conflicts observed and the scoring of the same events from videotape. The results were plotted in Speed
-
TA graphs indicating scoring differences as represented by arrows. The results indicated clearly that serious conflicts were correctly identified and that no problem with observer reliability could be found. Only four conflicts out of 60 were considered non-serious conflicts in this test. The locations were selected on the basis of a priori definitions of intersections in order to achieve maximal comparability, which implies that the locations cannot be considered as typical locations for the different countries. The number of conflicts observed is therefore not an indication for the number of conflicts occurring at typical intersections in the different countries. The fact that, as intended only the serious and potentially dangerous conflicts were scored, indicates that it might be difficult to compare the number of conflicts in absolute terms. However, for the purpose of the study, comparison of the conflict and encounter ratios, the conflict data collected seem well suited.4.3.2 Decision tree analysis
DRNE I1 Rojed Vm05 VRU-TOO Find Report
For crossing a non-signalised intersection the number of possible strategies is 8 and 16 at first lane and second lane encounters, respectively.
Signalised intersections
When having an encounter on the first lane of a signalised intersection, five crossing strategies (out of the 16) were used most often. These were:
1. pedestrian makes head movements during approach; pedestrian traffic light is red at
departure from kerb; pedestrian changes tempo (slows down or stops) at kerb; and makes head movements at kerb (% of cases: 18; conflict ratio: .04).
2. pedestrian makes head movements during approach; pedestrian traffic light is green at
departure from kerb; pedestrian changes tempo (slows down or stops) at kerb; and makes head movements at kerb (% of cases: 18; conflict ratio: .07).
3. pedestrian makes no head movements during approach; pedestrian traffic light is green at
departure from kerb; pedestrian does not change tempo at kerb; and makes no head movements at kerb (% of cases: 13; conflict ratio: .45).
4. pedestrian makes no head movements during approach; pedestrian traffic light is red at
departure from kerb; pedestrian changes tempo (slows down or stops) at kerb; and makes head movements at kerb (% of cases: 13; conflict ratio: .05).
5. pedestrian makes no head movements during approach; pedestrian traffic light is green at
departure from kerb; pedestrian changes tempo (slows down or stops) at kerb; and makes head movements at kerb (% of cases: 12; conflict ratio: .28).
Five strategies were used less often in these circumstances, but much more likely to result in conflict. WHAT WERE THEY??? These five highly dangerous strategies take 22% of all encounters giving a conflict ratio of .65.
When having an encounter on the second lane of a signalised intersection, only 13 of the theoretically possible 32 crossing strategies
are
used (more than 4 times in the database). Five of these are used most often, namely:1. pedestrian makes no head movements during approach; pedestrian traffic light is green at
departure from kerb; pedestrian does not change tempo at kerb; makes no head movements at kerb; and makes no head movements on f&t l a 4 (% of cases: 18; conflict ratio: .17). 2. pedestrian makes no head movements during approach; pedestrian traffic light is green at
departure from kerb; pedestrian changes tempo at kerb; makes no head movements at kerb; and makes no head movements on first lane (% of cases: 14; conflict ratio: .09).
3. pedestrian makes no head movements during approach; pedestrian traffic light is green at
departure from kerb; pedestrian changes tempo at kerb; makes head movements at kerb; but makes no head movements on first lane (% of cases: 12; conflict ratio: .05).
4. pedestrian makes head movements during approach; pedestrian traffic light is red at
departure from kerb; pedestrian does not change tempo at kerb; but makes head movements at kerb; and makes head movements on first lane (% of cases: 8; conflict ratio: .38).
5. pedestrian makes no head movements during approach; pedestrian traffic light is red at
DRIVE I1 Rajea VuX)5 VRU-TOO Final Repart
These five strategies took 61% of the cases and had a conflict ratio of .16.
Two strategies were used less often in these circumstances, but highly conflictuous. These two strategies took 12% of the cases and had a conflict ratio of 65.
When having an encounter on the first lane of a non-signalised intersection, six of the eight possible crossing strategies were used. Three of these six were used most often. These were:
1. pedestrian makes head movements during approach; pedestrian changes tempo at kerb; and makes head movements at kerb (% of cases: 40, conflict ratio: .14).
2. pedestrian makes no head movements during approach; pedestrian changes tempo at kerb; and makes head movements at kerb (% of cases: 28; conflict ratio: .04).
3. pedestrian makes head movements during approach; pedestrian does not change tempo at kerb; but makes head movements at kerb (% of cases: 18; conflict ratio: .51).
These three strategies alone took 86% of the cases and had a conflict ratio of .18. The other three strategies were less often used in these circumstances, but very likely to result in conflict. These relatively dangerous strategies took the other 14% of the cases and had a conflict ratio of 35.
When having an encounter on the second lane of a non-signalised intersection, only four crossing strategies were used:
1. pedestrian makes head movements during approach; pedestrian does not change tempo at kerb; but makes head movements at kerb; and makes head movements on first lane (% of cases: 43; conflict ratio: .43).
2. pedestrian makes head movements during approach; pedestrian changes tempo at kerb; makes head movements at kerb; and makes head movements on first lane (% of cases: 26; conflict ratio: .38).
3. pedestrian makes no head movements during approach; pedestrian changes tempo at kerb; makes head movements at kerb; and makes head movements on first lane (% of cases: 19; conflict ratio: .09).
4. pedestrian makes no head movements during approach; pedestrian does not change tempo at kerb; but makes head movements at kerb; and makes head movements on first lane (%
of cases: 13; conflict ratio: .19).
These four strategies led to
an
overall conflict ratio of .32.In considering these results, it should be realised that the calculated ratios for the different strategies are based on data that contain a fixed number of encounters. While this provides
an
DRIVE I1 Project V2005 VRU-TOO Final Report
4.3.3 Analysis of encounter-conflict ratios
The second analysis of the video-registrations of the pedestrian behaviour resulted in estimates of the true number of encounters that occurred during the video-registrations. All encounters were collected from video for
a
10% period of the total hours of observation per junction. A check was made to see whether there was any relationship between the countries and the event types using the ratio of conflicts to the overall number of events. Only the data collected in The Netherlands and United Kingdom could be used because these two data sets have been collected in a consistent manner. A chi-square test revealed no significant relationship. Thus the formulated hypotheses can be tested independent of the country in which the data have been collected..
conflcts are more likely with turning trafic than with trafic travelling straight ahead.For encounter/conflicts of type A, this is the case at signalised intersections (C2=131.0, df=3, p < ,0001) but not at non-signalised intersections (C2=3.75, df=3, NS). For encounter/conflicts of type C and those of type D no difference is found at either signalised or non-signalised intersections. For encounter/conflicts of type E, the ratio in fact appears to be lower for turning traffic.
.
children will be more often involved in encounters of type C than adults. The analysisshowed that when
a car
approaches on the first lane, 44.5% (n=81) of the children crossed in front of the vehicle, while only 22.7% (n=260) of the adults did so. This difference is highly significant (C2 = 38.89, df=l, p<
.0001)..
higher conjlict-encounter ratios occur at non-signalised junctions than at signalised intersections. While this is indeed found for the first half of the crossing (non-signalisedencounter ratio = .05; signalised ratio = .02), it is not the case for the second half of the crossing (ratios .2 and .19, respectively).
.
high approach speeds of the vehicle increase the likelihood of the pedestrian crossing behind the vehicle, and high approach speeds increase the conjlict-encounter ratio. Thesehypotheses could not be confirmed.