White Rose Research Online URL for this paper:
http://eprints.whiterose.ac.uk/73200/
Version: Published Version
Monograph:
Bradshaw, J (2006) How has the Child Poverty Rate and Composition Changed?
Research Report. Joseph Rowntree Foundation , York.
[email protected] https://eprints.whiterose.ac.uk/ Reuse
Items deposited in White Rose Research Online are protected by copyright, with all rights reserved unless indicated otherwise. They may be downloaded and/or printed for private study, or other acts as permitted by national copyright laws. The publisher or other rights holders may allow further reproduction and re-use of the full text version. This is indicated by the licence information on the White Rose Research Online record for the item.
Takedown
If you consider content in White Rose Research Online to be in breach of UK law, please notify us by
How has the child poverty rate and
composition changed?
The Joseph Rowntree Foundation has supported this project as part of
its programme of research and innovative development projects, which it
hopes will be of value to policy makers, practitioners and service users.
The facts presented and views expressed in this report are, however,
those of the author[s] and not necessarily those of the Foundation.
Joseph Rowntree Foundation
The Homestead
40 Water End
York YO30 6WP
Website: www.jrf.org.uk
© University of York 2006
First published 2006 by the Joseph Rowntree Foundation
All rights reserved. Reproduction of this report by photocopying or
electronic means for non-commercial purposes is permitted. Otherwise,
no part of this report may be reproduced, adapted, stored in a retrieval
system or transmitted by any means, electronic, mechanical,
photocopying, or otherwise without the prior written permission of the
Joseph Rowntree Foundation.
A pdf version of this publication is available from the JRF website
(www.jrf.org.uk).
Introduction
This note is designed to draw attention to how the pattern of child
poverty has changed since the Labour Government started to take an
interest in the issue with the Prime Minister’s pledge in 1999. The
analysis is entirely based on published data – the Households Below
Average Incomes analysis by the Department for Work and Pensions.
This analysis is based on data in the reports since 1999/00 because that
is the first year that the DWP began to publish breakdowns of the poverty
rates and characteristics of children in poverty. Even so the breakdowns
employed in the analysis have changed over the years which make
comparisons over time somewhat problematic. It could be possible to go
back to the original data from each survey to undertake a similar
analysis. However there are probably advantages in following the DWP
statisticians’ methodology and it is worth using the data to tell us
something about what had been achieved and which groups have
benefited most from the changes in demography, labour market and
policy that have influenced trends in child poverty.
As well as increased employment rates and changes in the
characteristics of families, changes in child poverty may have been
influenced by any of the following factors:
•
the introduction of the minimum wage in 1998 and its uprating,
particularly in October 2002 and 2003, by more than the rate of
inflation;
•
the increases in Child Benefit, particularly the increase in child benefit
in 2000 which much exceeded movements in prices;
•
the replacement of Family Credit by Working Families Tax Credit from
October 2001 with a premium for disabled children, a disregard of all
Child Support payments from non-resident parents and childcare tax
credit;
•
the introduction of Child Tax Credit in 2002 and the large increases in
2003 and 2004;
•
the new Child Support Scheme which began to operate from March
2003, introducing a £10 disregard for parents with care on Income
Support.
So the questions this analysis seeks to answer are:
1. Which children have benefited from these changes and trends?
2. How have the policy changes and trends changed the composition of
poor children?
change upwards or downwards without any impact from other factors.
Also policy could change the poverty rate for a group but it might make
little impact on the overall rate because the group affected by the policy
change was small. The analysis includes the picture both before and
after housing costs.
The Family Resources Survey on which this analysis is based is a
sample survey and therefore variations in rates and proportions could be
expected due to sampling errors. The DWP estimates that changes in
the proportion of children below 60 per cent of the median need to be in
the order of 1.5 per cent to be statistically significant at the 95 per cent
confidence level. However we are interested in changes in poverty rates
of sub groups some of which are small and therefore subject to larger
sampling errors. We have therefore only acknowledged changes in
proportions in excess of 3 per cent and then only when there is a clear
trend in the data rather than what might be year to year fluctuations.
Results
Table 1 compares the poverty rates over the period 1999/0 to 2004/5
after housing costs. Care needs to be taken because the classification of
categories is not entirely consistent over time and there was less detail in
the breakdowns in the earlier period. The 1999/2000 data is not strictly
comparable because it excludes the self employed. However from the
table we observe that there has been a significant change (reduction
unless stated) in the poverty rate of children in the following households:
•
lone
parents
•
lone parents not working
•
four children or more
•
one or more disabled adults
1•
one or more disabled children
1•
Tax Credit recipients (in 2003/4 because of the expansion in eligibility)
•
under 25 and under 29
•
youngest child under 5
•
Outer London (up)
•
South
east
•
Scotland
•
Wales
1
Table 1
Child poverty rate - % children living in households with income below 60
per cent of the median after housing costs
1999-2000
2000-1 2001-2 2002-3 2003-4 2004-5
All children 32 31 30 28 28 27
Economic status and family type
Lone parent: 59 55 54 52 48 48
of which
in full time work 12 12 15 9 13
in part time work 32 38 33 27 27
not working 77 75 76 74 72
Couple with children: 22 23 22 21 21 20
of which
self-employed 31 28 25 27 29
both in full time work 2 1 3 3 2
one in full time work, one in part time work 6 7 6 6 6 one in full time work, one not working 25 22 21 21 21
one or more in part time work 54 60 58 55 49
both not in work 76 81 80 77 72
Economic status of household1
All adults in work 11 10 12
At least one but not all in work 19 19 19 32 32 31
Workless households 81 80 79 79 77 75
Number of children in family
One 25 24 25 25 24 23
Two 26 25 24 24 24 23
Three 45 36 35 32 29 30
Four or more 56 50 48 51 50
Disability
No disabled adults 29 28 27 26 26 25
1 or more disabled adults 45 43 43 39 38 40
No disabled children 31 30 29 28 27 27
1 or more disabled children 40 36 35 31 31 30
of which
no disabled adults in family 33 34 29 25 28 26
1 or more disabled adults in family 50 39 46 40 36 37
Ethnic group
Mixed 41 34 44 39
Asian or Asian British 47 55 53 47
of which
Indian 49 37 36 22 42 33
Pakistani/Bangladeshi 73 73 69 75 63 57
Black or Black British 49 41 46 49 43
Chinese or other ethnic group 52 44
Benefit/tax credit receipt of family
Disability Living Allowance 24 24 23 19 23
Jobseeker’s Allowance 85 84 87 80 73
Incapacity Benefit 48 47 42 40 46
Tax Credits 37 36 36 18 22
Income Support 76 75 75 74 71
Housing Benefit 75 76 74 74 69
Not in receipt of benefit/tax credit listed above 14 14 12 18 16
Age of mother in family1
under 25 62 53 52 41
25 to 29 49 49 43 43 37
30 to 34 41 39 33 31 31
35 to 39 36 34 25 24 26
40 to 44 27 27 21 22 22
45 to 49 25 23 22 20 20
50 and over 23 23 22 23
Age of youngest child in family
under 5 35 33 32 30 29
5 to 10 31 30 29 29 28
11 to 15 25 24 24 24 24
16 to 18 17 17 20 16 15
Geographical disaggregation
England 30 30 29 28 28
of which
North East 37 31 37 30 32
North West and Merseyside 32 32 30 29 29
Yorkshire and the Humber 29 32 30 29 29
East Midlands 29 29 29 25 26
West Midlands 37 32 29 32 30
Eastern 22 24 23 22 22
London 41 35 38 41 39
of which
Outer 26 30 34 33
South East 22 24 20 19 21
South West 27 28 25 26 25
Scotland 30 30 27 25 25
Wales 33 31 30 27 28
Tenure
Local authority 63 59 56 56
Housing association 64 62 58 56
Private rented 62 57 53 49
Owned with mortgage 14 14 14 14
Owned outright 21 25 21 19
Other 12 14 28 34
No savings 49 49 45
Less than £3,000 22 19 21
£3,000 - £7,999 11 12 10
£8,000- £20,000 8 10
more than £20,000 9 9
more than £20,000 9 11
[image:8.612.87.536.52.390.2]4 8
Table 2 compares the composition of child poverty over the period
1999/0 to 2004/5 after housing costs. Again care needs to be taken
because the classification of categories is not entirely consistent over
time and there was less detail in the breakdowns in the earlier period.
From this we observe that there has been a significant change (reduction
unless stated) in the proportion of poor children in the following
households:
•
lone
parents
•
all adults in work (up)
•
three
child
families
•
receiving tax credits (up)
•
not in receipt of benefits
•
local authority tenants
Table 2
Composition of children in poverty – living in households with equivalent
income less than 60% of the median after housing costs
1999-2000 2000-1 2001-2 2002-3 2003-4 2004 -5 Economic status and family type
Lone parent: 45 44 45 45 42 43
of which
in full time work 2 2 3 2 2
in part time work 5 8 8 6 7
not working 36 35 35 34 34
Couple with children: 54 56 55 55 58 57
of which
self-employed 11 11 10 11 12
both in full time work 1 1 1 1 1
one in full time work, one in part time work
5 5 5 5 6
one in full time work, one not working 14 13 13 14 14
one or more in part time work 8 9 9 9 8
both not in work 17 17 17 18 16
Economic status of household1
All adults in work 45 51 52 22 21 24
At least one in work, but not all 29 31 30
Workless households 55 49 48 48 48 46
Number of children in family
One 18 18 19 20 21 21
Two 35 35 36 38 38 38
Three 48 27 26 25 23 23
Four or more 20 19 18 18 19
Disability
No disabled adults 74 74 75 76 77 76
1 or more disabled adults 26 26 25 24 23 24
No disabled children 86 86 88 88 88 88
1 or more disabled children 14 14 12 12 12 12
of which
no disabled adults in family 7 8 7 6 7 6
1 or more disabled adults in family 6 5 6 6 5 5
Ethnic group
Mixed 1 2 1
Asian or Asian British 13 11 11
of which
Indian 3 2 3 2 3 3
Pakistani/Bangladeshi 8 8 8 10 7 7
Black or Black British 4 3 5 6 5
Chinese or other ethnic group 3 3 3
Benefit/tax credit receipt of family
Disability Living Allowance 5 4 5 4 5
Jobseeker's Allowance 7 5 6 5 4
Incapacity Benefit 7 5 5 5 6
Tax Credits 18 19 22 31 45
Income Support 40 43 42 41 40
Housing Benefit 46 50 46 47 46
Not in receipt of any benefit/tax credit listed above
29 28 26 21 17
Age of mother in family1
under 25 8 10 8
25 to 29 15 13 15 14 14
30 to 34 27 27 25 23 23
35 to 39 25 25 25 25 26
40 to 44 16 16 16 17 18
45 to 49 7 8 8 7 8
50 and over 3 4 4 3
Age of youngest child in family
under 5 48 47 44 44 43
5 to 10 34 36 35 36 36
11 to 15 15 15 17 18 19
16 to 18 3 3 3 3 2
Geographical disaggregation
England 87 86 87 88 88
of which
North East 6 5 6 5 5
North West and Merseyside 14 14 13 13 13
Yorkshire and the Humber 9 10 9 9 9
East Midlands 7 8 7 7 7
West Midlands 11 10 10 11 10
Eastern 6 7 7 8 8
London 18 16 19 19 18
of which
Inner 8 9 8 8
South East 9 11 10 9 10
South West 7 7 7 8 7
Scotland 8 8 8 7 7
Wales 6 5 5 5 5
Tenure
Local authority 43 35 35 27 26
Housing association 14 16 16 18 21
Private rented 13 14 13 13 14
Owned with mortgage 28 28 29 34 30
Owned outright 4 6 7 7 6
Other 0 0 1 1 1
No savings 68 69 65 64
Less than £3,000 24 24 23 26
£3,000 - £7,999 4 3 7 4
£8,000- £20,000 2 2 3 3
more than £20,000 2 2 1 1
more than £20,000 1 1
0 1
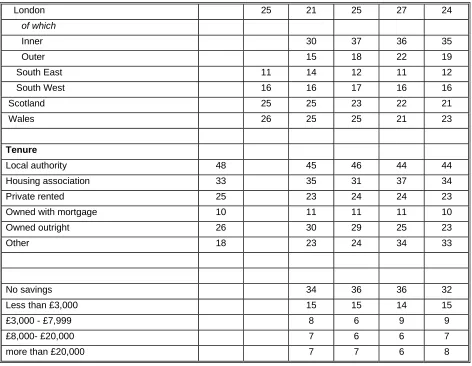
Tables 3 and 4 provide the same data but before housing costs. The
overall child poverty rates are lower. From Table 3 we observe that there
has been a significant change (reduction unless stated) in the poverty
rate of children in the following households:
•
lone parents in part-time work and not in work
•
three and Four children or more
•
Tax credit recipients (in 2003/4 because of the expansion in eligibility)
•
Outer London (up)
Table 3
Child poverty rate - % children living in households with income below
60% of the median before housing costs
Economic status and family type 1999-2000
2000-1 2001-2 2002-3 2003-4 2004-5
All children 23 21 21 21 21 19
Lone parent: 36 34 32 33 32 31
of which
in full time work 8 5 8 11 6 9
in part time work 17 21 19 18 15
not working 50 45 48 49 47
Couple with children: 17 17 17 17 17 16
of which
self-employed 24 23 23 23 25
both in full time work 1 1 2 2 1
one in full time work, one in part time work 3 4 3 3 4
one in full time work, one not working 18 15 15 16 14
one or more in part time work 46 54 51 48 40
both not in work 63 67 70 63 61
Economic status of household1
All adults in work 7 7 8
At least one in work, but not all 13 14 14 27 26 24
Workless households 55 55 52 55 55 52
Number of children in family
One 15 14 15 15 16 15
Two 17 17 16 16 17 16
Three 35 25 27 24 24 22
Four or more 45 40 45 41 41
Disability
No disabled adults 20 19 18 19 19 17
1 or more disabled adults 33 32 33 31 30 31
No disabled children 22 21 20 20 20 19
1 or more disabled children 29 26 25 25 22 24
of which
no disabled adults in family 22 25 19 21 19 19
1 or more disabled adults in family 40 28 35 32 29 31
White 20 19 18 18 18 18
Mixed 21 30 23
Asian or Asian British 46 49 38
of which
Indian 43 32 29 19 36 28
Pakistani/Bangladeshi 67 64 59 65 61 47
Black or Black British 25 27 35 28
Chinese or other ethnic group 28 35 34
Benefit/tax credit receipt of family
Disability Living Allowance 17 16 20 13 18
Jobseeker's Allowance 71 76 75 63 64
Incapacity Benefit 38 36 33 30 36
Tax Credits 27 26 26 13 15
Income Support 49 45 48 49 46
Housing Benefit 48 46 45 47 43
Not in receipt of any benefit/tax credit listed above
10 11 10 15 12
Age of mother in family1
under 20 30 35
20 to 24 28 25 26 27 24
25 to 29 24 23 25 28 21
30 to 34 21 23 24 22 21
35 to 39 18 20 19 20 20
40 to 44 17 17 18 17 18
45 to 49 18 18 19 15 16
50 and over 18 22 19
Age of youngest child in family
under 5 23 21 21 20 19
5 to 10 22 23 22 22 21
11 to 15 19 19 20 21 19
16 to 18 12 13 16 12 14
Geographical disaggregation
England 21 20 20 20 20
of which
North East 32 24 32 25 28
North West and Merseyside 22 24 22 23 22
Yorkshire and the Humber 24 25 24 23 24
East Midlands 25 22 23 20 21
West Midlands 26 24 22 26 24
London 25 21 25 27 24
of which
Inner 30 37 36 35
Outer 15 18 22 19
South East 11 14 12 11 12
South West 16 16 17 16 16
Scotland 25 25 23 22 21
Wales 26 25 25 21 23
Tenure
Local authority 48 45 46 44 44
Housing association 33 35 31 37 34
Private rented 25 23 24 24 23
Owned with mortgage 10 11 11 11 10
Owned outright 26 30 29 25 23
Other 18 23 24 34 33
No savings 34 36 36 32
Less than £3,000 15 15 14 15
£3,000 - £7,999 8 6 9 9
£8,000- £20,000 7 6 6 7
[image:14.612.87.559.51.417.2]more than £20,000 7 7 6 8
Table 4 shows changes in the composition of poor children before
housing costs. Groups that have reduced their share significantly are:
•
three
child
families
•
Pakistani
and
Bangladeshi ethnic groups
•
receiving tax credits (up)
Table 4
Composition of children in poverty – living in households with equivalent
income less than 60% of the median before housing costs
1999-2000 2000-1 2001-2 2002-3 2003-4 2004-5 Economic status and family type
Lone parent: 43 39 38 39 38 39
of which
in full time work 1 2 3 1 2
in part time work 4 6 6 6 5
not working 33 30 30 31 31
Couple with children: 57 61 62 61 62 61
of which
self-employed 13 13 12 12 15
both in full time work 1 0 1 1 1
one in full time work, one in part time work 4 5 4 4 4 one in full time work, one not working 15 12 13 14 13
one or more in part time work 9 11 11 11 9
both not in work 20 20 21 20 19
Economic status of household1
All adults in work 46 20 20 23
At least one in work, but not all 52 55 33 34 33
Workless households 54 48 45 47 46 45
Number of children in family
One 15 15 17 17 19 19
Two 32 34 34 35 36 37
Three 53 27 28 26 25 23
Four or more 24 22 22 20 22
Disability
No disabled adults 72 72 73 74 75 74
1 or more disabled adults 28 28 27 26 25 26
No disabled children 86 88 87 89 87
1 or more disabled children 14 14 12 13 11 13
of which
no disabled adults in family 7 9 6 7 6 7
1 or more disabled adults in family 7 5 6 6 5 6
White 80 79 78 78 76 79
Mixed 1 1 1
Asian or Asian British 15 14 12
of which
Indian 4 3 3 2 4 3
Pakistani/Bangladeshi 11 10 10 12 9 8
Black or Black British 3 4 2 4 6 4
Chinese or other ethnic group 3 3 5 2 3 3
Benefit/tax credit receipt of family
Disability Living Allowance 5 4 7 4 6
Jobseeker's Allowance 7 7 7 6 5
Incapacity Benefit 7 6 5 5 6
Tax Credits 18 20 22 32 44
Income Support 40 37 38 37 36
Housing Benefit 46 43 39 40 40
Not in receipt of any benefit/tax credit listed above 29 32 29 23 18
Age of mother in family1
under 25 6 6 5 7 7
25 to 29 13 11 12 13 11
30 to 34 26 26 25 22 21
35 to 39 27 27 26 28 28
40 to 44 16 17 19 18 20
45 to 49 8 9 10 7 9
50 and over 4 4 4 5 4
Age of youngest child in family
under 5 44 42 41 40 38
5 to 10 36 38 37 37 37
11 to 15 17 17 19 20 21
16 to 18 3 3 4 3 3
Geographical disaggregation
England 85 84 85 86 86
of which
North East 8 5 7 5 6
North West and Merseyside 14 15 13 14 13
Yorkshire and the Humber 10 11 10 10 10
East Midlands 9 8 8 7 8
West Midlands 11 10 10 12 11
Eastern 5 6 5 8 7
of which
Inner 8 9 8 8
Outer 6 8 9 8
South East 7 9 8 7 8
South West 6 6 6 6 7
Scotland 9 10 9 9 9
Wales 6 6 6 5 6
Tenure
Local authority 48 37 37 30 29
Housing association 11 13 12 16 18
Private rented 9 8 8 9 9
Owned with mortgage 26 30 32 32 32
Owned outright 7 10 11 11 10
Other 1 1 1 2 2
No savings 67 68 67 63
Less than £3,000 23 23 21 26
£3,000 - £7,999 4 4 6 5
£8,000- £20,000 3 3 3 3
more than £20,000 2 3 1 2
more than £40,000 1 1
more than £80,000 0 1