EFFECTS OF IMPERFECT INTERFACES ON ACOUSTIC TRANSMISSION AND DIFFRACTION
INTRODUCTION
D. K. Rehbein, L. Van Wyk, R. B. Thompson and O. Buck Ames Laboratory
Iowa State University Ames, Iowa 50011
Contact between the surfaces of a fatigue crack is developed by a variety of mechanisms [1,2], including plastic deformation, sliding of the two faces with respect to one another or the collection of debris such as oxide particles [3]. Consequently, certain characteristic effects occur when the crack is illuminated by an elastic wave. When no contacts are present, a singularity exists in the elastodynamic fields at the crack tip, leading to a set of diffracted fields emanating from the tip. The presence of the contacts modifies the tip diffracted fields and allows energy to be directly transmitted through the crack, requiring modifications in the non-destructive evaluation techniques to detect or size the crack.
A second consequence arises from the creation of a compressive resid-ual stress in the material on either side of the partially contacting crack surfaces. In reaction to this compressive stress, a load arises which produces a local stress intensity factor, KI(local) which shields the crack tip in part from the variations of the externally applied stress intensity factor, KI(global) [4]. This shielding occurs below a stress intensity factor Klclosure at which the first contact during unloading occurs. Thus, the appl~ed stress intensity range, AK = K1max - KI~in will have to be modified to include the effects of crack t~p shield~ng [1,5], leading to an effective stress intensity range, AKeff •
EXPERIMENTAL PROCEDURES
Fatigue Crack Growth
The fatigue cracks to be evaluated were grown in compact tension specimens of Al 2024-T351 by cyclical loading in an electrohydraulic system in laboratory air. Earlier work [5] had suggested that for a fatigue crack that had undergone tensile overload the degree of contact between the crack faces was indicative of the length of the retardation in the crack growth and thus of the size and amount of the overload applied. Three cracks were grown with the growth results shown in Fig. 1. For two of the cracks, growth was achieved under constant AK loading. At a crack length of about
13 mm the stress intensity range was increased to 2.4 AK for 21 cycles for one of the cracks and a single cycle for the other. These overloads resulted in crack retardations as shown, 131,000 cycles for the 21 cycle block and 12,700 for the single cycle overload. The third sample was grown using load shedding to achieve a continually decreasing AK. This leads to a continual decrease in the growth rate as evidenced by the lessening of the slope of the crack growth curve in Fig. 1.
Ultrasonic Inspection
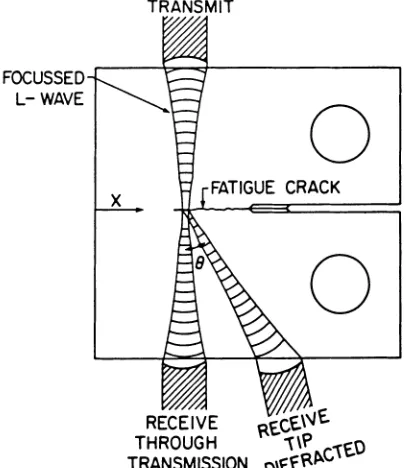
The ultrasonic inspection of the fatigue cracks was accomplished in a water immersion tank. The transmitting transducer was aligned such that
the acoustic beam interrogated the crack at normal incidence as shown in Fig. 2. A broadband (2-15 MHz) transducer with longitudinal polarization, f.ocused in the plane of the crack, was used. This focusing provides the spatial resolution necessary to study the details of the variation of closure, particularly at high frequencies where a spot size of about 1 mm is achieved. Detection is performed with an identical receiving transducer positioned in various orientations. For this study, the following orienta-tions were used: (a)
e
=
0°, which provides the through transmission signal, (b)e =
-45° toe =
45° which provides the diffracted signals. The samples were translated with respect to the transducer set-up such that the signals from the unbroken ligament (for reference purposes) and the fatigue18
16
E
14E
12
.c
..
CI 10 C
CD 8 ..I
.¥ 6
U II
..
4(,)
2
0
0 2 4
:
6
I
I
I
,
,
,
,
8 10 12
21 Cycle Block Single Cycle Decreasing t.K
14 16 18
Number of Cycles, X 104
20
[image:2.482.98.368.404.597.2]TRANSMIT
o
x
o
Fig. 2. Experimental set-up for through transmission and diffracted waves. Diffracted wave reception shown is for
e
=
45°.crack were determined as a function of pos1t10n x in the plane of the crack. The received through-transmitted or diffracted waveform was digi-tized at a 10 nsec sampling rate using a Tektronix digital processing oscilloscope. These data were stored for further processing in a Digital Equipment Corporation LSI-II computer. All stored waveforms were Fourier transformed into the frequency domain and normalized using the through transmitted signal from the unbroken ligament as a reference.
EXPERIMENTAL ULTRASONIC RESULTS
The experimental ultrasonic results for the through transmitted signal, generated at 10 MHz, are shown in Fig. 3. The crack extends into the figure from the right as indicated by the low transmission coefficient. The peaks in the through transmitted signal at approximately 15 mm for the two overload specimens correspond very well to the position of the crack tip when the overloads were applied. Therefore it is suggested that these peaks are a result of additional crack closure caused by the increased size of the plastic deformation zone at the time of the overload application.
The third curve in Fig. 3 for the crack grown with a decreasing 6K exhibits partial closure all along the crack as evidenced by the relatively high transmission coefficient values of approximately 0.25. This is in contrast to fatigue cracks grown under constant ~ conditions, where the
[image:3.482.137.340.31.265.2]•
"
::I 1.1 !::C 1.0 OJ
"
0.9:I
0.8C 0 0.7
(I) 0.6
en
.-E
0.5(I)
0.4 C
!
0.3t-.c
0.2OJ 0.1 ::I 0 0.0
..
.c
t-,~
0
'l-21 Cycle Block Single Cycle Decreasing 11K
'
...
"..
, ... ' .. ,." .'~ 6 ~ ~ ~ ~ ~ ~ ~ ~ ~ ~
Distance, mm
Fig. 3. Through transmission results at 10 MHz for overload and decreasing
Il< cracks.
0.10
•
0.09"
::I 0.08 !: 0.07C OJ 0.06
"
:I
0.05"
..
•
0.04U
"
0.03..
...
:::
0.02 Q0.01
0.00
0
'2-21 Cycle Block Single Cycle Decreasing 11K
~ 6 ~ ~ ~ ~ ~ ~ ~ ~ ~ ~
Distance, mm
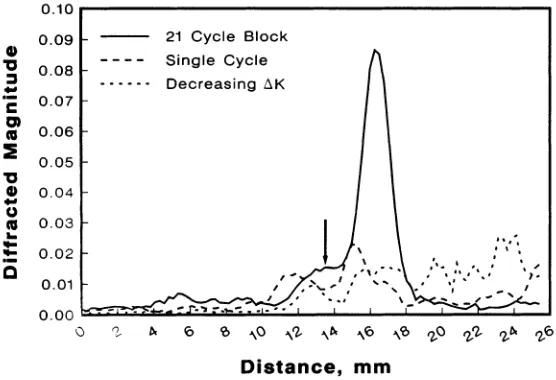
Fig. 4. Diffracted wave results at 10 MHz for overload and decreasing 6K cracks. Arrow denotes crack tip position for decreasing Il< crack.
The 10 MHz diffracted signals at
e =
-450 are shown in Fig. 4 with the [image:4.482.108.377.39.230.2] [image:4.482.102.380.289.479.2]of the crack tip when the overloads were applied. The height of this peak increases dramatically with increasing number of overload cycles.
Apparently these peaks are generated by relatively isolated regions of closure allowing the peak to be well defined.
The crack that was grown under decreasing AK loading shows diffracted signals occurring all along the crack length due to the closure that was also seen in Fig. 3. Since this closure occurs throughout the length of the crack rather than in an isolated region, it is not surprising that the diffracted signals are present. It is interesting to note however that immediately after the crack tip is passed, the diffracted signal shows a dip before increasing to a relatively constant value throughout the rest of the crack. This dip may be due to a small open region at the crack tip as noted in earlier experiments
[7].
COMPARISON TO MODEL PREDICTION
The experimental data presented in Fig. 3 and 4 were compared against predictions generated from the distributed spring model
[6].
This model uses the electromechanical reciprocity theory of Auld[8],
which states that the change induced in the signal transmitted from an illuminating to a receiving transducer by a flaw,or,
is given bywhere u. R, , .. R are the displacement and stress fields that would be producea if ~~e receiving transducer irradiated a flaw free material;
(1)
uiT and 'i· T are the displacement and stress fields produced when the flaw is irradia~ed by the transmitting transducer, P is the electrical power exciting the transducer, w is the angular frequency, and integration is performed over the surface of the scatterer, which has a normal nj'
Using appropriate boundary conditions and assuming normal illumination of the interface by a plane wave leads to the form
jw
r
=
2PJ
A [l+j a]-lu /'3l
dA (2) where a=
wpyf/K, where p is the density, v the acoustic velocity, f the illuminating frequency, K is a distributed spring constant relating the dynamic relative displacements of the sides of the contacting interface to the dynamic stress, and the quantity in brackets can be shown to be the plane wave transmission coefficient.In through transmission, excellent fits of Eq. (2) to experimental data as a function of measurement frequency are generally obtained when
K is viewed as an adjustable parameter. This agreement has been achieved for a variety of samples [9-12]. For the data shown earlier, K(X) was chosen such that Eq. (2) represents the best fit to the transmission data. We chose
( ) K e-Bx + K1
K x
=
o
1 + [2 (x-a), 1]4 (3)In using this spring model calculation to predict the diffracted signals from the closure regions it has been found necessary to include the effect of discrete contacts into the model [12]. These contacts are introduced such that their average K still represents the spring constant
in Eq. (2), thereby leaving the through transmission results unchanged. It has been found that the number density of contacts strongly influences the strength of the diffracted signals. For the interested reader, the details of the theory are described in Ref. 13.
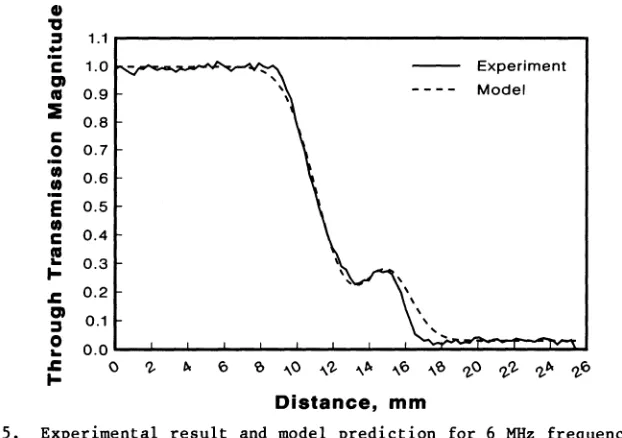
Adjustment of the parameters KO'
a
and Kl to achieve the best fit yielded the results shown in Fig. 5 for the 2l-cycle overload crack at 10 MHz. The model provides an excellent fit to the experimental data with a minor deviation on one side of the overload peak. This small discrepancy is probably due to better resolution in the experiment than the model. Currently the model uses a Gaussian representation of the ultrasonic beam and performs an integration under this Gaussian beam to calculate the energy transmitted. In order to achieve transmission coefficients on the order of 1 in the uncracked ligament for the model, the model spot size that is used is somewhat larger than that achieved by the experimental apparatus, thereby leading to some loss of the fine structure that is present in the experimental results.Equally good fits were achieved for the single cycle and decreasing
AK
cracks. The parameters used in Eq. (3) for each crack are given in Table I. For. the decreasingAK
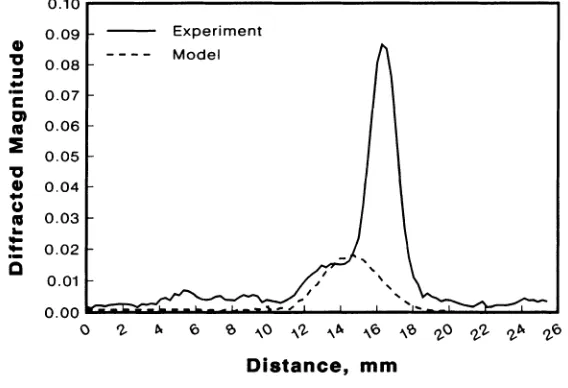
sample, however, the overload region was distributed along the crack rather than concentrated in a single section. For this crack, a minimum K value was set at 7 x 10¹² dyn/cm2 in order to provide a good fit to the experimental data.Model predictions from Eq. (2) and (3) using the data in Table I were also made for the diffracted, mode-converted waves at
a =
-45°. Comparison of the prediction and the experimental data for 10 MHz is shown in Fig. 6 ...
"
:::t 1.1 !:C 1.0
1:1 II 0.9
:e
0.8C
0 0.7
-
,.
,.
0.6E
0.5,.
0.4
C
l!
0.3
l-.e
0.21:1 0.1 :::t 0 0.0
..
.e
I- 0
rz.
Experiment Model
6. 6 '0 ,,0
"rz.
,,6. ,,6 ,,'0 rz.0rz.rz. rz.6. rz.6
Distance, mm
[image:6.482.86.397.380.599.2]Table I. Adjustable Parameters for Eg. (3) to Achieve Fit.
Overload "0 II
"
(l ydIn/cm 2 cm-1 dInlcm2 cm cm
21 Cycle lxlO lit IS 3.Sxl0 13 0.438 0.102
Single cycle 9xlO 13 40 3.Sxl0 13 0.362 0.102
Decreasins I!K 6xl0 13 18 * * *
*Overload region distributed along crack.
The predictions were made at a linear contact density of 1800 contacts per cm. The agreement here is not nearly as good as for the through transmit-ted waves. The model predicts a peak at the overload region in the dif-fracted waves that is smaller by a factor of 4.S than that observed experi-mentally. Here again, it is presumed that the loss of resolution in the model as compared to the experiment is primarily responsible for this
dif-ference. The shift in the position of the peak in the model prediction is not completely explained at this time although it could be conjectured that the model has combined the two experimental peaks observed into one smaller peak centered between the two experimental peaks.
ANGULAR DEPENDENCE OF DIFFRACTED WAVES
The angular dependence of the diffracted, mode converted waves was examined in the crack grown with decreasing
AK
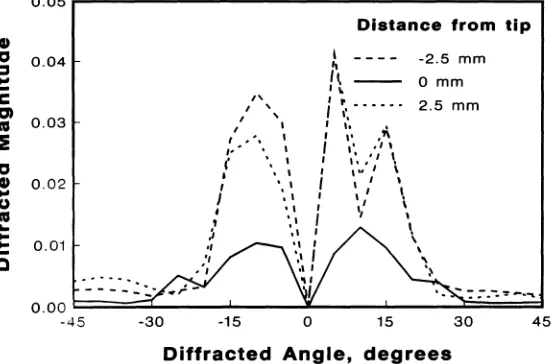
by focusing the transmitting transducer on an area of interest in the crack and recording diffracted waves at various diffracted angles in the solid. The recorded waves were normalized in the same manner as the previous scans and the magnitude of the 10 MHz signal was plotted as a function of diffraction angle. These results are shown in Fig. 7 for three positions, at the tip of the crack and 2.S mm on either side of the crack tip. The position of the crack tip is set at the SO% transmission position in Fig. 3 for the decreasing ~crack. The solid line, labeled -2.S mm, was taken 2.S mm from the crack tip in the uncracked region. The line labeled 2.S mm was taken at a posi-tion 2.S mm into the crack. It is readily apparent from the figure that
0.10
..
0.09'U 0.08
:::J
!:: 0.07
C
m 0.06
II
~ 0.05
'U
..
0.04
..
UII
..
0.03....
:!: 0.02
Q
0.01
0.00
0
'2-Experiment Model
b. 6 '0 ,,0 ,,'2- "b. ,,6 ,,'0 '2-0 '2-'2- '2-b. '2-6
Distance, mm
[image:7.482.56.425.29.94.2] [image:7.482.87.371.416.610.2]0.05
•
"
:s
0.04!:
c
0) 0.03"
:E
"
•
0.02..
U"
..
...
~ 0.01
Q
---0.00
-45 -30
"
I 'I "
I . ,
,~.#
'. ,
(
..
'
I ' ,
,
\'I ' ,
"
-15
o
Distance from tip
I -2.5 mm
r
I~ 0 mm
" • 0----.
,', 2.5 mmI I I I
r I" ,t\
"
",:,'
I.,,N
~ , I \,
'
"
~'15 30
Diffracted Angle, degrees
45
Fig. 7. Experimental angular dependence for 10 MHz diffracted waves at crack tip (0 mm), 2.5 mm into crack (2.5 mm) and 2.5 mm into uncracked ligament (-2.5 mm).
the experimental data taken at the crack tip are quite symmetric around 0·. The data taken at -2.5 and 2.5 mm distance shows the same type of structure as that obtained at the crack tip in that a peak occurs on either side of 0·. The peak at the lower angles, however, has split into a doublet for both cases with the dip occurring at the point of the maximum for the crack tip data. Further examination of this splitting is necessary for a fuller understanding.
The two curves taken at -2.5 and 2.5 mm are remarkably similar in structure. Both curves show peaks occurring at angles close to O· with the splitting mentioned earlier in the lower angle peak. The data was taken using the decreasing AK crack in order to minimize any effects due to isolated crack closure regions. Closure is present at the -2.5 mm position (see Fig. 3). The effect of this closure on the angular dependence is not known at this time. The diffracted data shown earlier (Fig. 4) were taken at -45·. Obviously, diffracted data taken at angles closer to O· yield larger peak heights and may be more sensitive to crack closure conditions.
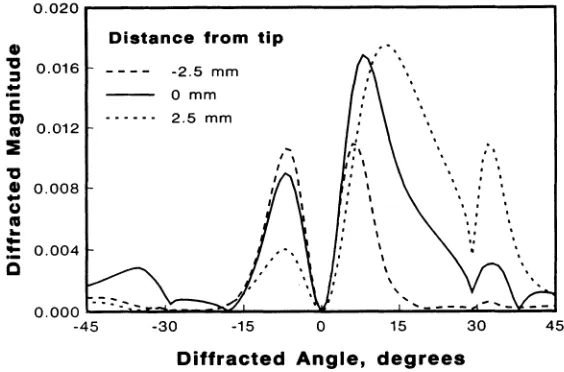
Figure 8 shows the model predictions corresponding to the experimental data given in Fig. 7. It is readily apparent that large discrepancies occur between the two graphs. The mirror plane symmetry that was present at O· for the data taken at the crack tip (0 mm) is completely lost. Even more apparent is the change that occurs between the -2.5 mm and 2.5 mm posltlons. The experimental data show only minor variations between the two positions for a given diffraction angle. The model, however, shows major changes between the two at a constant diffraction angle. The only
symmetry present occurs in the -2.5 mm data around 0·.
[image:8.482.103.379.30.212.2]0.020
CD Distance from tip
"
:::s 0.016 -2.5 mm!:
o
mmC
Q 2.5 mm
as
0.012:Ii
I""
:
,
' " ,"
...
CD 0.008,
I ICo) I
as
..
..
I:!: 0.004 I
Q
,
..
0.000
..
-45 -30 -15 0 15 30 45
Diffracted Angle, degrees
Fig. 8. Predicted angular dependence for 10 MHz diffracted waves at crack tip (0 mm), 2.5 mm into crack (2.5 mm) and 2.5 mm into uncracked ligament (-2.5 mm).
SUMMARY
Crack closure due to tensile overloads during crack growth can be detected using ultrasonic techniques. Such closure can initially be used as a preliminary determination of the history of the growth and determina-tion of the duradetermina-tion of the overload once crack growth has reinitiated.
A functional form for the distributed spring constant K can be chosen to obtain a quantitative fit between the distributed model prediction and experimental data in through transmission. The model predictions for diffracted shear waves remain lower than the obtained experimental results.
The experimental data and model predictions both show a strong angular dependence for the diffracted shear waves at positions near the crack tip. The experimental results show some surprising changes in symmetry as com-pared to the predictions of the distributed spring model. This phenomena will be investigated further.
ACKNOWLEDGEMENT
Ames Laboratory is operated for the U. S. Department of Energy by Iowa State University under contract W-7405-ENG-82. This work was supported by the Office of Basic Energy Sciences, Division of Materials Science
REFERENCES
1. W. Elber, Damage Tolerance in Aircraft Structures, ASTM STP 486, 230 (1971) •
[image:9.482.96.378.30.216.2]4. C. J. Beevers, K. Bell, R. L. Carlson and E. A. Starke, Eng. Fract. Mech. 19, 93 (1984).
5. O. Buck, ~ K. Rehbein and R. B. Thompson, "Crack Tip Shielding by Asperity Contact as Determined by Acoustic Measurements", Eng. Fract. Mech. (in press).
6. J.-M. Baik and R. B. Thompson, J. Nondes. Eval. 4. 188 (1984). 7. B. R. Tittman, L. A. Ahlberg, O. Buck, F. Cohen-Tenoudji and
G. Quentin, Review of Progress in Quantitative Nondestructive Evaluation 2A, eds. D. O. Thompson and D. E. Chimenti, Plenum Press, New York, 353 (1982).
8. B. A. Auld, Wave Motion, I, 3 (1979).
9. R. B. Thompson, C. J. Fiedler and O. Buck, Nondestructive Methods for Materials Property Determination, eds. C. O. Ruud and R. E. Green, Plenum Press, New York, 161 (1984).
10. R. B. Thompson and C. J. Fiedler, Review of Progress in Quantitative Nondestructive Evaluation 3A, eds. D. O. Thompson and D. E. Chimenti, Plenum Press, New York, 207 (1984).
11. O. Buck, R. B. Thompson and D. K. Rehbein, J. Nondes. Eval. ~, 203
(1984).
12. D. K. Rehbein, R. B. Thompson and O. Buck, Review of Progress in Quantitative Nondestructive Evaluation 4A, eds. D. O. Thompson and D. E. Chimenti, Plenum Press, New York, 61 (1985).
13. R. B. Thompson, O. Buck and D. K. Rehbein, "The Influence of Asperity Contact on the Scattering of Elastic Waves from Fatigue Cracks", Proceed in s 10th National Con ress of A lied Mechanics, (Austin,