This paper is based on the oral presentation at the 7 International Conference on Road and Airfield Pavement Technology, ICPT 2011, in Bangkok,
Article
Long-Term Pavement Performance Effectiveness of
Preventive Maintenance Treatments Using Markov
Chain Algorithm
Syed Waqar Haider
1,a,*
, Karim Chatti
2,b, and Gilbert Y. Baladi
3,c1 3562 Engineering Bldg., Dept. of Civil and Environmental Engineering, East Lansing, MI 48824, USA 2 3557 Engineering Bldg., Dept. of Civil and Environmental Engineering, East Lansing, MI 48824, USA 3 3554 Engineering Bldg., Dept. of Civil and Environmental Engineering, East Lansing, MI 48824, USA E-mail: [email protected],*, [email protected]b, [email protected]c
Abstract. In the Long-term Pavement Performance (LTPP) study, the SPS-3 experiment
was designed to assess the performance of different flexible pavement maintenance treatments, relative to the performance of untreated control sections. The experiment consists of a control section and four maintenance treatments: thin overlay, slurry seal, chip seal, and crack seal. Several studies in the past have evaluated the effectiveness of the maintenance treatments; however, there is a need to re-evaluate the results as more performance data become available. This paper uses Markov chain algorithm (MCA) to evaluate the effectiveness of maintenance treatments at the network level. For each treatment, the transition matrices were determined from the observed time series performance data for ride quality, fatigue cracking, and rutting. The advantages of using MCA includes the ability to dynamically model pavement deterioration and improvement at the same time, evaluate the impact of initial pavement conditions on the short- and long-term performance, and relative comparison of pavement performance among different maintenance treatments. The results show that different maintenance treatments have varying effectiveness depending on the distress type. For example, thin overlay is more effective in the long-term for improving IRI and rutting while chip seal seems to be a better choice in case of alligator cracking. Generally, different seals considered in the SPS-3 experiment are more effective when applied to a network in good condition while overlay is more effective for a network in poor condition.
Keywords: Long-term pavement performance, pavement maintenance treatment,
maintenance effectiveness, transition matrix, Markov chain algorithm.
ENGINEERING JOURNAL Volume 16 Issue 4
Received 5 January 2012 Accepted 27 May 2012 Published 1 July 2012
1.
Introduction
The effectiveness of preservation treatments is an integral part of project evaluation processes. Generally, the effectiveness, in terms of benefits only, can be measured in short- and long-term by using the attributes determined from the observed pavement performance with and without preservation treatments. In order to evaluate short-term effectiveness, two measures have been reported [1, 2]: (a) performance jump (J), and (b) deterioration rate reduction (DRR). ‘J’ represents the change in performance just after the fix and can be measured in the units of the performance measure (e.g. m/km for IRI or mm for rutting etc.). On the other hand, DRR is determined as the difference in the slope between before and after treatment curves and has rate of change units for the specific distress (e.g. change in IRI per year). The magnitude of DRR is influenced by the pre-treatment pavement condition and treatment type [3]. The long-term effectiveness of preservation treatments can be evaluated by using [1]: (a) treatment service life (TSL), (b) increase in average pavement condition, and (c) area bounded by treatment performance curve. TSL is determined from the treatment performance curve by extrapolating the curve to the point where the treated pavement reverts to an established threshold (depending on distress type or condition index) [1, 3, 4], and is measured in years. Average pavement condition can be determined in terms of percent change relative to the condition before treatment and can be measured in percent increase in average condition [1, 4]. Area bounded by the treatment performance curve to a predefined threshold for a distress is conceptually the best effectiveness measure. The area approach represents both the average improvement in condition and the extension in service life due to a preservation intervention. This method of evaluating effectiveness can be used for both increasing and decreasing performance curves by considering the area under and over the performance curve [5]. In addition, the area approach can be used as a surrogate for capturing broader range of user benefits [1].
While the pavement preventive maintenance is believed to result in lower agency costs, improved road conditions, and increased user benefits, these programs face many impediments. Among the concerns are lack of evidence for cost-effectiveness and inadequate guidance on the timings of preventive maintenance treatments [5]. As a result, there is a need for a rational and a practical methodology for evaluating cost-effectiveness and estimating optimal timings of such treatments. The latter concern have been addressed in several studies [5-9] both at project and network levels. In this paper, the short- and the long-term network level effectiveness of preventive maintenance treatments from the LTPP SPS-3 experiment is evaluated using Markov chain algorithm (MCA). The SPS-3 experiment was designed to evaluate the performance of different flexible pavement maintenance treatments relative to the performance of untreated control sections [10, 11]. The core SPS-3 experiment consists of a control section (340) and four maintenance treatments: thin overlay (310), slurry seal (320), crack seal (330), and chip seal (350). The numbers in parenthesis show the designation of pavement sections for each treatment. The SPS-3 pavement performance data were acquired from the Release 24 of the LTPP database.
2.
Markov Chain Algorithm
The Markovian property is equivalent to stating that the pavement condition probability of any future “event”, given any past “event” and the present state Xt i, is independent of the past event and depends
on only the present state of the process. The conditional probability P X
t1 j X| t i
is called transition probability. If for each iandj
, P X
t1 j X| t i
P X
1 j X| 0 i
, for all t0,1..., then the (one step)transition probabilities are called stationary and are denoted by pij . Therefore, having stationary probabilities implies that the transition probabilities do not change in time. The existence of stationary (one step) transition probabilities also implies that for each i j, and n
n0,1, 2...
,
t n | t
n | 0
P X j X i P X j X i for all
t
0,1....
These condition probabilities are usuallydenoted by ( )n ij
p
and are called n-step transition probabilities. Thus, ( )n ijp
is just the condition probabilitythat the random variable X, starting in state i, will be in state j after exactly n-steps (time units). Since ( )n ij
p
are condition probabilities, those must satisfy the following properties:b. ( ) 0
1, for all and 0,1, 2,...
M n ij j
p i n
A conventional notation for representing the transition probabilities is the matrix form
( ) ( )
00 0
( )
( ) ( ) 0
State 0 1...
0
P , for 0,1, 2, ...
1 n n M n n n M MM m p p n
M p p
(1) Or equivalently ( ) ( ) 00 0 ( ) ( ) ( ) 0 P n n M n n n M MM p p p p (2)
It is now possible to define a Markov chain. A stochastic process {Xt}
(
t
0,1,2...)
is said to be afinite-state Markov chain if it has the following attributes: a. A finite number of states
b. The Markovian property
c. Stationary transition probabilities
d. A set of initial probabilities P X
0 i
for all i The ( )nij
p transition probability can be useful when the process is in state i and the probability that the process will be in state
j
after n periods is desired. The Chapman-Kolmogorov equations provide a method for computing these n-step transition probabilities:( ) ( ) ( )
0
, for all , , , and 0
M
n v n v
ij ik kj k
p p p i j n v n
(3)The above equations explain that going from statei to state
j
in n steps the process will be in some state k after exactly v (less than n) steps. Thus, ( )v (n v)ik kj
p p is just the conditional probability that, starting from
statei, the process goes to statekafter
v
steps and then to statej
inn v
steps. Therefore, summing these conditional probabilities over all kmust yield ( )nij
p . It is evident that the n-step transition probabilities can be
obtained from one-step transition probabilities recursively. In general, the matrix of n-step transition probabilities can be determined from the following matrix notation:
( ) 1
P
n
P
nP
(4)An important aspect of the Markov chain is its steady-state probabilities. In many cases, the initial state probabilities are not well known and it is meaningful to ask the question “Do the ( )n
ij
p probabilities take on
values which are independent of the initial state?” i.e., can one give the probability of pavement condition at some future time without knowing whether the pavement condition was known or not. In different words, does the process reach a probabilistic steady state or equilibrium condition, and is this condition independent of its starting position? Note that the steady state does not suggest that the process is fixed in a given state, but rather that it is moving (stochastically) among states in a manner that is uninfluenced by “starting transients” [12].
3.
Data Analysis
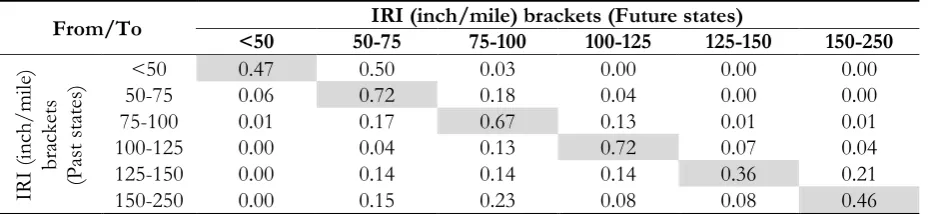
To model pavement deterioration and preservation with time, it is necessary to identify the Markov probability transition matrix. The one-step transition matrices were determined using the temporal distress data for different performance measures within each pavement treatment. All the pavement sections in the SPS-3 experiment were considered in the analysis. The pavement condition was monitored on the average every year for all the sections. As mentioned before, five distress states were considered for each performance measure (i.e., cracking, rutting and IRI). For example, Tables 1 and 2 present transition matrices for thin overlay and slurry seal treatments, respectively, for the case of IRI.
Table 1. Transition matrix for thin overlay.
From/To <50 50-75 IRI (inch/mile) brackets (Future states) 75-100 100-125 125-150 150-250
IR I (inch /m ile) br ack ets (Pa st sta tes)
<50 0.47 0.50 0.03 0.00 0.00 0.00
50-75 0.06 0.72 0.18 0.04 0.00 0.00
75-100 0.01 0.17 0.67 0.13 0.01 0.01
100-125 0.00 0.04 0.13 0.72 0.07 0.04
125-150 0.00 0.14 0.14 0.14 0.36 0.21
150-250 0.00 0.15 0.23 0.08 0.08 0.46
Table 2. Transition matrix for slurry seal.
From/To <50 50-75 IRI(inch/mile) brackets (Future states) 75-100 100-125 125-150 150-250
IR I (inch /m ile) br ack ets (Pa st sta tes)
<50 0.61 0.36 0.04 0.00 0.00 0.00
50-75 0.03 0.75 0.22 0.00 0.00 0.00
75-100 0.00 0.07 0.72 0.16 0.03 0.03
100-125 0.00 0.00 0.12 0.57 0.28 0.04
125-150 0.00 0.00 0.00 0.16 0.68 0.16
150-250 0.00 0.00 0.00 0.06 0.12 0.82
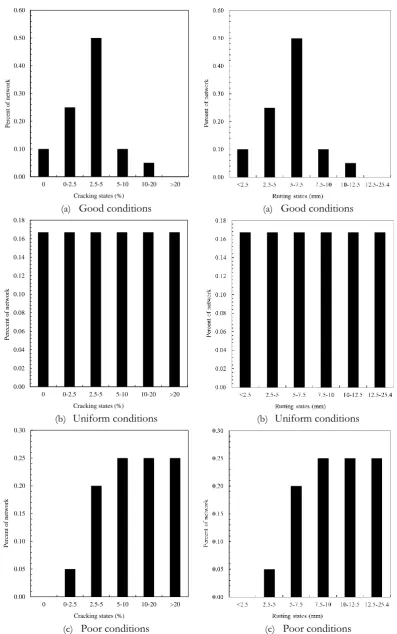
[image:4.595.68.536.243.350.2] [image:4.595.67.530.402.510.2](a) Good conditions (a) Good conditions
(b) Uniform conditions (b) Uniform conditions
(c) Poor conditions Fig. 1. Network cracking distributions.
[image:5.595.98.496.75.710.2](c) Poor conditions Fig. 2. Network rutting distribution.
0.00 0.10 0.20 0.30 0.40 0.50 0.60
0 0-2.5 2.5-5 5-10 10-20 >20
Percen t o f n et w o rk
Cracking states (%)
0.00 0.02 0.04 0.06 0.08 0.10 0.12 0.14 0.16 0.18
0 0-2.5 2.5-5 5-10 10-20 >20
Pe rec en t o f n et wo rk
Cracking states (%)
0.00 0.05 0.10 0.15 0.20 0.25 0.30
0 0-2.5 2.5-5 5-10 10-20 >20
Percen t o f n et w o rk
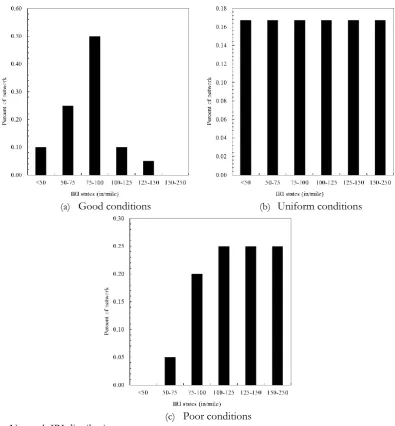
(a) Good conditions (b) Uniform conditions
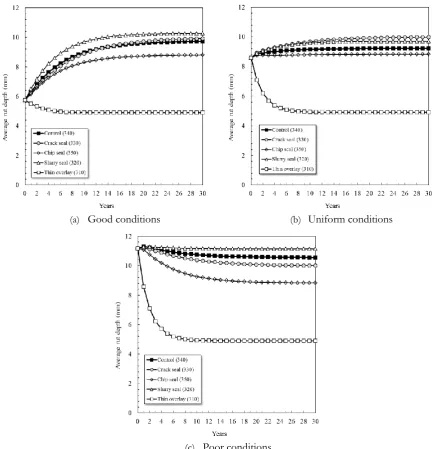
(c) Poor conditions Fig. 3. Network IRI distributions.
4.
Analysis Results
The initial network level conditions mentioned above were used in the n-step MCA, as explained before, by employing transition matrices for each preventive maintenance treatment type. These analyses yielded both the short- and the long-term treatment effectiveness at the network level. The results of the treatment effectiveness analyses for each performance measure are briefly presented next.
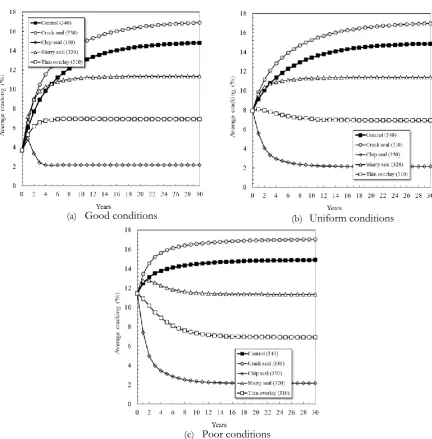
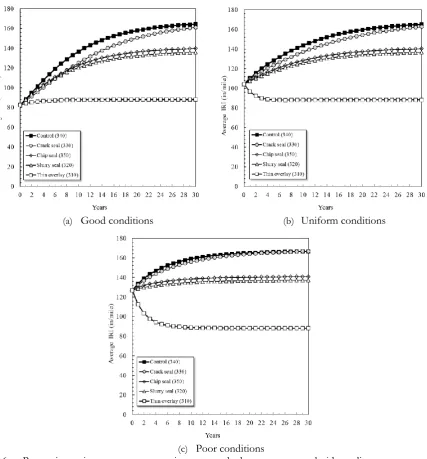
4.1. Fatigue Cracking
[image:6.595.98.494.77.504.2](a) Good conditions (b) Uniform conditions
(c) Poor conditions
Fig. 4. Preventive maintenance treatments impacts on the long-term network cracking performance.
4.2. Surface Rutting
[image:7.595.75.508.74.514.2](a) Good conditions (b) Uniform conditions
(c) Poor conditions
Fig. 5. Preventive maintenance treatments impacts on the long-term network rutting performance.
The results show that thin overlay is the most effective treatment to mitigate surface rutting at the network level. Applying thin overlay in the short-term (earlier in life) seems less beneficial as the network will approach steady state in about 8 years while delaying the treatment may take somewhat equivalent time to reach stable conditions, especially when the network is in poor conditions. All seals are less effective in reducing the surface rutting when compared to the control condition. Slurry and crack seals as applied in the SPS-3 experiment do not exhibit any effectiveness against surface rutting, especially in the short-term.
4.3. Ride Quality in Terms of IRI
[image:8.595.78.518.82.532.2]conditions. All seals are less effective in reducing the surface roughness when compared to the control condition. Slurry, chip and crack seals as applied in the SPS-3 experiment do not exhibit any effectiveness against surface roughness, both in the short- and long-term.
(a) Good conditions (b) Uniform conditions
(c) Poor conditions
Fig. 6. Preventive maintenance treatments impacts on the long-term network ride quality.
5.
Conclusions
[image:9.595.85.513.130.590.2]seal seems to be a better choice in case of alligator cracking. Generally, different seals considered in the SPS-3 experiment are more effective when applied to a network in good condition while overlay is more effective for a network in poor condition.
References
[1] M. B. Khurshid, M. Irfan, and S. Labi, “Comparing of methods for evaluating pavement interventions: Evaluation and case study,” Transportation Research Record, no. 2108, pp. 25-36, 2009.
[2] R. Smith, T. Freeman, and O. Pendleton, “Pavement maintenance effectiveness,” Strategic Highway Research Program, National Research Council, Washington, DC, Report SHRP-H-358, 1993.
[3] S. Labi and K. C. Sinha, “Effectiveness of highway pavement seal coating treatments,” Journal of Transportation Engineering, vol. 130, no. 1, pp. 14-23, 2004.
[4] S. Labi, G. Lamptey, and K. C. Sinha, “Analysis of long-term effectiveness of thin hot-mix asphaltic concrete overlay treatments,” Transportation Research Record, no. 1940, pp. 3-12, 2005.
[5] D. G. Peshkin, T. E. Hoerner, and K. A. Zimmerman, “Optimal timing of pavement preventive maintenance treatment applications,” Transportation Research Board, Washington, DC, NCHRP Report 523, 2004.
[6] G. Lamptey, S. Labi, and K. C. Sinha, “Optimization of preventive maintenance schedule within intervals of pavement rehabilitation,” Transportation Research Record, vol. 84, 2005.
[7] M. J. Markow and W. S. Balta, “Optimum rehabilitation frequencies for highway pavements,”
Transportation Research Record,no. 1035, pp. 31-43, 1985.
[8] K. Abaza and S. Ashur, “Optimum decision policy for management of pavement maintenance and rehabilitation,” Transportation Research Record,no. 1655, pp. 8-15, 1999.
[9] S. W. Haider and M. B. Dwaikat, “Estimating optimum timings for preventive maintenance treatments to mitigate pavement roughness,” Transportation Research Record, no. 2235, pp. 43-53, 2011. [10] K. T. Hall, C. E. Correa, and A. L. Simpson, “Performance of flexible pavement maintenance
treatments in the long-term pavement performance SPS-3 experiment,” Transportation Research Record,
no. 1823, pp. 47-54, 2003.
[11] D.-H. Chen, D.-F. Lin, and H.-L. Luo, “Effectiveness of preventative maintenance treatments using fourteen SPS-3 sites in Texas,” Journal of Performance of Constructed Facilities, vol. 17, no. 3, pp. 136-143, 2003.
[12] F. S. Hillier and G. J. Lieberman, Operations Research, 2nd ed. San Francisco: Holden-Day, Inc, 1974. [13] A. Butt, M. Shahin, S. Carpenter, and J. Carnahan, “Application of Markov process to pavement
management systems at network level,” in Proceedings of the 3rd International Conference on Managing
Pavements, San Antonio, Texas, 1994, pp. 159-172.
[14] A. Butt, M. Shahin, K. Feighan, and S. Carpenter, “Pavement performance prediction model using the Markov process,” Transportation Research Record, vol. 1123, no. pp. 12-19, 1987.
[15] K. A. Abaza, S. A. Ashur, and I. A. Al-Khatib, “Integrated pavement management system with a Markovian prediction model,” Journal of Transportation Engineering, vol. 130, no. 1, pp. 24-33, 2004. [16] M. Black, A. Brint, and J. Brailsford, “A semi-Markov approach for modelling asset deterioration,”